National Research Institute for Earth Science and Disaster Resilience
Technical Note of the National Research Institute
for Earth Science and Disaster Resilience:
No.416January 2018
第
416
号
メ
キ
シ
コ
中
部
地
震
調
査
速
報
防
災
科
学
技
術
研
究
所
防災科学技術研究所研究資料
第四一六号
National Research Institute for Earth Science and Disaster Resilience, Japan 国立研究開発法人
防災科学技術研究所
メキシコ中 部 地 震 調 査 速 報
Flash Report on the Damage of Mexico City and Puebla Related
to the 2017 Puebla-Morelos Earthquake
表紙写真 ・・・右上:ケツァルコアトルと言われる羽蛇として表される伝説のアステカ族の神、降り立った地点がメキシコシティ中心部 第391 号 大規模空間吊り天井の脱落被害メカニズム解明のための E-ディフェンス加振実験 報告書 -大規模空間吊り天 井の脱落被害再現実験および 耐震吊り天井の耐震余裕度検証実験- 193pp.2015 年 2 月発行 第392 号 地すべり地形分布図 第 58 集 「鹿児島県域諸島」 27 葉(5 万分の 1).2015 年 3 月発行 第393 号 地すべり地形分布図 第 59 集「伊豆諸島および小笠原諸島」 10 葉(5 万分の 1).2015 年 3 月発行 第394 号 地すべり地形分布図 第 60 集「関東中央部」 15 葉(5 万分の 1).2015 年 3 月発行 第395 号 水害統計全国版データベースの整備.発行予定 第396 号 2015 年 4 月ネパール地震(Gorkha 地震 ) における災害情報の利活用に関するヒアリング調査 58pp.2015 年 7 月発行 第397 号 2015 年 4 月ネパール地震 (Gorkha 地震 ) における建物被害に関する情報収集調査速報 16pp.2015 年 9 月発行 第398 号 長岡における積雪観測資料 (37) (2014/15 冬期) 29pp.2015 年 11 月発行 第399 号 東日本大震災を踏まえた地震動ハザード評価の改良(付録 DVD) 253pp.2015 年 12 月発行 第400 号 日本海溝に発生する地震による確率論的津波ハザード評価の手法の検討(付録 DVD) 216pp.2015 年 12 月発行 第401 号 全国自治体の防災情報システム整備状況 47pp.2015 年 12 月発行 第402 号 新庄における気象と降積雪の観測(2014/15 年冬期 ) 47pp.2016 年 2 月発行 第403 号 地上写真による鳥海山南東斜面の雪渓の長期変動観測(1979 ~ 2015 年) 52pp.2016 年 2 月発行 第404 号 2015 年 4 月ネパール地震 (Gorkha 地震 ) における 地震の概要と建物被害に関する情報収集調査報告 54pp. 2016 年 3 月発行 第405 号 土砂災害予測に関する研究集会-現状の課題と新技術-プロシーディング 220pp.2016 年 3 月発行 第406 号 津波ハザード情報の利活用報告書 132pp.2016 年 8 月発行 第407 号 2015 年 4 月ネパール地震 (Gorkha 地震 ) における災害情報の利活用に関するインタビュー調査 -改訂版- 120pp.2016 年 10 月発行 第408 号 新庄における気象と降積雪の観測 (2015/16 年冬期 ) 39pp.2017 年 2 月発行 第409 号 長岡における積雪観測資料 (38) (2015/16 冬期) 28pp.2017 年 2 月発行 第410 号 ため池堤体の耐震安全性に関する実験研究 -改修されたため池堤体の耐震性能検証- 87pp.2017 年 2 月発行 第411 号 土砂災害予測に関する研究集会-熊本地震とその周辺-プロシーディング 231pp.2017 年 3 月発行 第412 号 衛星画像解析による熊本地震被災地域の斜面・地盤変動調査 -多時期ペアの差分干渉 SAR 解析による地震後の 変動抽出- 107pp.2017 年 9 月発行 第413 号 熊本地震被災地域における地形・地盤情報の整備 -航空レーザ計測と地上観測調査に基づいた防災情報データ ベースの構築- 154pp.2017 年 9 月発行 第414 号 2017 年度全国市区町村への防災アンケート結果概要 69pp.2017 年 12 月発行 第415 号 全国を対象とした地震リスク評価手法の検討 450pp.2018 年 3 月発行予定 第349 号 防災科学技術研究所による深層掘削調査の概要と岩石物性試験結果(足尾・新宮・牛伏寺)(付録CD-ROM)12pp. 2010 年 8 月発行 第350 号 アジア防災科学技術情報基盤(DRH-Asia) コンテンツ集 266pp.2010 年 12 月発行 第351 号 新庄における気象と降積雪の観測(2009/10 年冬期) 31pp.2010 年 12 月発行 第352 号 平成 18 年度 大都市大震災軽減化特別プロジェクトⅡ 木造建物実験 - 震動台活用による構造物の耐震性向上研究 - (付録CD-ROM)120pp.2011 年 1 月発行 第353 号 地形・地盤分類および常時微動の H/V スペクトル比を用いた地震動のスペクトル増幅率の推定 242pp. 2011 年 1 月発行 第354 号 地震動予測地図作成ツールの開発(付録 DVD) 155pp.2011 年 5 月発行 第355 号 ARTS により計測した浅間山の火口内温度分布(2007 年 4 月から 2010 年 3 月) 28pp.2011 年 1 月発行 第356 号 長岡における積雪観測資料(32) (2009/10 冬期) 29pp.2011 年 2 月発行 第357 号 浅間山鬼押出火山観測井コア試料の岩相と層序(付録 DVD) 32pp.2011 年 2 月発行
第358 号 強震ネットワーク 強震データ Vol. 29(平成 22 年 No. 1)(CD-ROM 版).2011 年 2 月発行
第359 号 強震ネットワーク 強震データ Vol. 30(平成 22 年 No. 2)(CD-ROM 版).2011 年 2 月発行
第360 号 K-NET・KiK-net 強震データ(1996 - 2010)(DVD 版 6 枚組).2011 年 3 月発行 第361 号 統合化地下構造データベースの構築 <地下構造データベース構築ワーキンググループ報告書> 平成 23 年 3 月 238pp.2011 年 3 月発行 第362 号 地すべり地形分布図 第 49 集「旭川」 16 葉(5 万分の 1).2011 年 11 月発行 第363 号 長岡における積雪観測資料(33) (2010/11 冬期) 29pp.2012 年 2 月発行 第364 号 新庄における気象と降積雪の観測(2010/11 年冬期) 45pp.2012 年 2 月発行 第365 号 地すべり地形分布図 第 50 集「名寄」 16 葉(5 万分の 1).2012 年 3 月発行 第366 号 浅間山高峰火山観測井コア試料の岩相と層序(付録 CD-ROM) 30pp.2012 年 2 月発行 第367 号 防災科学技術研究所による関東・東海地域における水圧破砕井の孔井検層データ 29pp.2012 年 3 月発行 第368 号 台風災害被害データの比較について(1951 年~ 2008 年,都道府県別資料)(付録CD-ROM)19pp.2012 年 5 月発行 第369 号 E-Defense を用いた実大RC 橋脚(C1-5 橋脚)震動破壊実験研究報告書 - 実在の技術基準で設計した RC 橋脚の耐 震性に関する震動台実験及びその解析- (付録 DVD) 64pp.2012 年 10 月発行 第370 号 強震動評価のための千葉県・茨城県における浅部・深部地盤統合モデルの検討(付録 CD-ROM) 410pp.2013 年 3 月発行 第371 号 野島断層における深層掘削調査の概要と岩石物性試験結果(平林・岩屋・甲山)(付録CD-ROM) 27pp.2012 年 12 月発行 第372 号 長岡における積雪観測資料 (34) (2011/12 冬期 ) 31pp.2012 年 11 月発行 第373 号 阿蘇山一の宮および白水火山観測井コア試料の岩相記載(付録 CD-ROM) 48pp.2013 年 2 月発行 第374 号 霧島山万膳および夷守台火山観測井コア試料の岩相記載(付録 CD-ROM) 50pp.2013 年 3 月発行 第375 号 新庄における気象と降積雪の観測(2011/12 年冬期) 49pp.2013 年 2 月発行 第376 号 地すべり地形分布図 第 51 集「天塩・枝幸・稚内」 20 葉(5 万分の 1).2013 年 3 月発行 第377 号 地すべり地形分布図 第 52 集「北見・紋別」 25 葉(5 万分の 1).2013 年 3 月発行 第378 号 地すべり地形分布図 第 53 集「帯広」 16 葉(5 万分の 1).2013 年 3 月発行 第379 号 東日本大震災を踏まえた地震ハザード評価の改良に向けた検討 349pp.2012 年 12 月発行 第380 号 日本の火山ハザードマップ集 第 2 版(付録 DVD) 186pp.2013 年 7 月発行 第381 号 長岡における積雪観測資料 (35) (2012/13 冬期) 30pp.2013 年 11 月発行 第382 号 地すべり地形分布図 第 54 集「浦河・広尾」 18 葉(5 万分の 1).2014 年 2 月発行 第383 号 地すべり地形分布図 第 55 集「斜里・知床岬」 23 葉(5 万分の 1).2014 年 2 月発行 第384 号 地すべり地形分布図 第 56 集「釧路・根室」 16 葉(5 万分の 1).2014 年 2 月発行 第385 号 東京都市圏における水害統計データの整備(付録 DVD) 6pp.2014 年 2 月発行
第386 号 The AITCC User Guide –An Automatic Algorithm for the Identification and Tracking of Convective Cells– 33pp. 2014 年 3 月発行
第387 号 新庄における気象と降積雪の観測(2012/13 年冬期) 47pp.2014 年 2 月発行
第388 号 地すべり地形分布図 第 57 集 「沖縄県域諸島」 25 葉(5 万分の 1).2014 年 3 月発行
第389 号 長岡における積雪観測資料 (36) (2013/14 冬期) 22pp.2014 年 12 月発行
第390 号 新庄における気象と降積雪の観測(2013/14 年冬期) 47pp.2015 年 2 月発行
© National Research Institute for Earth Science and Disaster Resilience 2018
防災科学技術研究所研究資料 第416 号 – 編集委員会– 平成30 年 1 月 31 日 発行 ※防災科学技術研究所の刊行物については,ホームページ(http://dil-opac.bosai.go.jp/publication/)をご覧下さい. 編集兼 国立研究開発法人 発行者 防 災 科 学 技 術 研 究 所 〒305-0006 茨 城 県 つ く ば 市 天 王 台3 - 1 電話 (029)863-7635 http://www.bosai.go.jp/ 印刷所 前 田 印 刷 株 式 会 社 茨 城 県 つ く ば 市 山 中152-4 (委員長) 河合 伸一 (委 員) 松澤 孝紀 三輪 学央 若月 強 平島 寛行 中村いずみ (事務局) 臼田裕一郎 横山 敏秋 (編集・校正) 樋山 信子
Flash Report on the Damage of Mexico City and Puebla Related to
the 2017 Puebla-Morelos Earthquake
Tsuneo OHSUMI* and Yuji DOHI*
*Integrated Research on Disaster Risk Reduction Division,
National Research Institute for Earth Science and Disaster Resilience, Japan
Abstract
An earthquake with a moment magnitude (Mw) of 7.1 occurred at 13:14 CDT (18:14 UTC) on September 19, 2017, in the city of Puebla in Mexico. A damage survey was conducted in the affected area from November 18 to 21 by a team from the National Research Institute for Earth Science and Disaster Resilience. This paper outlines the findings of the survey in terms of the various aspects of the earthquake that affected Mexico City and surrounding areas. It was observed that the main damage was to masonry reinforced concrete buildings and the most heavily damaged structures correspond to areas underlain by soft soils 10–20 m in thickness. Comparison of estimated acceleration distribution for periods of 1 s corresponds to 8–12 story buildings, and these period areas correspond to heavily damaged structures. In the city of Atlixco, most of the damage was to church buildings.
Key words : 2017 Puebla-Morelos Earthquake, Mexico City, Puebla, Earthquake disaster, Disaster resilience technology
* 3-1 Tennodai, Tsukuba, Ibaraki, 305-0006, Japan
Fig. 1 Maps of Mexico City and surrounds showing the survey routes followed (red lines)
(OpenStreetMap https://www.openstreetmap.org/).
1. Introduction
An earthquake with a moment magnitude (Mw) of 7.1 occurred at 13:14 CDT (18:14 UTC) on September 19, 2017, in the city of Puebla, Mexico. The epicenter was in central Mexico (18.58° N 98.40° W) at a depth of 51 km (USGS: U.S. Geological Survey). The earthquake was officially named the 2017 Puebla earthquake because the epicenter was located beneath the city of Puebla, and the shallow depth resulted in
it being highly destructive.
Statistics provided by The National Coordinator of Civil Protection of the Ministry of the Interior indicate that 369 casualties were recorded on October 5. Mexico City had the highest number of deaths (228), while 73 deaths were recorded in Morelos. A total of 45 deaths were recorded in Puebla, 13 in the State of Mexico, 6 in Guerrero and 1 in Oaxaca.
Mexico City
Puebla
Atlixco Mexico City
2. Tectonics Setting and Historical Earthquakes in Mexico 2.1 Tectonic Setting
Based on data from the trans-Mexico temporary broadband seismic network centered on Mexico City, Pérez-Campos, X., et al. (2008)1) indicate that the Cocos Plate subducts
horizontally beneath central Mexico and tectonically underplates the base of the crust for a distance of 250 km from the trench. The Cocos Plate is decoupled from the crust by a very thin low viscosity zone. Fig. 2.1 shows a 3D image of the composite model derived from the Mexico Subduction Experiments (MASE) seismic array.
2.2 Tectonic Interpretation of the 2017 Puebla-Morelos Earthquake on September 19, 2017
In a section perpendicular to the Mesoamerican trench (Fig. 2.2) it can be seen that the hypocenter of the earthquake occurred just below the continental plate, within the Cocos Plate. The hypocenter is represented by a red star and the black points correspond to hypocenters of other earthquakes, for the period 2000–2016. The dashed orange line indicates the approximate depth of the continental crust and the gray dashed lines correspond to the geometry of the Cocos Plate beneath the North American Plate2).
2.3 Historical earthquakes that have occurred of Mexi-can
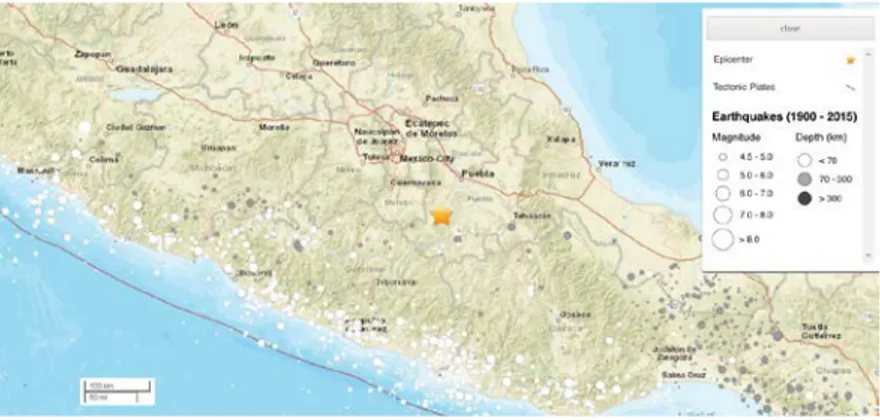
Fig. 2.3 shows the most important earthquakes that have
occurred in Mexico since 1902. Other earthquakes that are of less importance for assessing the seismic hazard are those located within the oceanic fracture zones. These earthquakes have not caused appreciable damage because of their location beneath the seabed, far from coastal areas. The yellow star indicates the epicenter of the earthquake of September 19, 2017. The various colored ellipses correspond to areas of inter-plate rupture earthquakes in Mexico. The red (deep earthquakes) and blue stars (shallow earthquakes) are the epicenters of intraplate earthquakes3).
Located in the subduction zone of the Cocos Plate on the east coast of the Pacific Ocean, the Mexican Pacific coastal area is one of the most earthquake- and tsunami-prone regions in the world. However, the offshore Guerrero State is a seismically unaffected area, and has been referred to as the “Guerrero earthquake seismic gap area” since 1911. No major earthquake of Mw 7 or more has occurred in this region since 1911 (Itou, 2016)4).
Fig. 2.4 shows the seismicity of the Puebla-Morelos
earthquake in Mexico. According to the USGS5), the area
west of the Gulf of California is moving northwestward with the Pacific Plate at about 50 mm per year. Here, the Pacific and North American Plates form a strike-slip fault boundary which is the southern extension of the San Andreas Fault.
In the past, the relative plate motion pulled Baja California away from the coast, forming the Gulf of California, and is the cause of current earthquakes in the Gulf of California.
Fig. 2.5 shows a comparison of earthquake seismicity (Mw
7 or greater) for Mexico since 1907. There are 29 earthquakes greater than 7 degrees of magnitude in the last two centuries. Some of them have been devastating. On September 19, 1985, the earthquake of Mw 8.1, caused 8 thousand casualties and collapsed hundreds of buildings in this city.
Fig. 2.1 3D images of a composite model derived from the
Mexico Subduction Experiments (MASE) seismic array (after Pérez-Campos, X., et al. (2008)) 1).
Fig. 2.2 Epicentral section perpendicular to the Mesoamerican
trench. The hypocenter of the September 19, 2017 Puebla-Morelos earthquake is represented by a red star. Black dots indicate the hypocenters of other seismic events in the region2).
Fig. 2.3 Map showing the distribution and dates of the most important earthquakes in Mexico since 1902.
The epicenter of the 2017 Puebla-Morelos earthquake is shown by the large yellow star3).
Fig. 2.5 Histograms comparing earthquake magnitudes (Mw 7.0–8.2) in Mexico during the last 110 years (courtesy
of EL FINANCIERO, September 26, 2017). (Courtesy of EL FINANCIERO, September 26, 2017)
Fig. 2.4 Seismic magnitude map (1900–2015) of Mexico showing the position of the 2017 Puebla-Morelos
2.4 Comparison of the Mw 8.2 Chiapas and Mw 7.1 Pueb-la-Morelos earthquakes
Mw 8.2 Chiapas earthquake: a
In offshore Chiapas, Mexico, an Mw 8.2 earthquake occurred in September 8, 2017 as the result of normal faulting at an intermediate depth. According to the USGS, focal mechanism solutions for the earthquake indicate that slip occurred on either a fault dipping very shallowly towards the southwest, or on a steeply dipping fault striking NW–SE. This focal mechanism is not a pure “eyeball” in appearance.
The Cocos Plate converges obliquely in a northeasterly direction with North America at a rate of approximately 76 mm/yr. The Cocos Plate begins its subduction beneath Central America at the Middle America Trench, just over 100 km to the southwest of the Chiapas earthquake.
Mw 7.1 Puebla-Morelos earthquake: b
In Central Mexico, an Mw 7.1 earthquake occurred on September 19, 2017 as a result of normal faulting at a depth of approximately 50 km. According to the USGS, focal mechanism solutions indicate that the earthquake occurred on a moderately dipping fault, striking either to the southeast or to the northwest. This focal mechanism is purely “eyeball” in appearance. The focus was near, but not directly on, the plate boundary between the Cocos and North America Plates in the region. The Cocos Plate begins its subduction beneath Central America at the Middle America Trench, about 300 km to the southwest of the position of the earthquake. The location, depth and normal-faulting mechanism of this earthquake indicate that it was an intraplate event, within the subducting Cocos Plate, rather than on the shallower megathrust plate boundary. Fig. 2.6 shows rupture areas, slip distributions and focal mechanisms for the Chiapas and Puebla-Morelos events.
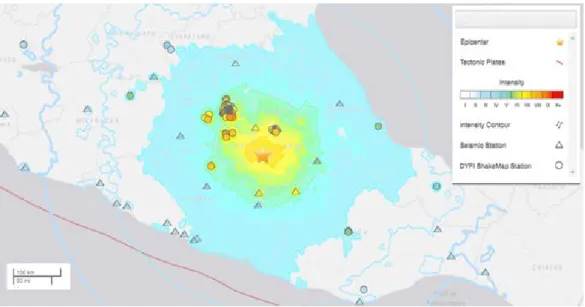
3. Strong Motions 3.1 Intensity map
Fig. 3.1 shows a seismic intensity map for Mexico
during the 2017 Puebla-Morelos earthquake. According to the UNAM (Universidad Nacional Autonoma de Mexico) report6), the amplitude of seismic waves with close periods
of 2 s are up to 50 times greater in the lake zone (soft zone) such as Colonias Roma, Condesa, Centro and Doctores than in firm soil, such as Mexico City. However, the waves are also amplified in the firm ground in the peripheral areas such as Mexico City, and the amplitude in lake areas can be 300–500 times greater. In some lake zone areas the maximum accelerations produced by the Mw 7.1 earthquake in soil were lower than those registered in 1985.
Fig. 2.6 Rupture areas, slip distributions and focal mechanisms
of the (a) Chiapas earthquake and (b) Puebla-Morelos earthquake (after USGS)
3.2 Comparison of the 1985 and 2017 earthquakes Fig. 3.2 shows a comparison of the Fourier spectra
of different heights at sites CU (rocky ground) and SCT (soft ground) for the 1985 earthquake (blue) and the 2017 earthquake (red). According to UNUM report6), peak Ground Acceleration (PGA) in 1985 was 160 Gal, while in 2017 PGA was 91 Gal. Peak Ground Acceleration (PGA) is a measure of the severity of ground shaking. However, accelerations in the soil during the 2017 earthquake were most likely greater than those recorded in 1985 because of the complex movement pattern and high spatial variability.
In 1985, the ground response was amplified up to 7–8 times at building sites located on the lake bed in contrast to those located on hard rock in Mexico City. During the 1985 earthquake, PGA at the soft soil site (SCT) was significantly higher than at the rocky site (CU).
M 8.2 - 101km SSW of Tres Picos, Mexico M 7.1 - 1km E of Ayutla, Mexico
(b) Puebla-Morelos earthquake (a) Chiapas earthquake
Fig. 3.2 Comparison of the Fourier spectra of different heights at sites (a) CU (firm ground) and (b) SCT (soft ground) for the
1985 earthquake (blue) and 2017 earthquake (red)6).
Fig. 3.1 Seismic intensity map of Mexico during the 2017 Puebla-Morelos earthquake (source USGS)5).
CU (firm ground)
SCT(soft ground)
a
b
a
b
3.3 Estimated acceleration
Fig. 3.3 shows acceleration estimated distributions estimated
by the Institute of Engineering of the UNAM2). The estimated
accelerations were calculated in the roof's level of buildings with different numbers of stories in Mexico City. Comparison of the acceleration distributions are: 0.06 s period for one-story buildings, 0.3 s period for 2–3 story buildings, 1 s period for 8–12 story buildings and 2 s period for 16–20 story buildings.
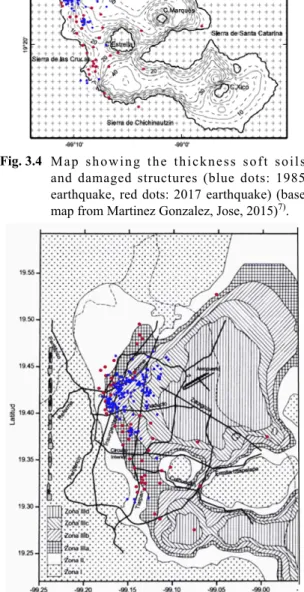
3.4 Comparison of seriously damaged structures from the 1985 and 2017 earthquakes
Fig. 3.4 shows a comparison between seriously damaged
structures from the 2017 earthquake (red) and the 1985 earthquake (blue). The thickness of soft soils is also shown; the base map derived from Martinez Gonzalez, Jose (2015)7).
The seriously damaged structures in 2017 were concentrated
in areas with 10–20 m soil thickness, while seriously damaged structures from 1985 were concentrated in areas with 30–40 m soil thickness.
Fig. 3.5 shows a comparison between seriously damaged
structures from the 2017 earthquake (red) and the 1985 earthquake (blue). Periods were measured using microtremor measurements, with the base map derived from Reinoso, E. and Lermo, J. (1991)8). The seriously damaged structures in
2017 were concentrated 1–2 s areas, while seriously damaged structures in 1985 were concentrated in 3–4 s areas.
Fig. 3.6 shows a comparison between seriously damaged
structures from the 2017 earthquake (red) and 1985 earthquake (blue) with seismic zonation map. The base map was derived from the 1995 version, which contains three zones9) (I, II and III). The structures seriously damaged in
2017 were concentrated in the IIIa zone, while those seriously
a: Acceleration distribution for 0.06 s period (Buildings of 1story) b: Acceleration distribution for 0.3 s period (Buildings of 2-3 story) c: Acceleration distribution for 1 s period (Buildings of 8-12 story) d: Acceleration distribution for 2 s period (Buildings of 16-20 story)
Fig. 3.3 Estimated acceleration distribution2).
T= 0.3 s period (Buildings of 2-3 story)
T= 2 s period (Buildings of 16-20 story) T= 0.06 s period (Buildings of 1 story)
damaged in 1985 were concentrated in zones IIIb and IIIc. In Mexico City, the proposed norm of 2003 has six zones, with Zone III further divided into four subzones (I, II, IIIa, IIIb, IIIc and IIId). The designations are as follows: Zone I: Hard Ground, Zone II: Transition and Zone III: Soft Soil (divided into four subzones).
Fig. 3.7 shows transfer functions obtained from 10
m, 20 m and 40 m within the simplified soil profiles and sedimentary layers from one-dimensional analysis of the dominant frequency. The Vs values of the ground were set from Facciolia and Flores (1975)10) to FAS, which
is normally consolidated clay, and DP, which is a sand layer including gravel.
In the 10 m case, the dominant period of transfer functions is 0.645 s (1.6 Hz) and the amplification of ground motion is 5.3. In the 20 m case, the dominant period of transfer functions is 1.1 s (0.95 Hz) and the amplification is 4.3. In the 40 m case, the dominant period of transfer functions is 2.0 s (0.5 Hz) and the amplification is 3.9. In the 1985 earthquake, which had long-period components of earthquake motion, caused high amplification in soft soils. However, in the 10 m case, which is shallow and segmented, the higher contrast Vs value of segmented layers and the basement contributed to increasing the amplification of ground motion in the 2017 earthquake, which had short-period components of earthquake motion.
Fig. 3.5 Comparison between seriously damaged structures
from the 2017 earthquake (red) and the 1985 earthquake (blue). Periods were measured using microtremor measurements, with the base map derived from Reinoso, E. and Lermo, J. (1991) 8).
Fig. 3.4 Map showing the thickness soft soils
and damaged structures (blue dots: 1985 earthquake, red dots: 2017 earthquake) (base map from Martinez Gonzalez, Jose, 2015)7).
Fig. 3.6 Seismic zonation map showing damaged
structures (blue dots: 1985 earthquake, red dots: 2017 earthquake). Note that the base map is the 1995 version with three zones (I, II and III) 9).
Serious damaged structures
・
in 2017・
in 1985Source from UNAM Zone I : Hard Ground Zone II : Transition
Zone III : Soft Soil (divided into four subzones)
Peak Ground Accelerations (Horizontal and Vertical). Horizontal peak ground accelerations a0 (as related to gravity)
are defined for each zone or subzone:
Zone a0 I 0.04 II 0.08 IIIa 0.10 IIIb 0.11 IIc 0.10 IIId 0.10
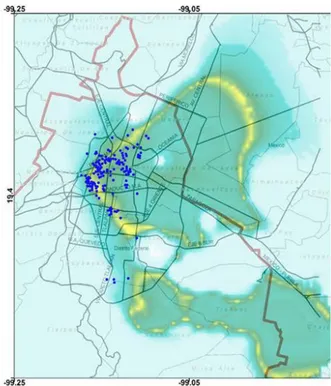
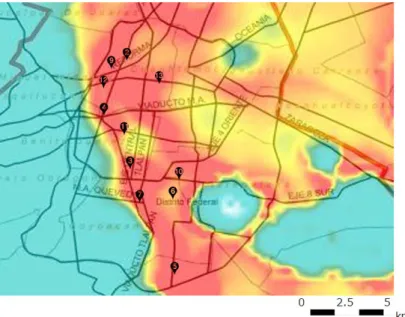
Fig. 3.8 shows seriously damaged structures from the
2017 earthquake with acceleration distribution for the 1.0 s period estimated from the roofs of buildings. Fig. 3.9 shows seriously damaged structures from the 1985 earthquake with acceleration distribution for the 2.0 s period estimated from
Fig. 3.7 Transfer functions were obtained from 10 m, 20 m and 40 m in the simplified soil profiles.
40 m 20 m
10 m
the roofs of buildings. Each damaged structure distribution can be explained as the resonance of a building, which is related to the soil layers and their properties by ground motion characteristics.
Fig. 3.8 Map showing the distribution of seriously damaged
structures from the 2017 earthquake with acceleration distributions for the 1.0 s period estimated from the roofs of buildings 2).
Fig. 3.9 Map showing the distribution of seriously damaged
structures from the 1985 earthquake with acceleration distributions for the 2.0 s period estimated from the roofs of buildings 2).
Amplitude
4. Survey Areas in This Study 4.1 Mexico City (CDMX)
Buildings designated for demolition
In Mexico, seismic diagnosis of buildings is undertaken by government. Based on the judgment following the 2017 earthquake, it was decided that 13 buildings would be demolished.
After obtaining approval from the Emergency Committee, the demolition work started on October 10, 2017 in the
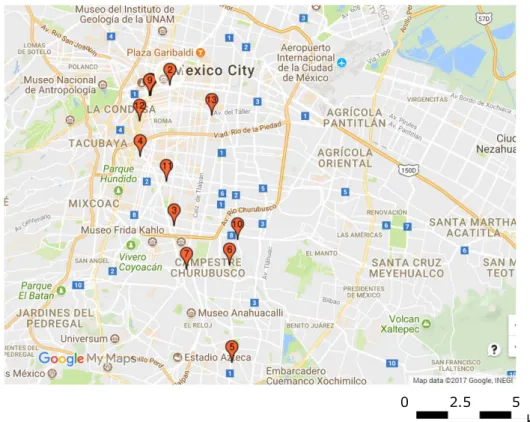
CDMX. There are 13 buildings already confirmed for demolition, since it was specified that in the first three cases, the state will use surveyors and an engineering team to determine the demolition method. These 13 buildings were selected as survey points in this study as shown in Figs. 4.1 and 4.2).
Fig. 4.3 shows the demolition level structures with the
acceleration distribution for the 1.0 s period estimated from the roofs of buildings. All structures are within the 1.0 s acceleration period area.
0 2.5 5 km
Fig. 4.1 Map showing the 13 buildings designated for demolition (Google Maps®).
Génova 33, colonia Juárez, delegación Cuauhtémoc 9 story of building.
Versalles 37, colonia Juárez, delegación Cuauhtémoc 10 story of building.
Tokio 517, colonia Portales norte, delegación Benito Juárez 5 story of building.
Patricio Sanz 37, colonia del Valle, delegación Benito Juárez 7 story of building.
Canal de Miramontes 3010, colonia Girasoles, delegación Coyoacán 6 story of building.
Paseos del río 10, colonia Paseos de Taxqueña, delegación Coyoacán 6 story of building.
Escocia 29, torre 2, colonia Parque San Andrés, delegación Coyoacán 5 story of building.
Escocia 33, colonia Parque San Andrés, delegación Coyoacán 4 story of building.
Hamburgo 112, colonia Juárez, delegación Cuauhtémoc 8 story of building.
Calzada de la Viga 1756, colonia Héroes de Churubusco, sección primera, delegación Iztapalapa 8 story of building.
⓫Concepción Béistegui 1503, colonia Narvarte, delegación Benito Juárez 5 story of building.
⓬Sonora 149, colonia Roma norte, delegación Cuauhtémoc 7 story of building.
Fig. 4.2 (a) Photographs of 8 of the 13 buildings designated for demolition (-)
Fig. 4.2 (b) Photographs of 5 of the 13 buildings designated for demolition (-⓭) (photo taken by T. Ohsumi and Y. Dohi on November 19, 2017).
Fig. 4.3 Map showing the distribution of the 13 structures designated for demolition level
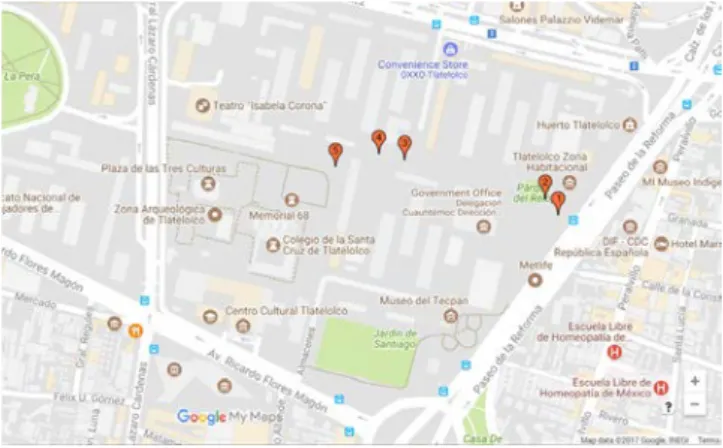
Tlatelolco Complex area
The Tlatelolco Complex area was heavily damaged in the 1985 earthquake (Fig. 4.4). For example, the 14-story RC Nevo Lion building in the Tlatelolco Complex, which included a north side and southern wing connected by an Expansion Joint, suffered a collapse of the two north side buildings that resulted in many casualties. After the 1985 earthquake, the Nevo Lion was renovated with new wings and walls with JICA (Japan International Cooperation Agency) support (Fig. 4.7).
We visited the Tlatelolco Complex area (Fig. 4.5) to verify this renovation. Fig. 4.6 shows photos of the Tlatelolco Complex area, in which it is evident that ground surface deformation appeared after the 2017 earthquake. However, structures designed and built with earthquake-resistance showed no discernible damage after the 2017 earthquake based on external inspection. Fig. 4.8 shows the lack of externally visible damage evident in the renovated Tlatelolco Complex after the 2017 earthquake. Fig. 4.4 is included in
memory of the victims of the 1985 Mexico City earthquake, and to acknowledge the courage and unity of the citizens of Mexico City (courtesy of EL FINANCIERO, 2015) 11).
Fig. 4.6 Photographs of the Tlatelolco Complex area.
(photo taken by T. Ohsumi on November 19, 2017).
Fig. 4.8 Photograph of the undamaged Tlatelolco Complex
from outside inspection, after the 2017 earthquake. (photo taken by T. Ohsumi on November 21, 2017).
Fig 4.5 Map of the Tlatelolco Complex area in Mexico City
(Google Maps®).
Fig. 4.7 Photographs of the renovated Tlatelolco Complex,
after the 1985 earthquake (courtesy of Prof. Nakano with Tokyo Univ.).
Fig. 4.4 In memory of the victims of the earthquakes
of 1985 and the courage and the union of the citizenship (2015) (courtesy of EL FINANCIERO)11).
Damaged RC housings
Two adjacent housing blocks were built in the same period in 1970, as shown in Fig. 4.9, and both buildings will be demolished. However, the building on the right was heavily damaged and the parking lot on the first floor collapsed. The housing block on the left was inspected, and found to have higher quality concrete than the right block. Also, the building column construction used hoops/stirrups at a 45 cm pitch, while the hoops/stirrups were of very poor quality in the housing block on the right.
Fig. 4.10 shows the photograph of complete structural
failure in the Residencial SanJosé, Zapta 56 (EL FINANCIERO)12). Fig. 4.11 shows the photograph of building
damage to the Residencial SanJosé, Zapta from over bridge.
Fig. 4.11 shows the photograph of building damage to the
Residencial San José, Zapta from over bridge. The adjacent right building was no damage from outside inspection.
According to the architect at UNAM, the following issues have been raised concerning damaged RC buildings13):
• The submitted technical drawings and the buildings do not match.
• It is stated in the drawings submitted that the buildings can withstand seismic intensity 6, but the buildings will actually collapse at seismic intensity 5.
• The point of the beam is not fixed and the ceiling and the building are not fixed.
• Electric wiring should be ducted, but in the building it is exposed.
• Documents submitted with the building application were not accompanied by a statement of calculation. It is a description only of the origin of the rebar.
• A structural statement is not shown.
• There is no mention of the name of the person in charge.
Fig. 4.11 Photograph of building damage to the
Residencial SanJosé, Zapta from over bridge (photo taken by T. Ohsumi on November 19, 2017).
Fig. 4.10 Photograph of complete structural failure
in the Residencial SanJosé, Zapta 56 (EL FINANCIERO)12).
Fig. 4.9 Comparison of damage to two housing blocks.
Note the heavily damaged housing on the right with poor quality hoops/stirrups (photo taken by T. Ohsumi on November 19, 2017).
Was the piloty structure damaged?
According to National Population Council, the estimated population for the metropolitan section of Mexico City in 2009 was approximately 8.84 million people. According to the most recent definition agreed upon by the federal and state governments, the Greater Mexico City population is 21.3 million people, making it the largest metropolitan area in the Western Hemisphere, the tenth-largest agglomeration, and the largest Spanish-speaking city in the world. Most housing developments are constructed with a dense overlapping structure (Fig. 4.12), and the first floor has a piloty space. The piloty structure of this space is typically weakly built, and they have collapsed in many housing (Fig. 4.13).
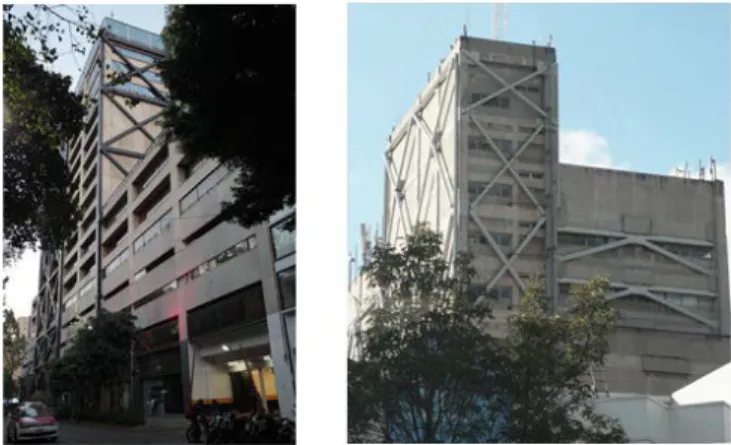
Steel braces and concrete columns
In Mexico City, braces are installed on buildings to decrease the risk of blocks falling off, or bricks in the wall falling out of the plane of the building. Thus, a gable wall between the brace is used to sustain this resilience method (Fig. 4.14). Buildings reinforced with steel braces are shown in Fig. 4.15 and typical diagonal reinforced concrete bracing with masonry infill is shown in Fig. 4.16.
Piloty space and car were crashed.
Fig. 4.13 Photograph showing the collapse of the
basement space in which cars were crushed. (photo taken by T. Ohsumi on November 19, 2017)
Fig. 4.12 Typical housing in Mexico City.
(photo taken by T. Ohsumi on November 21, 2017)
Fig. 4.16 Masonry building which was reinforced
with concrete columns.
Fig. 4.15 Photographs of buildings reinforced with steel braces.
(photo taken by T. Ohsumi on November 18-19, 2017)
Fig. 4.14 Typical diagonal reinforced concrete
bracing with masonry infill used in Mexico City 14).
Latin American Tower
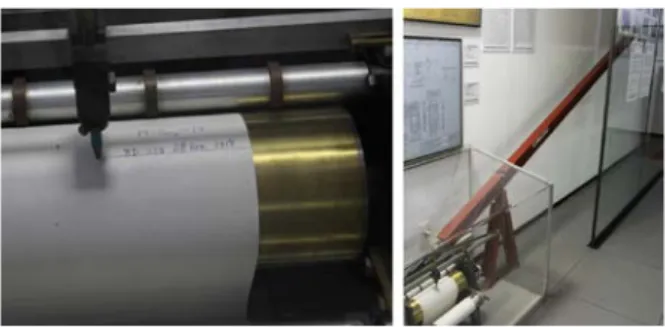
The Latin American tower was inaugurated on April 30, 1956. It was designed by Adolpho Zeevaert, in consultation with N. Newmark and Leonardo Zeevaert. The Latin American Tower is a source of pride for the inhabitants of the Mexico City metropol, as it broke several engineering records during its construction using Mexican technology. The structure survived the 1957, 1978, 1979, 1985 and also the September 2017 earthquakes with only minor nonstructural damage. A memorial plate was installed in the Latin American Tower (Fig. 4.17) and it describes how the Tower has been able to sustain multiple episodes of strong seismic forces. Figs. 4.18 and 4.19 show the seismometer and deformation meter of the tower, respectively. Deformation is registered as the proportion of movement within a range of permissible values in the tower. Fig. 4.20 highlights the primary structural features and advanced technology of the Latin American Tower.
Fig. 4.17 Memorial plate in the Latin American Tower.
(photo taken by T. Ohsumi on November 21, 2017)
Fig. 4.20 Schematic diagram highlighting the structure and
advanced technology of the Latin American Tower. 30 Aniversario Sismo del 85: La Gran Urbe no Deja de Moverse, EL FINANCIERO 15).
Fig. 4.19 Deformation meter in the Latin American Tower.
(photo taken by T. Ohsumi on November 21, 2017)
Fig. 4.18 Seismometer in the Latin
American tower.
(photo taken by T. Ohsumi on November 21, 2017)
Torre Mayor
The Torre Mayor is one of the most modern and seismically safe buildings in the world. The base of the structure extends to a depth of 40 m or more and the first 10 floors of the building are constructed with concrete columns in a steel frame. The diamond-shaped design includes shock absorbers that absorb seismic forces across both sides of the building columns, thus dissipating the energy, as shown in
Fig. 4.21.
How do heatsinks work?
Heatsinks mobilize an element through a viscous fluid, which generates forces that oppose the movement of the element of proportional magnitude to the velocity.
Seismic Energy Heatsink
Concrete piles Shock absorbers Conventional building Building with heatsinks
Energy is absorbed by these devices reducing deformations and structural damage.
Location
Torre-mayor
Fig. 4.21 Schematic diagram illustrating the advanced technology used in the Torre Mayor in Mexico City.
4.2 Puebra Atlixco
Atlixco is a city and municipality in the Mexican state of Puebla, located at 18.900648° N and 98.445572° W about 90 km southeast of Mexico City and 39.3 km north of the 2017
earthquake epicenter (18.550° N, 98.489° W) (Fig. 4.22). The earthquake damaged areas beyond Atlixco, including the five local governments of Huaquechula, Atzitzihuacán, Santa Isabel Cholula, Tepeojuma and Tianguismanalco. Damage was mostly structural, and church buildings were especially affected (Fig. 4.23).
Fig. 4.23 (a) Various damaged buildings in the Atlixco area (-).
(photo taken by Y. Dohi and T. Ohsumi on November 20, 2017)
Fig. 4.22 Locality map of the Atlixco area in Mexico
Fig. 4.23 (b) Various damaged buildings in the Atlixco area (-⓬) (photo taken by Y. Dohi and T. Ohsumi on November 20, 2017)
Puebra City
Puebla City is known as Puebla de los Angeles, and is located within the Puebla Municipality, the capital and largest city in the state of Puebla. Puebla City is famous for the ceramics (Las talaveras) it produces (Fig. 4.24). Fig. 4.25 shows the damaged structures.
Fig. 4.25 Various damaged buildings in the Puebla City area (-).
(photo taken by Y. Dohi and T. Ohsumi on November 20, 2017)
5. Transmission of Horizontal Forces in an Earthquake
The elements within a building that are most affected during an earthquake are the structural elements because of the forces that are transmitted through them (Fig. 5.1).
What is a structural system?
It is important to note whether structures are composed of several elements, and have the function of supporting the loads that act on them seismically, by transmitting them into
Fig. 5.1 Diagram illustrating the transmission of horizontal forces during an earthquake
(courtesy of EL FINANCIERO, September 26, 2017).
the ground, such as is shown in Fig. 5.2.
Type of Cracks
The engineer Yoshio Joel Salinas, general director of T22 Coordination and Architecture, indicated that after the earthquake it is necessary to detect the types of cracks evident in buildings in terms of their relative risk of further failure (Fig. 5.3).
Fig. 5.2 Diagram illustrating the various structural elements in a building (e.g., fissures, fractures, columns) that need to be
considered in terms of identifying, monitoring and repairing (courtesy of EL FINANCIERO, September 26, 2017).
Fig. 5.3 Diagram showing the various type of cracks that can occur and should be monitored in a seismically
6. Rescue Technology
6.1 Anything goes to find life: dogs and scanners
Scanning technology has progressed significantly since 1985, and is used by the Armed Forces (such as SEDENA in Mexico, Secretaría de la Defensa Nacional) to find people trapped under rubble.
SEDENA uses wall-mounted scanners to search for people in collapsed structures and works in the same way as radar. The equipment sends out a signal to a specific point, and returns and informs if there is no vibration. Any movement, even that of a finger, is recognizable by this device. The wall-mounted scanners have a range of up to 40 m, depending on the type of wall. It is able to determine the depth and location of buried individuals. All branches of SEDENA where collapses occurred have a team equipped with these scanners.
In addition, the “canine binomials” are important additions to the rescue efforts, and consist of a trained rescue dog and a handler. The relationship between the two, and with the individual being rescued, is one of trust and empathy. The dogs are able to detect even faint odors of buried individuals and their physical dimensions allow them to travel through smaller spaces than humans would be able to. Navy’s staff is responsible for training the dogs for 12 to 14 months, and they are employed in rescue tasks for six to seven years. Fig. 6.1 shows the scanning technologies, which are described in detail below.
● Uwb Detector
These detectors use radio technology at bandwidths >500 MHz (UWB) to probe beneath the surface of the debris for movement. The device detects even small movements of the chest caused by breathing. It locates victims by
Fig. 6.1 Schematic diagram of the five main types of scanning technology used in post-earthquake rescue
(courtesy of EL FINANCIERO, September 22, 2017).
detecting movements up to 30 m away. The rescuers do require absolute silence during detection to accurately follow meaningful signals beneath debris.
● Canine Binomies
These are the partnered dog and trainer, both prepared to search for people under rubble. A Harness may be used if they require it, and glasses help protect the dog’s eyes in case of smoke, dust or other substances. Boots are also used to help protect their legs.
Frida is a dog that belongs to the canine section of the Mexican Navy Secretariat, and she has managed to rescue 52 persons and has collaborated in rescue work in Honduras, Ecuador and Haiti.
● Thermal Equipment Reading
Thermal equipment is used to locate people beneath the rubble. The rescue of those who are buried in debris without injuries and who can move freely is relatively easy with this method. In the event that an individual is injured or trapped a tourniquet can be used and vital signs are checked, followed by their recovery.
There is no parameter with which to measure the resistance of a building to collapse. Regardless of being a child or an adult, there are cases of victims being without food, buried in rubble for six days before rescue.
● Wall Scanning
The wall scanning equipment allows users to observe an area from behind a wall. The scanner detects micro-shocks caused by breathing, heartbeat or physical gestures of people trapped.
6.2 Japan’s Disaster Relief Team
At the request of the Mexican government, the Japanese government dispatched Japan’s Disaster Relief Team on September 21, 2017. The team consisted of 72 people who conducted disaster relief at the three main areas affected by the earthquake in central Mexico City (Fig. 6.2). The team returned to Japan on September 28 (Figs. 6.3 and 6.4). The activities of Japan’s Disaster Relief Team were featured in local Mexican newspapers (Fig. 6.5).
Fig. 6.5 Introduction of Japan’s Disaster Relief Team to the
area affected by the earthquake (courtesy of EL FINANCIERO, September 26, 2017).
Fig. 6.3 Appreciative words in Mexico Coty Aire port,
September 27, 2017. (photo taken by Y. Ohsumi)
Fig. 6.4 Japan’s Disaster Relief Team returning to Narita Airport with the emergency rescue dogs,
September 28, 2017. (photo taken by T. Ohsumi)
Fig. 6.2 Japan’s Disaster Relief Team Working at Mexico
Coty Aire port, September 21, 2017. (photo taken by Y. Ohsumi)
7. Telephone Questionnaire Survey
The EL FINANCIERO newspaper published the results of a telephonic questionnaire survey conducted six days after the 2017 earthquake. The survey was funded by EL FINANCIERO, and design and directed by Alejandro Moreno.
7.1 Methodology
The survey in Mexico City consisted of 500 interviews with adults (300 in-house and 200 by telephone) on September 22 and 23, 2017. EL FINANCIERO used a probabilistic sampling method based on 30 electoral sections of the housing survey, and a random selection of telephone numbers. In both cases the proportionality of voters was kept the same in each of the delegations. With a confidence level of 95 %, the total error margin of the survey was ± 4.4 %. The rejection rate for interviews was 40% in the housing survey and 52 % in the telephonic survey.
7.2 Solidarity and Voluntary Pride
The questions asked for this portion of the questionnaire are shown below:
1) How many persons felt a sense of human solidarity on September 19? (%)
2) How proud are you of the state of citizens of Mexico City where the emergency occurred? (%)
3) Do you believe that human solidarity lasts after the emergency/Do you think it will disappear? (%)
4) Are you proud to live in Mexico City? (%)
Fig. 7.1 shows the results of survey questions related to
feelings of solidarity and volunteer pride in Mexico City
7.3 Evaluation before the emergency
The question asked for this portion of the questionnaire is shown below:
What do you think about the work of the following individuals/organizations before the emergency of September 19? (%)
Fig. 7.3 shows the results of the evaluation before the
emergency.
7.4 Housing damage
The questions asked for this portion of the questionnaire are shown below:
1) Did you and your family suffer material damage in your home? (%)
2) Is the damage that your house incurred reparable? (%) 3) Do you have home insurance? (%)
4) Did your residence suffer any damage? (%)
Fig. 7.2 shows the survey results related to housing
damage.
7.5 Volunteers
The questions asked for the volunteers of the questionnaire are shown below:
Did you/your family leave as a volunteer to provide help? How did you get the information to help, for ...? (%) ? (%)
Fig. 7.4 shows the survey results related to volunteer work
during the emergency.
Fig. 7.1 Results of survey questions related to feelings of solidarity and volunteer pride
Fig. 7.2 Results of survey questions related to damage caused in housing
(courtesy of EL FINANCIERO, September 25, 2017).
Fig. 7.4 Survey results related to volunteer work during
the emergency.
(courtesy of EL FINANCIERO, September 25, 2017)
Fig. 7.3 Results of survey questions related to evaluation of
emergency services before the emergency.
7.6 Mental Damage
The questions asked for this portion of the questionnaire are shown below:
1) Was anyone in your family affected mentally? (%) 2) Was anyone in your family injured? (%)
Fig. 7.5 shows the survey results related to questions about
mental damage.
7.7 Politics
The question asked for this portion of the questionnaire is shown below:
Are there political parties that had the suggestions for reconstruction after the earthquake? What did you think about the proposals? (%)
Fig. 7.6 shows the results of the survey question related to
the political response to the emergency.
7.8 Insecurity
The question asked for this portion of the questionnaire is shown below:
What do you think about crime that occurred during the emergency of the earthquake? (%)
Fig. 7.7 shows the results of survey question related to
insecurity and crime during the earthquake emergency.
8. Findings
Based on the study presented, and the survey results, the following conclusions can be drawn:
• Heavily damaged structures in the Mexico City area related to the 2017 earthquake are underlain by areas consisting of soft soils 10–20 m in thickness.
• Comparison of the estimated acceleration distribution for the 1 s period corresponds to 8–12 story buildings. These period areas correspond to areas of heavily damaged structures related to the 2017 earthquake.
• In the 10 m case, which is shallow and segmented, the higher contrast Vs value of segmented layers and the basement contributed to increased amplification of ground motion in the 2017 earthquake, which had short-period components of earthquake motion.
• In Mexico City, minor damage was evident in urban buildings with modified improvement of regulatory requirements in terms of construction that were in place after the 1985 earthquake. Conversely, buildings not subject to these regulatory requirements were more heavily damaged.
• In Atlixco (proximal to the earthquake epicenter) , there many 16 century structures, most structural damage was caused to historic churches.
MENTAL DAMAGE
WAS ANYONE IN
YOUR FAMILY
AFFECTED MENTALLY?
WAS ANYONE IN
YOUR FAMILY INJJRED?
MYSELF RELATIVE
MYSELF RELATIVE NO
Fig. 7.7 Survey results related to insecurity and crime during
the emergency (courtesy of EL FINANCIERO, September 25, 2017).
Fig. 7.6 Results of the survey related to the political
response to the earthquake emergency (Courtesy of EL FINANCIERO, September 25, 2017).
Fig. 7.5 Results of survey related to questions of mental
damage caused by the earthquake (courtesy of EL FINANCIERO, September 25, 2017).
Acknowledgments
We thank Ms. Nancy Escobar from EL FINANCIEROS for giving permission to reprint a part of the newspaper report in this manuscript.
References
1) Pérez-Campos X., Kim Y.H., Husker A., Davis P.M., Clayton R.W., Iglesias A., Pacheco J.F., Singh S.K., Manea V.C., Gurnis M., 2008, Horizontal subduction and truncation of the Cocos plate beneath, Mexico, Geophys. Res. Lett. 35, doi 10.1029/2008GL035127. 2) Sismo del día 19 de Septiembre de 2017,
Puebla-Morelos (M 7.1), Sismo del día 19 de Septiembre de 2017, Puebla-Morelos (M 7.1), Reporte Especial, Grupo de trabajo del Servicio Sismológico Nacional, UNAM
http://www.ssn.unam.mx/sismicidad/reportes- especiales/2017/SSNMX_rep_esp_20170919_Puebla-Morelos_M71.pdf
3) Localización de los sismos más importantes en México http://usuarios.geofisica.unam.mx/vladimir/ sismos/100a%F1os.html
4) Ito, Y. (2016), Prepare for a large earthquake in Mexico, DPRI NEWSLETTER, No.79, Disanter Prevention Reserch Institute, Kyoto University, pp.7-8.
5) M 7.1 - 1km E of Ayutla, Mexico, USGS,
https://earthquake.usgs.gov/earthquakes/eventpage/ us2000ar20#region-info
6) Grupos de Sismología e Ingeniería de la UNAM Nota Informativa ¿Qué ocurrió el 19 de septiembre de 2017 en México?, 23 de septiembre de 2017 http:// usuarios.geofisica.unam.mx/cruz/Nota_Divulgacion_ Sismo_19092017.pdf
7) Martinez Gonzalez Jose (2015), Subsidencia regional y
respuesta sismica en ciudad deMexico: el sismo del 19 de Septiembre, 1985 (Ms 8.1)
8) Reinoso, E. y Lermo, J. (1991), “Periodos del suelo del valle de México medidos en sismos y con vibración ambiental”, Proceedings of the IX National Conference on Earthquake Engineering, Manzanillo, Colima, México, pág. 2,149-2,156.
9) Seismic code evaluation, Mexico, Evaluation conducted by Jorge Gutiérrez,
http://webserver2.ineter.gob.ni/sis/vulne/codigo/eng/ MEXICsce.pdf
10) Facciolia and Flores (1975), Respuestas Sismicas Maximas Probables en las Arcillas de la Ciudad de Mexico, Universidad Nacional Autonorna de Mexico. 11) En recuerdo de las víctimas de los sismos de 1985 y el
coraje y la unión de la ciudadanía (2015). Sismos del 85: Una vida después, EL FINANCIERO,
http://graficos.elfinanciero.com.mx/2015/sismo-85/ index.html
12) Edificio de Zapata 56, en riesgo incluso con sismo menor., EL FINANCIERO,
http://www.elfinanciero.com.mx/nacional/edificio-de-zapata-56-en-riesgo-incluso-con-sismo-menor.html 13) Edificio en Zapata 56 podría haberse derrumbado,
incluso sin el sismo, EL FINANCIERO
https://www.youtube.com/watch?v=fA1DPR0wsFQ 14) Frank Mclure (1985), Technical Briefing on the
September 19, Earthquake in Mexico.
15) 30 Aniversario Sismo del 85: La Gran Urbe no Deja de Moverse, EL FINANCIERO,
http://graficos.elfinanciero.com.mx/2015/sismo-85/ index-2.html