Quantitative analysis of lipid composition in
biomedical sample using Raman spectroscopy
著者(英)
Phiranuphon Meksiarun
学位名
博士(理学)
学位授与機関
関西学院大学
学位授与番号
34504甲第566号
Quantitative analysis of lipid composition in
biomedical sample using Raman spectroscopy
A Thesis for the Degree
Of
Doctor of Science
Submitted to
School of Science, Kwansei Gakuin University,
By
Phiranuphon Meksiarun
Introduction
Purpose of study
Non-invasively quantitative analysis of the relation between dietary fat and lipid accumulation/metabolism using Raman spectroscopy.
General outline
Obesity was reported to induce various type of medical complications including insulin resistance, diabetes, gallstone disease, and coronary heart disease. The characteristics of obesity can be observed as significant accumulation of fat in the subcutaneous and visceral adipose tissue. Rather than energy storage, adipose tissues were also reported as the glucose and lipid metabolism and numbers of hormones producer. The visceral fat was reported as the secretor of inflammatory which induced the risk of obesity associated cardiovascular disease.1 The fat tissue in the peripheral region, subcutaneous adipose tissue (SAT), was also reported to be involved in insulin resistance and inflammation in the overfed sample. The visceral fat was reported as the secretor of inflammatory which induced the risk of obesity associated cardiovascular diseases. The increased amount of excessive visceral fat was reported as closely related to obesity and type II diabetes mellitus.
The key player in obesity is dietary fat. There are various kinds of fatty acids in the daily diet either from vegetable or meat. Each fatty acid has its own characteristics and properties and can be classified in various manner depends mainly on the perspective. Two main types of fatty acids classified by the origin; essential and non-essential. Essential fatty acids are the fatty acids which cannot be synthesized, however, they are necessary for keeping the body function, such as; omega-3 and omega-6 fatty acids. The major difference of non-essential fatty acids is that they can be synthesized inside the body. Fatty acids can also be
classified according to the C=C. Fatty acids with no C=C are called saturated fat while fatty acids containing C=C are called unsaturated fat. Unsaturated fatty acids can be further categorized as mono-unsaturated fatty acids (1 C=C), polyunsaturated fatty acids (more than 1 C=C). The C=C of the fatty acids play pivotal role in various biological systems as signal messenger or lipid mediator. Fatty acids, according to the chain-length, can be categorized as short (less than 6 carbons), medium (6-12 carbons) and long chain fatty acid (longer than 12 carbons). The metabolic pathways are different according to the chain-length. Short-chain fatty acids are metabolized in the colonocytes of intestine while medium-chain fatty acids are mainly sent through portal vein and metabolized at liver. Long-chain fatty acids are sent through lymphatic system to peripheral organs and the residuals are metabolized at liver.2-5 Considering the metabolic pathway, lipid with different chain-length can affect the variation of lipid accumulation. To confirm this hypothesis, the lipid variation is required to be measured.
Non-invasive approach for lipid research
Recently, non-invasive technique is attracting more interest in the field of lipid research due to its advantage. One of the strongest advantage of non-invasive technique is that it requires little sample preparation, which not only help the researchers for saving time and sample, but also can ensure the intactness of molecular structure targeted for the assay. Invasive methods require treatment with various kind of solution which could cause data fluctuation and requires technical skill. Numbers of technique have been published as follows; Muik et al. reported the lipid degradation in vegetable oil using Fourier transform (FT-) Raman spectroscopy.6 Their results demonstrated the feasibility of Raman spectroscopy to detect the changes in 6 vegetable oils with varied unsaturated fatty acid heated to 160°C. FT-near infrared spectroscopy (FT-NIRs) was employed to observe the lipid in Brazilian soybeans and construct the PLS calibration model.7 The FT-infrared (FTIR) was used to measure the amount of lipid in the
quantified using PLS regression 8 These techniques are capable of measuring the lipid content in the biological sample.
Raman spectroscopy
Nowadays, the research regarding biomedical spectroscopy is becoming a worldwide topic. The spectroscopic techniques/instruments are developed for many medical application such as; blood glucose monitoring, early stage cancer detection or skin investigation. The application of Raman spectroscopy in the field of biology/biomedical have gained interest from scientist around the world as it is able to provide the molecular information in the non-invasive manner. The non-invasive technique is widely used in various application including industrial online process, food quality control etc. This method has also been used for the real-time monitoring in biomedical application indicative of the potential for the next generation of real-time biomedical monitoring technology.
Raman scattering is the spectroscopic phenomena occurs when the incident light is scattered. The wavenumber of the scattered light is shifted to from that of the light source due to an inelastic scattering. There are two kinds of Raman scattering; Stoke and anti-Stoke scattering. Stoke is the kind of scattering which the scattered photon has lower energy while anti-Stoke has higher energy. Stoke scattering is found to be more prevalence than anti-Stoke due to the general molecules at room temperature are mostly at the ground state. Information obtained from Raman spectroscopy is in complementary with infrared spectroscopy. The preference of Raman spectroscopy over infrared spectroscopy is due to the reduction of water effect from sample. Water reveal broad band over the 1600-1700 cm-1 region in Raman spectra while huge broad peak will be induced using infrared spectroscopy. The low sensitivity to water makes Raman spectroscopy suitable for biological sample, moreover, it can also be applied to in vivo study. One of the biggest disadvantage of Raman spectroscopy is the fluorescence
effect. The origin of fluorescence effect is due to the laser absorption of the sample. Near-infrared (NIR) excitation laser is widely used in biomedical application using Raman spectroscopy. The NIR laser can provide benefit by decreasing the fluorescence effect and increasing the penetration depth. All in all, NIR is the laser of choice for investigating the biological sample.
Lipid study in biomedical research with Raman spectroscopy
The studies of lipid in the skin were published by several research groups. Giarola et al. reported applying Raman spectroscopy to observe the changes in adipose tissue.9 The unsaturation index technique was proposed to observe the change in the unsaturation degree of the adipose tissue. This study show the feasibility of Raman spectroscopy to observe the unsaturation of fatty acid. The quantitative analysis of skin lipid components were reported by Vyumvuhore et al. The amount of lipid components including ceramide, cholesterol and fatty acids were predicted using Raman spectra and HPLC data. The results from PLS calibration show the feasibility to observe the skin lipid component non-invasively. 10 Pudney et al. proposed the Raman system capable of measuring the layer of epidermis. The amount of keratin, natural moisturizing factor (NMF), ceramide, cholesterol, urea, lactic acid and transurocanic acid were quantified using the spectral intensity. The developed Raman system can be used in various location of the body.11 This study is the milestone in the field of skin research as this is for the first time that Raman system is developed solely for skin research. In this study, the study of lipid in the skin and adipose tissue are described in qualitative and quantitative manner in chapter II and III.
Various kind of Raman instrument were developed to cope with different application. In this study, confocal Raman spectroscopy, microscope Raman spectroscopy and ball lens-installed hollow optical fiber Raman probe (BHRP) were used throughout the research.
Confocal and microscope Raman spectroscopy, in principle, are exactly the same. The different is the confocal Raman spectroscopy can provide higher spatial resolution (x,y,z axes) than that of microscope. The confocal Raman spectroscopy is usually used for observing the microorganism or cell (further detail will be discussed in Chapter I and II). The BHRP was developed to cope with biomedical application.12,13 The BHRP overcome the problem found using the fiber-bundle Raman probe as signal/noise ratio is higher. In this study, BHRP was used to investigate the skin and adipose tissues. The size and type of ball lens is an important factor to observe the change in the skin depends on the layer which sample resided. The 0.5mm sapphire ball lens was used to measure dermis layer while the 0.8mm fused silica ball lens was used to observe the subcutaneous layer under the skin(further detail will be discussed in Chapter II and III).
Adipose tissue
The background knowledge of adipose tissue are described here for better understanding for the study in chapter II and III.
The function of the lipid-related organs such as subcutaneous and visceral adipose tissue has been believed to be nothing but the energy depot. However, the other roles of adipose tissue in biological system were found. The adipose tissue was found to be involved in many roles in lipid and glucose metabolism. Various kind of hormones and cytokines was also found to be produced by adipose tissue, such as; tumor necrosis factor-a, interleukin-6, adiponectin, leptin, and plasminogen activator inhibitor-1.Adipose tissue can be categorized by its location into 2 main types; subcutaneous adipose tissue (SAT) and visceral adipose tissue (VAT). SAT can be found under the dermis layer of the skin while VAT can be found inside the body cavity. Both types of adipose tissue comprise mainly of adipocyte. There are 2 kinds of adipocyte; white and brown adipocyte. The adipocytes mostly found in the SAT and VAT are white
adipocyte while brown adipocyte is less prevalence. Brown adipocyte has special function to produce heat. Adipocyte is the cell which stores lipids mostly triglyceride in the form of lipid droplet. Triglyceride is the lipid structure comprises of glycerol head group and 3 molecule of free fatty acids. The difference between SAT and VAT can be observed in various manners. The portal drainage of VAT is connected with liver which make it easier to be used by liver while venous drainage of SAT is connected to the lymphatic system. VAT contains higher amount of large adipocyte while SAT mostly comprises of small adipocyte. The larger size of adipocytes are insulin resistance and have lower free fatty acids uptake comparing to that of small adipocyte.14 The variation in lipid accumulation is described in chapter II and III.
Study Synopsis
This research consists of 3 chapters;
Chapter I: Development of chemometrics method for quantitative determination of
lipid in the biological sample.
The basic data/technique of lipid measurement were collected for quantitative analysis and knowledge of chemometrics was acquired and developed. The biological samples, marine diatoms, were used as test subject for the lipid analytical method using Raman spectroscopy and chemometrics approach. Confocal Raman spectroscopy was used to measure lipid droplet inside diatom. The lipid droplet comprises of triacylglycerol were preprocessed and subjected to the chemometrics method to extract the concentration of fatty acid. Classical least square (CLS) was used to obtain the concentration profile of lipid droplet using the low wavenumber region of 800-1200 cm-1. The result from CLS showed that fatty acids profile of diatom can be classified into 3 groups according to their degree of unsaturated lipid dominance. Gas chromatography was used to validate the CLS result.
Chapter II: Investigation of dietary fat effect upon the lipid interaction and oxidation
damage in the skin and adipose tissue.
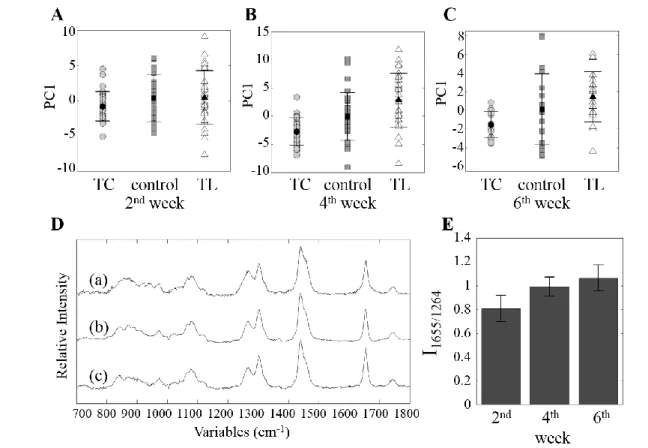
In this second part, hamsters were used to investigate the impact of dietary fat upon body lipid oxidation and the feasibility of using non-invasive approach. The Raman spectroscopy system was developed and improved for obtaining molecular information of the composition of the skin with BHRP. Skin samples consisting of various lipids and some other materials were employed to evaluate the potential of the developed Raman spectroscope. Golden Syrian hamsters were treated with triglyceride with different unsaturation degree. Ball lens installed hollow fiber Raman probe (BHRP) with 500 µm sapphire ball lens is used to measure the lipid variation in the skin and adipose tissue (Figure 1). The relation between lipid oxidation and dietary fat was determined by comparing the oxidation of pure fatty acids and the spectra from hamsters. The lipid oxidation in the adipose tissue cannot be found, however, the oxidation of the skin is increased from 2-6 weeks. The accumulation of lipid in adipose and skin tissue were evaluated using principal component analysis (PCA). The score plots from PCA show the variation in correspondence with the dietary fat treated in both adipose tissue and skin.
Chapter III: Implementation and development of quantitative determination of lipid
metabolism in the skin and adipose tissue.
The combination of developed software and fiber optic Raman probe. The developed Raman system equipped with microscopic probe (chapter II) together with lipid determination technique (chapter I) was employed to quantitatively investigate lipid content in hamster skin. The effect of dietary fat upon the lipid-related organs (skin lipid, subcutaneous adipose tissue, visceral adipose tissue) were further investigated in the quantitative manner. In this study, BHRP with 800 µm fused-silica ball lens is used to observe the change in the subcutaneous
layer of the skin (skin-SAT). Subcutaneous adipose tissue (SAT) and visceral adipose tissue (VAT) were dissected and measured with BHRP. The lipid accumulation in the skin-SAT, SAT and VAT were observed using PLS regression and the modified ALS namely; moving-window ALS (MW-ALS) and increasing window ALS (IW-ALS). The results from PLS calibration yielded higher accuracy than MW/IW-ALS technique. However, MW/IW-ALS confirm the informative region for extracting fatty acids. The accumulation rate of skin-SAT, SAT are lower than VAT due to the location of adipose tissue. Trilinolein was accumulated higher than tricaprin according to the metabolic pathway of long-chain and medium-chain fatty acids. The originalities of this study are described as follows; first, the lipid content investigated specified the detailed properties and characteristic of lipid in biological sample, marine diatom. The confocal Raman spectroscopy was able to gather the spectral information of lipid droplet in a marine diatom. The developed chemometrics, classical least square (CLS), method can be applied to extract the concentration profile of lipid droplet of diatom. The next step is the investigation of the lipid-related organs in the high lipid variation environment. Ball lens-installed hollow optical fiber Raman probe (BHRP) shows the capability to measure the skin and adipose tissues. The lipid oxidation of dermis layer and adipose tissue can be investigated using the I1654/I1264. The third part, BHRP shows the potential for establishing qualitative and
quantitative relation of skin-lipid, subcutaneous adipose tissue (SAT) and visceral adipose tissue (VAT). The ALS method was further modified and developed by applying the idea of moving window as moving window-ALS and increasing window-ALS to specify the informative region for extracting lipid concentration of adipose tissue. It was found that the low wavenumber region is extremely specific for each type of fatty acid. I found that this region yields higher information than others.
References
1. Ibrahim, M. M. Subcutaneous and visceral adipose tissue: structural and functional differences. Obes Rev 2010, 11 (1), 11-18.
2. Gideon, H. R.; Timon, v. H. ; Frank, L. J. Adipose tissue dysfunction in obesity, diabetes, and vascular diseases. European Heart Journal 2008, 29 (24), 2959-2971.
3. Rosqvist, F.; Iggman, D.; Kullberg, J.; Cedernaes, J.; Johansson, H. E.; Larsson, A.; Johansson, L.; Ahlström, H.; Arner, P.; Dahlman , I.; Risérus, U. Overfeeding polyunsaturated and saturated fat causes distinct effects on liver and visceral fat accumulation in humans. Diabetes 2014, 63 (7), 2356-2368.
4. Ross, R.; Leger, L.; Morris, D.; de Guise, J.; Guardo, R. Quantification of adipose tissue by MRI: relationship with anthropometric variables. J Appl Physiol 1992, 72, 787-795. 5. Vatanparast, H.; Chilibeck, P. D.; Cornish, S. M.; Little, J. P.; Paus-Jenssen, L. S.; Case,
A. M.; Biem, H. J. DXA-derived Abdominal Fat Mass, Waist Circumference, and Blood Lipids in Postmenopausal Women. Obesity 2009, 17 (8), 1635-1640.
6. Beattie, J. R.; Bella, S. E. J.; Borgaardb, C.; Fearonc, A.; Moss, B. W. Prediction of Adipose Tissue Composition Using Raman Spectroscopy: Average Properties and Individual Fatty Acids. Lipids 2006, 41 (3), 287-294.
7. Giarola, M.; Masconi, E.; Mosconi, E.; Fontanella, M.; Marzola , P.; Scambi, I. Fast and minimally invasive determination of the unsaturation index of white fat depots by micro-Raman spectroscopy. Lipids 2011, 46 (7), 659-667.
8. Tfayli, A.; Jamal, D.; Vyumvuhore, R.; Manfait, M.; Baillet-Guffroy, A. Hydration effects on the barrier function of stratum corneum lipids: Raman analysis of ceramides 2, III and 5. Analyst 2013, 138 (21), 6582-6588.
9. Vyumvuhore, R.; Tfayli, A.; Piot, O.; Le Guillou, M.; Guichard, N.; Manfait, M.; Baillet-Guffroy , A. Raman spectroscopy: in vivo quick response code of skin physiological status. J Biomed Opt 2014, 19 (11), 111603.
10. Katagiri, ; Yamamoto, Y. S.; Ozaki, ; Matsuura, ; Sato,. High axial resolution Raman probe made of single hollow optical fiber. Applied Spectroscopy 2009, 63, 103-107.
11. Yamamoto, Y.; Oshima, Y.; Shinzawa, H.; Katagiri, T.; Matsura, Y.; Ozaki, Y.; Sato, H. Subsurface sensing of biomedical tissues using a miniaturized Raman probe: study of thin-layered model samples. Anal Chim Acta 2008, 619 (1), 8-13.
12. Taketani , A.; Hariyani, R.; Ishigaki, M.; Andriana, B. B.; Sato, H. Raman endoscopy for the in situ investigation of advancing colorectal tumors in live model mice. Analyst 2013, 138 (14), 4183-4190.
13. Meksiarun, P.; Maeda, Y.; Tatsuya, H.; Andraiana, B. B.; Sato, H. Analysis of the effects of dietary fat on body and skin lipids of hamsters by Raman spectroscopy. Analyst 2015. 14. Bligh, E. G.; Dyer, W. J. rapid method of total lipid extraction and purification. Canadian
Journal of Biochemistry and Physiology 1959, 37, 911-917.
15. Monziols, M.; Bonneau, M.; Davenel, B.; Kouba, M. Comparison of the lipid content and fatty acid composition of intermuscular and subcutaneous adipose tissues in pig carcasses. Meat Science 2007, 54-60, 26.
16. Guillot , E.; Vaugelade , P.; Lemarchal , P.; Rérat, A. Intestinal absorption and liver uptake of medium-chain fatty acids in non-anaesthetized pigs. Br J Nutr. 1993 , 69 (2), 431-442. 17. Meksiarun, P.; Spegazzini, N.; Matsui, H.; Nakajima, K.; Sato, H. In vivo study of lipid accumulation in the microalgae marine diatom Thalassiosira pseudonana using Raman spectroscopy. Applied Spectroscpy 2015, 69 (1), 45-51.
Barzilai , N. Differential responses of visceral and subcutaneous fat depots to nutrients. Diabetes 2005, 54 (3), 672-68.
19. Bergman , R. N.; Kim, S. P.; Catalano, K. J.; Hsu, I. R.; Chiu, J. D.; Kabir , M.; Hucking, K.; Ader , M. Why visceral fat is bad: mechanisms of the metabolic syndrome. Obesity (Silver Spring) 2006, Suppl 1, 16S-19S.
20. Papamandjaris, ; MacDougall, E.; Jones ,. Medium chain fatty acid metabolism and energy expenditure: obesity treatment implications. Life Sciences 1998, 62 (14), 1203-1215. 21. Anders, B. H.; Philipp, S. E. Adipose Tissue, Inflammation, and Cardiovascular Disease.
Circulation Research 2005, 96, 939-949.
22. Marten, B.; Pfeuffer, M.; Schrezenme, J. Medium-chain triglycerides. Int Dairy J. 2006, 16 (11), 1374-1382.
23. Crozier, G. L. Medium-chain triglyceride feeding over the longterm - The metabolic-fate of [C-14] octanoate and [C-14] oleate in isolated rat hepatocytes. Journal of Nutrition
1988, 118, 297-304.
24. Berg, A. H.; Scherer, P. E. Adipose tissue, inflammation, and cardiovascular disease. Circ Res 2005, 96 (9), 939-949.
25. Hajer , G. R.; van Haeften, T. W.; Visseren, F. L. Adipose tissue dysfunction in obesity, diabetes, and vascular diseases. Eur Heart J 2008, 29 (24), 2959-2971.
26. den Besten, G.; van Eunen, K.; Groen, A. K.; Venema, K.; Reijngoud, D. J.; Bakker , B. M. The role of short-chain fatty acids in the interplay between diet, gut microbiota, and host energy metabolism. J Lipid Res 2013, 54 (9), 2325-2340.
27. Ferreira, D. S.; Pallone, J. A. L.; Poppi, R. J. Fourier transform near-infrared spectroscopy (FT-NIRS) application to estimate Brazilian soybean [Glycine max (L.) Merril] composition. Food Research International 2013, 51 (1), 53-58.
28. Vongsvivut , J.; Miller, M. R.; McNaughton, D.; Heraud, P.; Barrow, C. J. Rapid Discrimination and Determination of Polyunsaturated Fatty Acid Composition in Marine Oils by FTIR Spectroscopy and Multivariate Data Analysi. Food and Bioprocess Technology 2014, 7 (8), 2410-2422.
29. Pudney, P. D.; Bonnist, E. Y.; Caspers, P. J.; Gorce, J. P.; Marriot, C.; Puppels, G. J.; Singleton, S.; van der Wolf, M. J. A new in vivo Raman probe for enhanced applicability to the body. Applied Spectroscopy 2012, 66 (8), 882-891.
30. Muik, ; Lendl, ; Molina-D´ıaz, ; Ayora-Ca˜ nada, J. e. Direct monitoring of lipid oxidation in edible oils by Fourier transform Raman spectroscopy. Chemistry and Physics of Lipids
Chapter I: In vivo study of lipid accumulation in the microalgae
marine diatom Thalassiosira pseudonana using Raman spectroscopy
Abstract
An in vivo non-invasive quantitative analysis technique was introduced for evaluating the fat composition of living marine diatoms by using Raman spectroscopy in conjunction with a chemometrics method. This technique enabled the observation of real-time variations in individual lipids in diatom cells without specific treatment or fat extraction. A confocal Raman spectroscope was used to measure the marine centric diatom Thalassiosira pseudonana which was cultured under 6 stress conditions and the spectral data of accumulated fatty acids were obtained. A model-based chemometrics technique, ordinary least square (OLS) was then used to extract specific signals from Raman spectra obtained for a mixture of fatty acids. The levels of four major lipid moieties from diatoms were extracted simultaneously, including myristic acid, palmitic acid, palmitoleic acid, and eicosapentaenoic acid from the Raman spectra. These results indicate that Raman spectroscopy in conjunction with a chemometrics method is reliable for the quantitative determination of the lipid composition accumulated in the cells of marine diatoms.
Introduction
The energy crisis has become a global concern as the demand for crude oil increases while supplies continually decrease. To solve this problem, biofuel production by microalgae has been examined. 1 As an alternative source of energy, microalgae have many advantages over
the use of fossil fuels. Biofuel produced from microalgae has been recognized as a feasible source of energy as the diatom lipid production in the form of triacylglycerol (TAG) can be increased up to 60% of the total dry mass when it is cultured under optimal conditions2. To
achieve an optimal growth rate, diatoms must be cultivated under nutrient-replete conditions. In contrast, nutrient exhaustion leads to a decrease in the cell growth; however, it increases lipid accumulation dramatically. The cellular factors contributing to lipid accumulation, include silica, nitrogen, phosphorus and CO2, which are associated with specific biosynthesis
mechanisms.3, 4
Raman spectroscopy can potentially be used to analyze fat composition in living single cells. This method enables identification of live cells and transfer of single cells for further cloning of the selective phenotype. Selective production of fat (e.g. chain length and number of double bonds) will contribute to the application of algal biofuel production, material, and food industries and medical production. However, typical auxotrophic selection methods cannot be used because the production or the absence of the particular fat should not be fatal to algae.5
Additionally, conventional methods, such as liquid or gas chromatography, require sufficient amounts of sample and lysis of cells, which is not feasible for mass screening of a particular phenotype from enormous number of potential mutants. Another difficulty of chromatographic analyses arises from the large variation in the patterns of 3 acyl chains in the TAG. TAG must be decomposed into fatty acid chains through a methylation process, which requires additional operations to obtain reliable results. This type of conditional setting for the sample preparation is not necessary in Raman analysis.
Raman spectroscopy is based on the light scattering phenomenon. In the biological samples, water is the major component that may disturb the resolution of the spectroscopic methods, and this problem is particularly evident for infrared and near-infrared spectroscopies. Additionally, while information regarding lipid components cannot be obtained using fluorescence-based experiments, Raman spectroscopy can be used to acquire this data.6 Briefly, chemometrics is a
method for interpreting or extracting information from spectra obtained using various spectrometers. Partial least squares regression (PLSR) and principle component analysis (PCA) are quantitative and qualitative analytical methods that have been used for various applications, including the study of nutrient status of microalgae,7 fish-oil quantity,8 and monitoring of
cancer cells.9 Ordinary least square (OLS) analysis was used to determine the composition of
materials in a mixed sample, which is based on the linear combination of pure component spectra.10 OLS was employed for extracting the pure component in skin tissue from
biochemical Raman spectra. 11 Lipid droplets in cell treated with oleic and palmitic acid were
investigated by Raman spectroscopy and OLS to determine the location of cellular peroxisomes. 12 In situ analysis of lipids accumulated in microalgae by Raman spectroscopy
was performed for the lipid globules in green algae Botryococcus sudeticus, Chlamydomonas sp., and the Xanthophyceae, Trachydiscus minutus.13 Laser-trapping Raman spectroscopy was
used to immobilize diatom cells during measurements in the green algae Neochloris oleoabundans.14 Both studies employed the ratio between 1656 cm-1 (C=C) and 1445 cm-1
(C-H deformation) to construct a calibration model in order to determine the composition of fatty acids by constructing calibration models based on C=C and CH2 together with melting point
and differential scanning calorimetry data. The green algae, Chlorella sorokiniana and N. oleoabundans were cultured under nitrogen-starved conditions and then carotenoids and triglycerides were investigated by Stokes Raman spectroscopy.15
In the present study, model-based OLS was employed to determine the relative composition of different types of fatty acid chains in a mixture of TAG in cells. The conventional method based on the ratio between two bands (e.g. I1656/I1445) is not reliable when the diatom had three
or more fatty acid chain types in one sample. The reliability of OLS was validated by gas chromatography. The absolute concentration in the cell was not obtained in the present study.
Materials and methods
Preparation of diatom samples
T .pseudonana was grown in artificial seawater supplemented with half-strength of Gulland’s solution (F/2ASW). Cells were first grown in normal F/2ASW, and then transferred and acclimated to 1 control and 6 different conditions for 3 days at 20°C with PPFD of 60 µEm-2 s -1. Culture conditions were as follows: media with high nutrient content; (1) +Fe (F/2ASW with
0.036 mM FeCl3·6H2O), (2) +N (F/2ASW containing 5.4 mM NaNO3), and (3) +CO2
(F/2ASW under constant aeration with 5% CO2) and media without particular nutrients; (4) –
Fe (iron depleted), (5) –N (nitrogen depleted), and (6) -CO2 cultured under ambient aeration.
Confocal Raman spectroscopy
Raman measurements of T. pseudonana were carried out using a confocal Raman spectroscope, Nanofinder 30 (Tokyo Instruments, Inc., Tokyo, Japan), equipped with CW-electronically tuned Ti: sapphire laser (ETL), Peltier cooled CCD detector (BR-DD410, Andor Technology, Belfast, Ireland) and water-immersed objective lens (×60, 1.10 NA, Olympus, Tokyo, Japan). The cells were placed in a dish with a quartz bottom for Raman measurements. The excitation wavelength was 785 nm with 50 mW at the sampling point. The spectra from 30 cells from each cultured condition were collected over a range of 730–1800 cm-1. The
background (e.g. quartz, cultivation medium, etc.) and were normalized with a band at 1440 cm-1 (C-H deformation mode).
Gas chromatography (GC)
Lipid was extracted from cells according to the Bligh and Dyer protocol16, which is suitable
for a wet algal sample. Each 300-mL of diatom culture was centrifuged at 1500 g for 10 min. The collected diatom pellet (1.2 mL) was mixed with methanol (1.5 mL)/chloroform (1.5 mL)/distilled water (1.5 mL) and sonicated for 1 min. The chloroform layer including the total extracted lipid was collected and the solvent was vaporized using nitrogen stream. The residue was then treated with a fatty acid methylation kit (Nacalai Tesque, Kyoto, Japan). Squalene was added to reach an internal standard concentration of 0.82 nM. Next, 1 µL of sample was injected and analyzed using a gas chromatographic system (GC-2010, Shimadzu Co., Ltd., Kyoto, Japan). The peak area of each lipid species was normalized based on an internal standard. All chemicals were purchased from Sigma-Aldrich (St. Louis, MO, USA).
Selection of major fat species in diatoms using PCA
PCA (Unscrambler 10.1, CAMO Software AS., Oslo, Norway) with full-cross validation was used to interpret the Raman spectra of the major lipids in diatom cells. To construct a prediction model, 8 lipid species (myristic acid (MA), palmitic acid (PA), palmitoleic acid (PoA), oleic acid (OA), linoleic acid (LA), linolenic acid (NA), arachidonic acid (AA), and eicosapentaenoic acid (EPA)) were purchased from Sigma-Aldrich and used without further purification.
Ordinary least square (OLS)
OLS analysis was used to decompose the mixed components into pure components (Figure 1). OLS is a chemometrics technique based on least square analysis (equation (1)). D is data matrix r×c, where r is the spectra obtained from diatoms and c is corresponding wavenumber of each sample. C (r×n) is the concentrations of “n” components, which are major components composing the samples. ST (n×c) is the corresponding spectra of each mixture component. E
(r×c) is an unexplained residual matrix.
Prior to OLS, initial estimation were calculated to be roughly estimated to minimize the lipid library by PCA. In the first step, spectral profile (ST) is the lipid library spectra and then used
to estimate the sample concentration (C) in equation 2.
To validate the OLS results, correlation between lipid libraries and diatom samples concentration were performed by using R (correlation coefficient) as follows;
R = ∑𝑛𝑖=1(𝑥𝑖−𝑥̅)(𝑦𝑖−𝑥̅)
√∑𝑛𝑖=1(𝑥𝑖−𝑥̅)2√∑𝑛𝑖=1(𝑦𝑖−𝑦̅)2
(Eq.3)
where x and y are lipid libraries and calculated sample concentration, respectively. The number of sample is assigned with ith from 1 to n sample. OLS, correlation coefficient and standard deviation were performed by using MATLAB (The Mathworks Inc., MATLAB Version 7.1 R2010a).
Results and Discussion
In the present study, chain lengths and the number of double bonds of fatty acid chains were analyzed. Although various types of fatty acid chains are found in diatoms, exhaustive analysis
D = CST + E (Eq.1)
this study. It was extremely difficult to precisely estimate the spectral features from the raw spectral data since spectral profiles of each fatty acid resembled each other. In order to identify the major types of hydrocarbon chains, a conventional ratiometric method was first applied. Ratiometrics have been used to identify lipid species with respect to the ratio of 2 bands at 1660 and 1440 cm-1.13, 14 Figure 2 shows the ratiometric plot of fatty acids and diatom samples.
Diatom lipids are mostly plotted between palmitic and linoleic acid, suggesting that their fatty acid chains contain more than one double bond. One sample plotted between palmitic and oleic acids had a fatty acid chain with less than one double bond. Because diatoms contain TAGs with varied compositions in their fatty acid chains, ratiometric analysis is not sufficient to reflect their characteristics. Because the band intensity at 1660 cm-1 corresponds to the total
number of C=C bonds in this method, the ratio of 1660/1440 is only valid when the sample contains only 2 fatty acid species. Additionally, the band at 1660 cm-1 was sensitive to lipid
oxidation as the band intensity changed depending on the level of conjugation.17, 18 To
overcome these limitations, multivariate analysis was necessary.
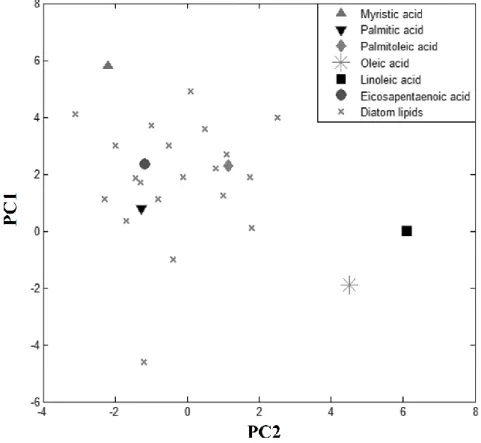
PCA analysis was applied to determine major fatty acid chains in diatoms. When diatoms have particular variations in several major fatty acid chains, they will appear as major PCs in PCA, if the concentration of these fatty acid chains changes independently. The data from several pure fatty acids were added into the data set of diatoms for PCA. These data for pure fatty acids were used as indices to assign the origin of each PC. Figure 3 depicts a score plot of PC 1 and 2 of the PCA analysis, which was carried out for the data set of diatoms and 6 fatty acids. The plot shows that the data for myristic acid (MA: 14-carbon, 0-double bond), palmitic acid (PA: 16-carbon, 0-double bond), palmitoleic acid (PoA: 16-carbon, 1-double bond), and eicosapentaenoic acid (EPA: 20-carbon, 5-double bond) were close to the data of diatoms, with data for 2 other fatty acids plotted relatively far from these diatoms. According to analysis of the score plots constructed for PC 15, these 4 fatty acids were always observed close to the
diatom data set. This result is consistent with the results of GC Figure 7, suggesting that the diatoms examined in this study have these 4 major fatty acid chains in their TAGs.
Raman spectra for the 4 major fatty acids and an averaged spectrum of normal diatoms are shown in Figure 4. The diatom cell includes protein and carotenoid in addition to TAG but the contribution of these components is relatively small according to the spectral features of diatoms. Major bands at 1660 1440, 1304, and 1265 cm-1 were assigned to C=C stretching,
C-H deformation, CC-H2 bending and =C-H bending vibrational modes of the fat species. Band
assignments in the 8001200 cm-1 region are listed in Table 1. A band at 1735 cm-1, which was
observed only in the diatom spectrum, was assigned to the C=O stretching mode of ester bonding in TAG, as the fat in the diatom was in the form of TAG. Bands at 1660 and 1265 cm -1 were particularly strong and sharp in the spectra of unsaturated fatty acids PoA and EPA,
which are good markers for these fatty acid chains. The spectral region from 8001200 cm-1
(Figure. 4) was useful for decomposing the spectra because it represented the characteristic pattern of each lipid species. This region contains the C-C backbone structure of each fatty acid which is contributed to the chain length and conformation from rotation of C-C bonds. The band at 1068 cm-1 was assigned to trans-C-C rotamers and those at 1080 and 1120 cm-1 were
due to gauche-C-C rotamers. The alkyl chains in solid fatty acid are typically arranged in the trans form, while the gauche rotamers are typically observed in the liquid phase fatty acid.19
Significant bands at 865, 931, and 974 cm-1 assigned to δ C-C, ν C-C, and δ =C-H vibrational
modes were observed on the spectra of polyunsaturated fatty acids, EPA and NA, but they were not observed on the spectrum of PoA with a single double-bond. These bands were observed also in the spectra of the diatoms, suggesting the existence of polyunsaturated fatty acid chains. Diatoms showed distinct types of Raman spectra compared to the pure fatty acid sample, with spectral features that were totally different when an excitation wavelength of 633 nm was used. Figure 5 shows the Raman spectra of the diatom measured at a 633 nm-excitation (a) and
785 nm -excitation (b) wavelength. Broad bands near 1200 and 1650 cm-1 appeared on the
spectrum (a), which were attributed to the fluorescence of chlorophyll-a and b. The 633-nm light appeared to excite absorption bands due to Qx and Qy electronic modes, with corresponding fluorescent bands observed. In contrast, the spectrum measured at an excitation wavelength of 785 nm showed several strong bands due to the presence of carotenoids. Because the molecular concentration of carotenoids was much lower than that of lipid or protein, the spectrum was attributed to pre-resonance enhanced by the excitation at 785 nm. Because the absorption bands of carotenoid appear near 450 and 490 nm, the excitation light was resonant with the bands, although they were about 300 nm apart from the excitation wavelength. The bands at 1170, 1525, and 1630 cm-1 were only minimally observed in the 633 nm-excited
spectrum over the strong fluorescent background, suggesting that the carotenoids are also pre-resonant enhanced at this excitation wavelength. In contrast, there were no bands due to carotenoids in the fat-rich Raman spectrum of diatom (Figure 4 (e)). Carotenoid species show high affinity to fat and have suppressive effects for singlet oxygen and lipid oxidation.20
However, the present result indicates that no carotenoid exists near the fat drop in the diatom. Thus, the fat drop is not a long-term energy storage form, but is included in a dynamic physiological regulation under changing environment. The diatom appears to actively synthesize, modify, and consume fat. The recent studies have also stated the role of lipid droplets rather than energy depots, lipid droplets play many active roles in the cell regulation.21,22
Diatoms cultured under control and 6 different conditions were analyzed by Raman-OLS analysis and GC (Figure. 6 and 7). For OLS analysis, the spectral region from 800-1200 cm-1
was used because the intensity of the band of the C=C stretching mode near 1660 cm-1 was too
sensitive to the conjugation of double-bonding. Raman analysis of each diatom cell showed 3 patterns of variations. These 3 groups were defined according to the composition of saturation
of the fatty acid chains. Classifications were made based on the ratio between the total amounts of saturated fatty acid chains (SFA; myristic and palmitic acids) and unsaturated fatty acid chains (UFA; palmitoleic and eicosapentaenoic acids). The first group was for the saturated-fat dominated (SFD) group, in which the SFA/UFA ratio was higher than 1.5. The other refers to the unsaturated-fat dominated (UFD) group in which the SFA/UFA ratio was lower than 0.67. Another group included similar amounts of saturated and unsaturated fat chains, with an SFA/UFA ratio between 0.67 and 1.5. This group was referred to as the saturated-unsaturated fat transformation (SUFT) group. Guschina et al., 23 suggested that the unsaturated fatty chain
is derived from the saturated fatty chain by desaturase during its biosynthesis. The results suggested that the SUFT diatom underwent transformation from SFD to UFD, and vice versa. The GC result showed a high PA chain content, but the 3 different types (SFD, UFD and SUFT) in diatoms were unable to be identified in the GC results. The correlation coefficient of OLS analysis was typically more than 0.9, and the averaged Raman data agreed with that of GC, strongly suggesting that Raman spectroscopy with OLS analysis is reliable for total fat analysis in diatoms. Notably, diatoms show large varieties in the particular components of fat chains, even under the same culture conditions which were not differentiated by the GC analysis.
According to the GC analysis, the contents of total fatty acids increased in diatoms cultured under -Fe, +CO2, and -N conditions (Figure 7). PoA content was relatively high under control,
-Fe and -CO2 conditions, and that of EPA was high under control, -Fe and -CO2 conditions. In
contrast, Raman analysis suggested slightly different results. The relative populations of SFD, SUFT, and UFD groups are shown in Table 2. UFD-rich diatoms were the primary components in diatoms cultured under control and -Fe conditions. The population of the SUFT group was remarkably reduced under the -Fe condition. This indicates that the iron starvation simultaneously stimulates fat production together with the activities of desaturase and elongase. Lipid accumulation response to iron deficiency in Thalassiosira oceanica was found
to be used as supplementary energy sources when the photosynthetic system is ruined by iron starvation.24 In addition, 3741 polyunsaturated fatty acid elongase was up-regulated in T.
pseudonana grown in iron depleted condition. This protein family is involved in the elongation of long-chain fatty acids.25,26 The accumulation of fatty acids in green algae Pavlova lutheri,
Chlorella vulgaris, Chlorella kessleri, and Dunaliella tertiolectra diatoms supplied with high CO2 levels were found to contain more SFA and MUFA.27,28 Sato et al. found that a reduction
in UFA could result from the balance mechanism of CO2 concentration and fatty acid
desaturation.29 The effects of lipid accumulation in nitrogen limitation from S. minutulus
showed that total TAGs were increased.30 Fatty acid compositions in the diatoms cultured
under -N found to cause high accumulation of SFA in the present study. As previously reported by Liang et al., saturated fatty acids in P. tricornutum and C. muelleri were increased by nitrogen deprivation.31
The diatoms cultured under +Fe and +CO2 conditions showed a high population in the SUFT
group. This cannot be determined using GC analysis, which suggests a decrease in unsaturated fats. It is unlikely that the fat storage ability is a housekeeping function for the UFD diatom because the SUFT diatom also contains some unsaturated fat. The diatom initially showed a UFD-rich pattern that was similar to the control condition, but then the UFD population reduced with the addition of Fe or CO2 to the mediums. OLS results also indicated that, for
UFD of +Fe and +CO2, the relative concentration of PoA was high while EPA remained low.
This result indicates that the activity of Δ9 desaturase contributes to form C=C to PoA; however, another mechanism involved in the production of poly-unsaturated fat was non-functional. Fatty acid elongase adds hydrocarbons to the fatty acid chains to synthesize EPA from shorter fatty acids.23 Fatty acid elongase appeared to be suppressed under +Fe and +CO
2
conditions, resulting in a reduced concentration of unsaturated fat and classification of these diatoms into the UFD group.
The pattern of fat composition in the SFD group remained similar, with PA always high and MA, PoA, and PA always low. These components remain steady in T. pseudonana. In contrast, the diatoms cultured under –CO2, -N, and +N showed remarkable property in the fat
composition of UFD group. Because the concentration of EPA was relatively high, the concentration of PoA was similar or less than that of PA. Despite this relative amount of EPA, these conditions showed the same population pattern in which only approximately 6% belonged to UFD group, while more than 60% were categorized as SFD. It is assumed that the present simple classification was not sufficient to elucidate the dynamics of the fat production and degradations in the diatom, although obtained data were much more detailed information for each diatom cell by comparing the results with those of conventional GC analysis.
Conclusion
In this study, Raman spectroscopy combined with OLS was demonstrated to analyze the detailed composition of fatty acid chains in live diatoms. The consistency between GC and Raman results confirmed the feasibility of this method as a non-invasive/non-preprocessing tool that can be used to decompose fat composition and quantify the concentration from a mixed sample used for biological applications. These results provide insight into the dynamics of variations in fat synthesis that could not be observed using any other methods. High-quality Raman spectra of fat content was obtained by focusing on a single live diatom. Some spectra revealed strong pre-resonant Raman bands of carotenoids, which are components of photosynthetic systems. This suggests that localization of the fat storage (fat drop) is isolated from photosynthetic systems. Despite the complicated bands in the 8001200 cm-1 region, OLS
can provide reliable quantitative information with a correlation coefficient of more than 0.9. The spectra for each condition were classified into 3 groups: SFD, SUFT, and UFD. Sufficient pretreatment is required to improve the spectrum and prediction quality.
References
1. D. R. Georgianna, S. P. Mayfield. “Exploiting diversity and synthetic biology for the production of algal biofuels”. Nature. 2012. 488(7411): 329-335.
2. E. T. Yu, F. J. Zendejas, P. D. Lane, S. Gaucher, B. A. Simmons, T. W. Lane. “Triacylglycerol accumulation and profiling in the model diatoms Thalassiosira pseudonana and Phaeodactylum tricornutum (Baccilariophyceae) during starvation”. J. Appl. Phycol. 2009. 21(6): 669-681.
3. M. Hildebrand, A. K. Davis, S. R. Smith, J. C. Traller, R. Abbriano. “The place of diatoms in the biofuels industry”. Biofuels. 2012. 3(2): 221-240.
4. K. K. Sharma, H. Schuhmann, P. M. Schenk. “High Lipid Induction in Microalgae for Biodiesel Production”. Energies. 2012. 5(5): 1532-1553.
5. D. Özçimen, M. Ö. Gülyurt, B. İnan, “Algal Biorefinery for Biodiesel Production”. In: Z. Fang, editors. Biodiesel - Feedstocks, Production and Applications: InTech, 2012. 6. E. Smith, G. Dent. “The Raman Experiment – Raman Instrumentation, Sample
Presentation, Data Handling and Practical Aspects of Interpretation”. Modern Raman Spectroscopy: A Practical Approach 1st; Wileys, 2005. Chap. 3.
7. P. Heraud, J. Beardall, D. McNaughton, B. R.Wood.” In vivo prediction of the nutrient status of individual microalgal cells using Raman microspectroscopy”. FEMS. 2007. 275(1): 24-30.
8. J. Vongsvivut, P. Heraud, W. Zhang, J.A. Kralovec, D. McNaughton, C.J. Barrow.” Rapid determination of protein contents in microencapsulated fish oil supplements by ATR-FTIR spectroscopy and partial least square regression (PLSR) analysis”. Food Chemistry. 2014. 7(1): 265-277.
9. S. Duraipandian, W. Zheng, J. Ng, J.J.H. Low, A. Ilancheran, Z. Huang, “Simultaneous fingerprint and high-wavenumber confocal Raman spectroscopy enhances early detection of cervical precancer in vivo.” Anal. Chem. 2012. 84: 5913-5919.
10. M. J. Pelletier. “Quantitative Analysis Using Raman Spectrometry”. Journal of Applied Spectroscopy. 2003. 57(1): 20A-42A.
11. Jr. L. Silveira, F. L. Silveira, B. Bodanese, R. A. Zângaro, M. T. Pacheco. “Discriminating model for diagnosis of basal cell carcinoma and melanoma in vitro based on the Raman spectra of selected biochemicals”. Journal of Biomedical Optics. 2012. 17(7): 077003. 12. I. W. Schie, L. Nolete, T. L. Pedersen, Z. Smith, J. Wu, I. Yahiatene, J. W. Newman, T.
Huser. “Direct comparison of fatty acid ratios in single cellular lipid droplets as determined by comparative Raman spectroscopy and gas chromatography”. Analyst 2013. 138(21): 6662-70.
13. O. Samek, A. Jonáš, Z. Pilát, P. Zemánek, L. Nedbal, J. Tříska, P. Kotas, M. Trtílek. “Raman microspectroscopy of individual algal cells: sensing unsaturation of storage lipids in vivo”. Sensors. 2010. 10(9): 8635-8651.
14. H. Wu, J. V. Volponi, A. E. Oliver, A. N. Parikh, B. A. Simmons, S. Singh.” In vivo lipidomics using single-cell Raman spectroscopy”. PNAS. 2011. 108(9): 3809-3814. 15. Y. Y. Huang, C. M. Beal, W. W. Cai, R. S. Ruoff, E. M. Terentjev. “Micro‐Raman
spectroscopy of algae: Composition analysis and fluorescence background behavior”. Biotechnol Bioeng. 2009. 105(5): 889-898.
16. E. G. Bligh, W. J. Dyer. “A rapid method of total lipid extraction and purification”. Canadian Journal of Biochemistry and Physiology. Can J Biochem Physiol. 1959. 37(8): 911-917.
17. B. Muik, B. Lendl, A. Molina-D´ıaz, M. J. Ayora-Cañada. “Direct reagent-free determination of free fatty acid content in olive oil and olives by Fourier transform Raman spectrometry”. Anal. Chim. Acta. 2003. 487(2): 211-220.
18. B. Muik, B. Lendl, A. Molina-D´ıaz, M. J. Ayora-Cañada. “Direct monitoring of lipid oxidation in edible oils by Fourier transform Raman Spectroscopy”. Chem Phys Lipids. 2005. 134: 173-182.
19. U. I. Rehman, Z. Movasaghi, S. Rehman. “Vibrational Spectroscopy for Tissue Analysis”. Boca Raton: CRC Press. 2012.
20. C. S. Foote, R. W. Denny. “Chemistry of Singlet Oxygen. VII. Quenching by b-Carotene”. JACS. 1968. 90: 6233-6235.
21. T. T. Le, S. Yue, J. X. Cheng. “Shedding new light on lipid biology with coherent anti-Stokes Raman scattering microscopy”. J Lipid Res. 2010. 51(11):3091-102.
22. R. V. Jr. Farese, T. C. Walther. “Lipid Droplets Finally Get a Little R-E-S-P-E-C-T”. Cell. 2009. 139(5):855-60.
23. I. A. Guschina. J. L. Harwood. “Lipids and lipid metabolism in eukaryotic algae”. Prog Lipid Res. 2006. 45(2): 160-186.
24. M. Lommer, M. Specht, A. -S. Roy, L. Kraemer, R. Andreson, M. A. Gutowska, J. Wolf, S. V. Bergner, M. B. Schilhabel, U. C. Klostermeier, R. G. Beiko, P. Rosenstiel, M. Hippler, J. LaRoche. “Genome and low-iron response of an oceanic diatom adapted to chronic iron limitation”. Genome Biology. 2012. 13(7): R66.
25. K. Thamatrakoln, O. Korenovska, A. K. Niheu, K. D. Bidle. “Whole-genome expression analysis reveals a role for death-related genes in stress acclimation of the diatom Thalassiosira pseudonana”. Environ Microbiol. 2012, 14(1): 67-81.
26. L. M. Obeid, C. M. Linardic, L. A. Karolak, Y. A. Hannun. “Programmed cell death induced by ceramide”. Science. 1993. 259(5102): 1769-1771.
27. A. P. Carvalho, F. X. Malcata. “Optimization of x-3 Fatty Acid Production by Microalgae: Crossover Effects of CO2 and Light Intensity Under Batch and Continuous Cultivation Modes”. Mar Biotechnol. 2004. 71: 381-388.
28. M. Tsuzuki, E. Ohnuma, N. Sato, T. Takaku, A. Kawaguchi. “Effects of CO2 Concentration during Growth on Fatty Acid Composition in Microalgae”. Plant Physiol. 1990. 93(3): 851-856.
29. N. Sato, M. Tsuzuki, A. Kawaguchi.” Glycerolipid synthesis in Chlorella kessleri 11 h. II. Effect of the CO2 concentration during growth”. Biochim Biophys Acta. 2003. 1633(1): 35-42.
30. S. G. Lynn, S. S. Kilham, D. A. Kreeger. “Effect of nutrient availability on the biochemical and elemental stoichiometry in freshwater diatom Stephanodiscus minutulus (Bacillariophyceae)”. Interlandi. J. Phycol. 2000. 36(3): 510-522.
31. Y. Liang, J. Beardall, P. Heraud. “Effects of nitrogen source and UV radiation on the growth, chlorophyll fluorescence and fatty acid composition of Phaeodactylum tricornutum and Chaetoceros muelleri(Bacillariophyceae)”. J. Photochem. Photobiol. B. 2006. 82(3): 161-172.
Figure legends
Fig. 1 Scheme of mathematical expression of OLS.
Fig. 2 Ratiometric curve calculated for diatom lipids and pure fatty acids; palmitic acid (PA), oleic acid (OA), glycerol trioleate (GTO), palmitoleic acid (PoA), linoleic acid (LA), linolenic acid (LnA), and arachidonic acid (AA).
Fig. 3 Score plot of PCA for diatom lipids and pure fatty acids.
Fig. 4 Raman spectra of EPA (a), PoA (b), PA (c), MA (d), and the fat rich region of the diatom (e).
Fig. 5 Raman spectra of diatom measured at an excitation wavelength of 633 (a) and 785 (b) nm.
Fig. 6 Composition of MA, PA, PoA, and EPA analyzed using the Raman-MCR-ALS method for 3 groups of diatoms; SFD (――), UFD (‑‑‑‑) and SUFT (‧‒‧‒) cultured under the absence (-) and excess (+) of Fe, CO2, and N, as well as control conditions. The error
bars shows standard deviation.
Fig. 7 Composition of MA, PA, PoA, and EPA analyzed with Raman (――) and GC (‑‑‑‑) analyses cultured under poverty (-) and excess (+) of Fe, CO2, and N, as well as control
conditions. The Raman data shows averaged values including SFD, UFD and SUFT types. The error bar shows the standard deviation.
Table 1 Assignment of major Raman bands. *Abbreviations: ν, Stretching; δ, bending; ρ, rocking. (Wu et al., Samek et al., Rehman et al.)
Table 2 Populations of diatom cells in the SFD, SFA, and UFA groups cultured under control, poverty (-), and excess (+) of Fe, CO2, and N conditions.
Figure 4. Raman spectra of EPA (a), PoA (b), PA (c), MA (d), and the fat rich region of the diatom (e).
Figure 5. Raman spectra of diatom measured at an excitation wavelength of 633 (a) and 785 (b) nm.
Figure. 6: Composition of MA, PA, PoA, and EPA analyzed using the Raman-MCR-ALS method for 3 groups of diatoms; SFD (――), UFD (‑‑‑‑) and SUFT (‧‒‧‒) cultured under the absence (-) and excess (+) of Fe, CO2, and N, as well as control conditions. The error
Fig. 7: Composition of MA, PA, PoA, and EPA analyzed with Raman (――) and GC (‑‑‑‑) analyses cultured under poverty (-) and excess (+) of Fe, CO2, and N, as well as control
conditions. The Raman data shows averaged values including SFD, UFD and SUFT types. The error bar shows the standard deviation.
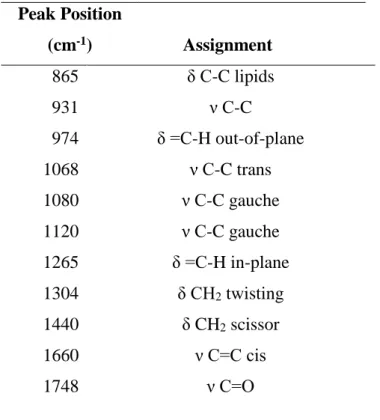
Peak Position (cm-1) Assignment 865 δ C-C lipids 931 ν C-C 974 δ =C-H out-of-plane 1068 ν C-C trans 1080 ν C-C gauche 1120 ν C-C gauche 1265 δ =C-H in-plane 1304 δ CH2 twisting 1440 δ CH2 scissor 1660 ν C=C cis 1748 ν C=O Table 1 Assignment of major bands.
*Abbreviations: ν, Stretching; δ, bending; ρ, rocking (Wu et al., Samek et al., Rehman et al.)
Condition Diatom population (%) SFD SUFT UFD control 23 15 61 Fe - 33 9 52 Fe + 55 33 5 CO2 - 68 22 4 CO2 + 39 56 4 N - 72 22 5 N + 68 15 10
Table 2 Populations of diatom cells in the SFD, SFA, and UFA groups cultured under control, poverty (-), and excess (+) of Fe, CO2, and N conditions.
Chapter II: Analysis of the effects of dietary fat on body and skin lipids of
hamsters by Raman spectroscopy
Abstract
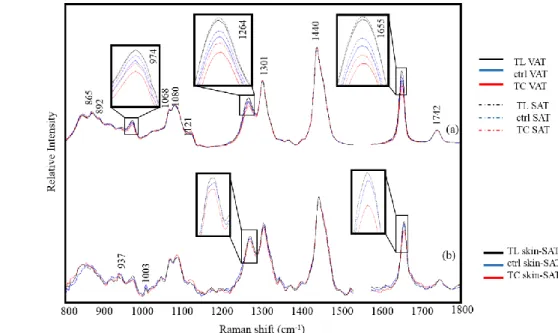
Raman spectroscopy has previously been applied for studying lipid metabolism. In this study, a ball lens-installed hollow optical fiber Raman probe (BHRP) was used for the noninvasive measurement of skin lipids in hamsters. Our analysis suggested that multi-unsaturated lipids, once converted into a structure containing conjugated double bonds, were oxidized into the form of peroxides. These results were applied for analyzing lipid metabolism in adipose and skin tissues in hamsters fed tricaprin, saturated medium-chain triglycerides and trilinolein, unsaturated long-chain triglycerides fat diets. Unsaturated lipids formed conjugated structures in skin tissue but not in adipose tissue. Principal component analysis (PCA) revealed that the dietary fat intake correlated strongly with lipid composition in body and skin tissues. Hence, the present results successfully demonstrate that Raman spectroscopy with a BHRP can be a powerful tool for analyzing lipid metabolism.
Introduction
FAO recently addressed the challenge of preventing and controlling non-communicable diseases (NCDs) in its 2014 global forum. NCDs including diabetes, heart disease, and cancer, are among the leading causes of death globally. One of the leading factors accounting for NCDs is obesity. The major cause of obesity is an unbalanced or high-fat diet. A study conducted from 1990 to 2010 revealed that the global body-mass index increased continuously over this period.1 Several studies have suggested that a reduction in saturated fat (e.g. butter or
margarine) intake, with a concomitant shift to unsaturated fat consumption (e.g. olive oil and fish oil) reduced LDL cholesterol and postprandial blood glucose levels, consequently lowering the risk of heart disease. 2,3 However, not all trans-fat is culpable for obesity-linked diseases. For example, tricaprin (TC), having trans-medium chain fatty acids (MCFA) found abundantly in milk fat and coconut oil, is beneficial in increasing high-density lipoprotein levels.4 Dietary
fats are generally long-chain triglycerides (TGs) with long chain fatty acid (LCFA) which has 14 or more carbon atoms. In contrast, medium-chain TGs are composed of MCFAs with 8 or 10 carbons. They are metabolized differently.5 MCFAs are highly susceptible to breakdown as a “ready-to-use” fat. These facilitate oxidation reactions in the liver and release energy more readily.5-7 Trilinolein (TL), having unsaturated LCFAs, has also been reported for maintaining
healthy skin conditions.8 Thus, the metabolism of fats with different chain length and saturation attracts keen attentions of researchers.9
In the present study, we applied Raman spectroscopy for the study on the fat metabolism. Raman spectroscopy had been successfully applied for studies of the skin of which ranging from thickness of the stratum corneum to the effects of skin lipid content on aging. 10-12 Subcutaneous adipose tissue isolated from different species (pigs, chickens, sheep, and cows)
have been used to classify the fat-type and predict the amount of fatty acid with 99.6% and 80%–97% accuracy respectively.13,14 Muik et al. reported the lipid degradation in vegetable oil
using Fourier transform (FT-) Raman spectroscopy.15 Their results demonstrated the feasibility of Raman spectroscopy to detect the changes in 6 vegetable oils with varied unsaturated fatty acid heated to 160°C. The conjugated diene moiety was reported as a marker for early stage of lipid oxidation.A ball lens-installed hollow optical fiber Raman probe (BHRP) would be a powerful tool for analysis of fat content in the skin.16,17 In the previous report, BHRP successfully detected colorectal tumor advancement in live animals.18
Here, we aimed to evaluate the relationship between dietary fat and skin lipids at the molecular level using the Raman analysis. The metabolic and digestive reactions for LCFA and MCFA function through different pathways and have different endpoints. For example, TL which possesses three LCFAs, passes through the lymphatic system and is stored mainly in adipose tissue.5,6 Most part of the MCFA are transported via the portal vein to be oxidized in the liver while small portions are packed together with LCFA in chylomicrons which is a lipoprotein transporting lipids in lymphatic vessels.19
In the present study, we demonstrate the potential of Raman spectroscopy in a real time, in situ analysis of fat accumulation in the body and skin, especially with a BHRP. The BHRP allowed us to obtain high quality Raman spectra of the live animal skin in the totally nondestructive manner. The knowledge on the fat metabolism for body and skin fats and the feasible measuring technique can be used as an alternative intervention for lipid control.
Materials and methods
Animals
Six-week-old Golden Syrian hamsters were obtained (SLC, Shizuoka, Japan). The weight of the hamsters at the beginning of experiment was ranged from 70 to 110 g. All animals (n = 18) were randomly assigned to control or TL- or TC- (TCI, Tokyo, Japan) treated groups. Distilled water for drinking, and TL and TC supplements were newly prepared every day to
avoid any kinds of degradation and contamination. The amount of TL and TC supplements were recalculated daily to be approximately 0.5% of each hamster’s body weight. Supplements were orally administered between 13:00 and 15:00 hours daily. Picolab Rodent Diet 5053 (LabDiet®, St. Louis, MO, USA) was fed to all treatment groups also. Food and water were available ad libitum, except during oral fat administration. Hamster weight and food intake levels were measured daily to observe abnormalities from oral fat administration. This study was approved by the ethics committee of Kwansei Gakuin University.
Raman measurements
A 785-nm diode laser (Toptica Photonics, Munich, Germany) coupled with a single polychromatic Raman spectrometer (F4.2, focal length 320 mm, 750-nm blazed 600 lines·mm
-1 grating; Photon Design Co. Ltd., Tokyo, Japan) and a charge coupled device detector
(DU420-BRDD; Andor Technology Co. Ltd., Northern Ireland) were used for the Raman measurements (Figure. 1A). For measuring hamster abdominal skin and visceral adipose tissue, the laboratory-made BHRP was used. The probe consisted of a sapphire ball lens 500 µm in diameter (Edmund Optics, USA) and a hollow optical fiber with a 340 µm inner diameter (Doko Engineering LLC, Miyagi, Japan), with a maximum thickness of 640 µm. The BHRP was coupled to the spectrometer through a long-pass filter (LF; Semrock, USA), a notch filter (NF; Kaiser Optical System, USA), and a coupling lens (CL) to focus the laser into the hollow optical fiber. The spectral resolution was approximately 10 cm-1 with a slit-width of 100 µm.
An inhalation anesthesia apparatus (SurgiVet, USA) was used to anesthetize hamsters with 2.0%–2.5% isoflurane (Mylan, Japan). A heating bed (37°C) was used to prevent hypothermia and maintain physiological skin condition. The abdominal region of the hamsters was shaved and cleaned with ethanol (70%). The skin spectra were acquired by two 30-second measurements using a 50-mW excitation light. After skin spectra measurement, hamsters were
euthanized using excess isoflurane. The abdominal adipose tissue was then dissected and analyzed. The dissected tissues were stored in -80°C to prevent lipid oxidation.
Lipid oxidation in fatty acids was observed using the same spectrometer described above and the microscope was coupled with an objective lens (×20, N.A. 0.4, Mitutoyo, Japan) in place of the Raman probe. To observe the auto-oxidation of lipids, cis-9, cis-12-18:2 linoleic acid (LA) and cis-9-18:1 oleic acid (OA) were spotted on an open-air dish and kept in a CO2
incubator (37°C, 100% humidity) for up to 7days. The Raman spectra of these lipids were recorded at 0, 1, 2 and 7th day. The spectrum of trans-10, cis-12-18:2 conjugated LA was also measured with this setup. The structures of LA (a) and conjugated-LA (b) are shown in Figure. 1B. All fatty acid samples were purchased from Sigma-Aldrich (St. Louis, MO, USA).
Data analysis
Raman spectra were corrected for background due to the materials of the sample container; quartz or aluminum, and BHRP. Spectra were then baseline-corrected with a 5th polynomial line fit. The spectra of in vivo skin measurements were then normalized to the phenylalanine band near 1003 cm-1 to correct the spectral intensity. The spectra of adipose tissue and lipid oxidation were normalized using 1440 cm-1 of CH
2 band. The areas under the
spectra were deconvoluted by Lorentzian curve fitting to estimate the band area. Further spectral processing was carried out using MATLAB (The Mathworks Inc., MA, USA) and Unscrambler (CAMO Software AS., Oslo, Norway).
Results and Discussion
Lipid peroxidation
During the oxidation process, a fatty acid chain is often break down into a peroxide. Lipid peroxidation is involved in many biological processes including lipid degradation, lipid
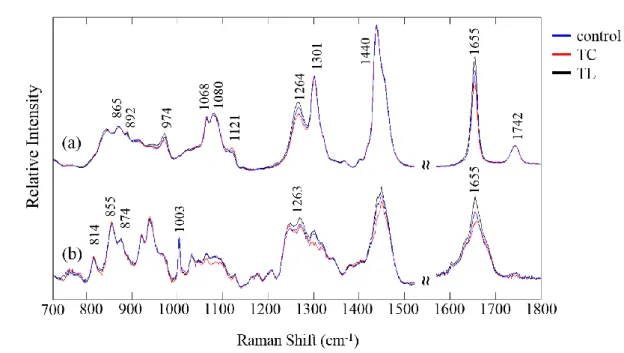
and metabolization.20 Figure 2 shows the Raman spectra of LA (a) and OA (b) kept in a dark incubator. The spectra were measured at 0, 1, 2, and 7 days and their intensities were corrected with a standard band at 1440 cm-1. Bands at 1655 and 1440 cm-1 are assigned to a vinyl C=C stretching mode and C-H deformation modes of the CH2 and CH3 groups. The intensity ratio
of these bands is often used to evaluate unsaturation in oil products.15,21 Bands at 1300 and 1264 cm-1 are assigned to =C-H and C-H deformation modes of the fatty acid chain. The overlapping spectra of LA show large alterations in its features during the auto-oxidation. A broad band at 865 cm-1 was due to the O-OH stretching mode of peroxide. Remarkably, the intensity of the band at 1655 cm-1 increased over time. This result strongly suggests that the structure of unsaturated LA was transferred from cis-9, cis-12 form to the conjugated form during the initial auto-oxidation process. A Raman spectrum of conjugated-LA is depicted in Figure. 2 (c). It shows a remarkably strong band at 1655 cm-1 that is due to a similar C=C
stretching mode but indicates conjugated double bonds. These results reveal that the oxidation process was initiated by the dislocation of the double bond in the fatty acid chain. In the LA spectrum at day 7, a band due to peroxide appeared at 865 cm-1 and the band at 1264 cm-1 showed reduced intensity, indicating that the double bond was cleaved.22 Hence, the second oxidation stage occurred following the conjugation process. Furthermore, the band at 1264 cm -1 did not increase with the conjugation process and did not resemble the band at 1655 cm-1.
This occurs because the hydrogen atom bound to the carbon atom is isolated from the conjugation system. The band intensity did not increase regardless of the structural changes. Hence, the band resulting from the =C-H bending mode is a better marker to evaluate the unsaturation of the lipids than that at 1655 cm-1. The Raman spectra of OA in Figure. 2 (b)
shows small changes in contrast to those of LA. Because OA possesses one double bond, trace changes were observed in band intensities at 1655 and 1264 cm-1 during the 7 days of auto-oxidation. Besides, the band due to the peroxide group at 865 cm-1 did not appear in the