Article
Vol. 58 (2013) No. 1, pp. 77-90An Interpretation on Secular Changes in Deformation Caused by
the 1914 Eruption of Sakurajima Volcano
Izumi YOKOYAMA
*(Received January 4, 2011; Accepted April 16, 2012)
The 1914 eruption of Sakurajima volcano was one of the largest ones in its history and first observed with scientific methods of those days. The eruption flowed out a large volume of lavas, and was accompanied with remarkable deformations on and around Aira caldera. The deformations consist of three stages: pre-eruptive, co-eruptive and post-co-eruptive ones: The first one is determined by temporal tide-gauge observations at Kagoshima Port but, its origin is still unsettled. The second one is a quasi instant and elastic deformation, and therefore interpretable by a simple model. However, the location of center of depression is ambiguous due to the insufficient number of observations. Prior to the interpretation, it is re-examined considering the results of triangulations in the wider area, and the location changed about 5 km S, on Sakurajima Island. The revised location of depression center can well interpret the observed depression and compromises with seismological and petrological knowledge. The last one is a secular recovery stage, and it has remained highly problematic whether its origin is endogenous or exogenous. The present author interprets that the recovery changes are composed of two factors: In the period before around 1940, viscoelasticity of the crust acted predominantly (endogenous) and later magma pressure accumulated in the reservoir gradually joined to act (exogenous) and its contribution had become noticeable after 1955. The recovery of the depression is interpreted as viscoelastic with retardation time of 16.6 years. Hence, viscosity of the earth crust around Aira caldera is determined at about 3×10¹⁹Pa·s on the assumption that the crust is Kelvin-type. The value is comparable to those obtained with Miyake volcano and by laboratory measurement of a granite piece.
The other cases of viscoelastic deformations accompanied with volcanic eruptions are searched: the 1779 eruption of Sakurajima volcano and the 1983 eruption of Miyake volcano are exemplified.
Key words: Sakurajima volcano, volcanogenetic deformation, recovery of deformation, viscoelasticity of the crust
1.Introduction
Sakurajima volcano stands on the S rim of Aira caldera measuring about 20 km in diameter. The historical records of eruptions on Sakurajima date back to 708 A.D. In its eruption history, the 1471〜76, the 1779〜80 and the 1914 eruptions are the largest threes, all discharging consider-able amounts of lavas from parasitic craters. At present, the volcano is one of the most active volcanoes in the world.
The 1914 eruption was fully described and studied geophysically by Omori (1914-1922) and geologically by Kotô (1916). The present discussion owes very much to their works though it is limited to a study on deformations caused by the eruption. The significant subsidence around Aira caldera caused by the 1914 eruption were confirmed by repeated precise levelings and triangulations by the Military Survey as shown in Figs. 1 and 4 where the loca-tion of center of the subsidence is inevitably ambiguous because the observations were limited on land and their number was not enough. The secular recovery of the 1914
subsidence has been pursued for about one century after the eruption. During the period, the 1946 eruption issued lava flows and the recovery was partly reversed. After that, the recovery has proceeded further and attained the original level around 1970.
Such remarkable crustal deformations and their secular changes have held the earth-scientistʼs interest and roused many arguments. Firstly Sassa (1956) mentioned possible relationship between the secular recovery of the 1914 subsidence and the activities of Sakurajima volcano. And Mogi (1958) discussed the deformation and achieved to interpret it by a source of dilatational type. Later Yokoyama (1986) studied the secular changes on the data of those days, and further, extended his idea to a discussion of caldera structure in general (Yokoyama, 2005).
2.Deformation Related to the 1914 Eruption of Sakura-jima Volcano
Networks of precise levels along the route circulating Aira caldera were first established in 1892 by the Military
Corresponding author: Izumi Yokoyama e-mail: yokoizu@aol.jp
Higashi 1-17-7-1304, Kunitachi, Tokyo 186-0002, Japan. *
Survey, referred to the tide-gauge station of Hosojima at about 140 km distant NE. After the 1914 eruption of Sakurajima volcano, the leveling routes were extended toward the south and around Sakurajima Island. Since then, however, several benchmarks in the networks have suffered from re-settings due to changes of circumstances during roughly one century. It is a perplexing problem to keep the reasonable reference point for deformation studies. Six months after the 1914 eruption, a precise leveling was repeated around Aira caldera: It was the second survey after 1892. This survey could reveal a subsidence of wide area: The subsidence-contour of 5 cm encircled an area of roughly 60 km in diameter, centering at Aira caldera (Fig. 1). Such deformation area is comparable to that of a seismic deformation caused by a large earthquake. Dambara (1966) obtained an empirical formula relating mean diameter L (km) of the deformed area to magnitude
Ms of the earthquake as:
log L=0.51 Ms−1.96, (1) where L corresponds to earthquake volume. For L =60 km, Ms is estimated at 7.3. The 1914 eruption of Sakura-jima volcano caused crustal deformation of the same order
as an earthquake of magnitude 7.3. This suggests that the eruption of Sakurajima volcano was a large catastrophe in the crust. Matuzawa (1976) compared the Sakurajima eruption to a great earthquake and suggested his hypo-thesis that if a large tectonic earthquake is compared to a subterranean volcanism, a fault should correspond to an eruption.
It is necessary to study the pre-eruptive and co-eruptive deformations to bring the whole aspect of the eruption to light.
2-1 Pre-eruptive deformation of the 1914 eruption
As shown in Fig. 1, B.M. 2474 may be supposed to be the nearest to the center of the subsidence. Hereafter we will treat with B.M. 2474 as the main object. It subsided 75 cm referred to B.M. 2469 located in Kagoshima City, about 10 km SW of B.M. 2474 and to the year of 1892. We had no surveys between 1892 and the eruption in 1914. The pre-eruptive deformation was not observed intention-ally. Hence, we canʼt know the exact height of B.M. 2474 just before the eruption and even tendency of its changes, and also its behaviors just after the eruption.
In the present paper, B.M. 2469 (a double circle in Fig. 1) is adopted as the reference point to examine the secular
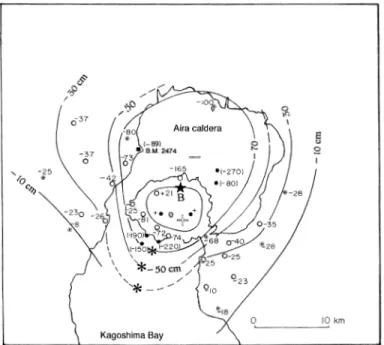
Fig. 1. Vertical deformations around Aira caldera caused by the 1914 eruption of Sakurajima volcano obtained by the precise leveling (after the Military Survey). Hatched areas are the 1914 lavas. “Ai” indicates the islets produced by the 1799 eruptions. Encircled “E” is the epicenter of the earthquake M 7.1 (after Abe, 1981). B.M. 2469 (double circle) is the reference point in the discussion of the secular changes. Star-mark “A”: The center of the subsidence determined in this figure, and “B”: Ditto determined by the results of the triangulations in Fig. 4.
changes uniformly for long periods as far as possible, and the reference time is assigned at the year of 1892 when the bench marks for precise leveling were first established. The problem is the difference of the height of B.M. 2469 between 1892 and early 1914. Fortunately temporary tide observations at Kagoshima Harbor were repeated for 1903〜1905 and 1909. In the following, we refer to the report of Omori (1916, No. 2). B.M. 2469 is located at a distance of about 0.6 km from the harbor, and we assume that both the points deformed equally. Kagoshima Harbor uplifted 6 cm for 5 years (1904〜1909), or 1.2 cm/yr in annual rate according to the results of the above tide observations. Then, we may assume the uplift of B.M. 2469 during the period 1892 to early 1914 to be 1.2 cm/yr ×22 yr=26.4 cm, as shown in the left part of Fig. 2 where the reference point is marked by a double circle aside the ordinate. The value may have some errors, probably±10 cm because it is obtained by an extrapolation of the 6 yearsʼ observation to 22 yearsʼ one. Here, we take an assumed premise that this reference point was free from strain in the year of 1892. The true “no-strain level” cannot be defined exactly at present, and should be definitely determined in future after repetitions of the similar observation. Now “reference level” is adopted for
“no-strain level”, as an auxiliary.
Furthermore, we cannot determine the origin of the uplift observed between 1892 and 1914, magmatic or tectonic forces: We suspect Sakurajima volcano may have been activated without noticeable surface manifestations. During the period, a smoking at the summit was solely recorded in 1899. Seismic activities were not detected: It was the early stage of seismic observations in Japan. A seismic observation using a Grey-Milne seismograph was temporarily made in Kagoshima City on Jan. 11 and 12, 1914 (top of Fig. 3).
2-2 Co-eruptive deformation of the 1914 eruption
Strictly speaking, co-eruptive deformation canʼ t be defined clearly: The 1914 eruption was so violent that no exact reports on the sequence of the deformation were available. After the large eruption in January 1914, height changes of B.M.s 2469 and 2474 were determined as −40.7 cm and −89.4 cm, respectively, referred to the Hosojima tide-gauge station, by the second survey in July 1914. Hence, B.M. 2474 subsided 48.7 cm referred to B.M. 2469 and the year of 1892. As mentioned above, B.M. 2469 uplifted 26.4 cm, and hence we may conclude that B.M. 2474 subsided 48.7+26.4=75.1 cm referred to B.M. 2469 and the year of 1892. Its error may be probably±10 cm as
Fig. 2. Secular changes in vertical deformation at B.M. 2474 referred to B.M. 2469 and the year of 1892 (double circle): The base line is “Reference level”. Volcanic activities are indicated by arrows in arbitrary scale. The deformation of B. M. 2474 after 1960 has been observed by the Sakurajima Volcanological Observatory, Kyoto University. The right top shows annual numbers of summit explosions since 1967 after Iguchi et al. (2008). Striped parts are probable contributions of magmatic pressure and broken curves are viscoelastic recoveries. Hollow circles denote assumed values. A question mark means doubt on the origin of the uplift between 1892 and 1914, volcanic or tectonic origin.
mentioned above. Thereafter the survey was repeated in February 1915 and December 1918 as shown in the lower part of Fig. 3.
How and when the subsidence of 75 cm did proceed?
To discuss this problem, we can refer to only the results of the precise leveling in July 1914 and February 1915 (Q and R in Fig. 3). It is still not clear whether the subsidence was elastic or viscoelastic or combined together. Linking of the three points is not unique. Yokoyama (1997) dis-cussed some possible patterns of the subsidence: partly elastic and partly viscoelastic. In the present paper, we treat with the simplest pattern, totally viscoelastic, for the sake of convenience. In Fig. 3, the curve between P, Q and R can be fitted approximately by an exponential curve. Motive forces of the subsidence are important and shall be discussed in the next section.
The upper part of Fig. 3 shows the seismic and volcanic activities related to the 1914 eruption. The first explosion issued white smoke at the crater of South-Peak at 8 a.m., Jan. 12. The violent explosions began at the vents on the E
and W flanks at 10 a.m. and continued for Jan. 12 and 13. The explosion cloud reached at a height of 8 km at the highest. The lavas began to flow out from both the crater-lines at 20 h, Jan. 13 and continued for about 20 days. This is the 1ststage of the lava flows, and the 2ndstage
continued for about one year at the E vents (Yamaguchi, 1975). The majority of the 1914 lava flows issued in the 1st stage: According to Kotô (1916) and Omori
(1914-1922), volume of the lava flows from the W vents amounted to 0.35 km3and that from the E vents to 1.2 km3,
and that of the 2nd stage was not estimative. It is
noticeable that depression process was not parallel to lava-effusing activity in Fig. 3.
A large earthquake with a small tsunami took place on Jan. 12. It is exceptionally large as of volcanic origin. Abe (1981) studied this earthquake examining the Japanese and world seismograms and determined its magnitude as 7.1 and its epicenter as indicated in Fig. 1. At that time, the nearest seismic station was in Nagasaki, about 150 km distant. Seismogenetic deformation of this
Fig. 3. The 1914 eruption activities of Sakurajima volcano.
Top: Volcanic and seismic activities during the period Jan. 09 to 14, 1914.
Bottom: Vertical deformation of B.M. 2474 referred to B.M. 2469 and the year of 1892 from Jan. 1914 to Dec. 1918. Lava-flow activity is shown in an arbitrary scale.
earthquake, if any, could not be distinguished because the geodetic and seismometric networks were not sufficient in this area at that time.
B.M. 2474 may have been triggered to subside 75 cm (Q in Fig. 3) by this earthquake, totally or partly. The present author suspects that some parts of the subsidence were completed while the lavas were still issuing.
2-3 A model of the co-eruptive subsidence
The Aira deformation occurred in the upper crust, and the maximum subsidence may be about 1 m (Fig. 1), and the depth of source 10 km. Then, its strain is estimated at an order of 10−4. Because elastic limits of the crust is
reported as (5 ± 4) × 10−5 from the data of tectonic
earthquakes (Rikitake, 1975), one may barely treat with the 1914 deformation around Aira caldera as an elastic deformation.
The subsidence around Aira caldera was caused by implosive source related to strong explosions and extru-sion of a large amount of magmas. Deformations of the ground surface caused by volcanic eruptions were first analyzed by Sezawa (1931) who applied simple source models such as expressed in spherical harmonics P0
0(cos
θ) in semi-infinite elastic medium. For instance, vertical displacements Δ h at the surface are given against radial distance r from the source as follows:
Δh=−3a4μ3P D
(D2+r2)32, (2)
where P denotes the pressure amplitude, μ rigidity of the crust, D depth of the pressure source, and a radius of the sphere. Actually a is assumed to be small compared with depth D.
Mogi (1958) first applied this model to the deformation of the 1914 Sakurajima eruption, and succeeded to obtain the source depth D at 10 km on the assumption that the center of subsidence is located around “A” in Fig. 1. Later Yokoyama (1986) applied the model of P0
1(cos θ) type to
express upward magmatic pressure at the source, and obtained D as 8 km.
An alternative configuration of the depression
As shown in Fig. 1, as of 1914, benchmarks for precise levels were not sufficient in number, especially on the island and the S part of this area. The contours of Fig. 1 were drawn by the Military Survey and rather ambiguous: It is true that B.M. 2474 sank the most among the bench-marks surrounding the caldera, but we cannot determine exactly the location of the center of the subsidence because of insufficient number of benchmarks. Provisionally it was assumed to be at “A” in consideration of the results of the precise levels only, mainly at the N of the volcano (Fig. 1). A supplementary method is height determinations by triangulations though the accuracy is a little lower than precise levels. The results are shown in Fig. 4 that was originally prepared by the Military Survey and was once discussed preliminarily by Yokoyama (1986). In the
figure, double circles denote triangulation points of 2nd
order, open circles those of 3rd order, and solid circles
optical observations. There are several triangulation points on the S part of the island and the S off the island while no leveling points were on the island. On the island, the central part of the volcano locally uplifted probably due to parasitic effusions of lavas at the flanks. Comparing the two distributions of subsidence obtained by leveling and triangulation, and neglecting the very local uplifts on the island and the optical observations, we may assume the center of depression of Aira caldera at “B” on the island, toward the S of “A”. Assuming the center of depression at “B” in Fig. 4, we obtain the relation between Δ h versus r
(radial distance from the center of subsidence) is obtained
as shown by dots in Fig. 5 where similar relation obtained by the precise levels (the subsidence center “A”) is repro-duced by a broken line (Mogi, 1958, Fig. 5). B-center-distribution has nearly the same tendency as that of A-center-distribution, and satisfies Eq. (2) as well. And therefore, we obtain the same results on the depths of pressure source by the two distributions. In fact, the A-center-distribution covers only Aira caldera while the B-center-distribution does wider area including the island.
Here, it deserves our attention that these subsidence centers are possibly different from the center of the activities in formation of Aira caldera.
If the “B” location holds good, we may figure a simple model of magma reservoirs, and interpret both the de-formation of Aira caldera and the activities of Sakurajima volcano: The source of the latter model (“B”) located at a depth of 8〜10 km, approximately coincides with the main magma reservoir of Sakurajima volcano suggested by Iguchi (2007) using seismological data. On the other hand, from viewpoint of magmatology, Tsukui and Aramaki (1990) concluded that the andesite magma of Sakurajima volcano should be basically independent of rhyolite magma of Aira caldera. Thus we may assume that the Sakurajima activity is independent of the past Aira activity. Such relationship between a caldera and its post-caldera volcano poses an interesting problem common to all calderas.
In the following discussion, we assume the center of the Aira depression is located at “B” if we deal with the large subsidence, independently of the local uplift on Sakura-jima Island. The location of the center of subsidence does not effect the discussion of the secular changes in the Aira deformation because we are concerned with solely the secular movements of B.M. 2474.
3.Secular Changes in the Deformation after the 1914 Eruption
3-1 A typical pattern of secular changes in the deformation
B.M. 2474 along the W rim of Aira caldera subsided about 90 cm by the 1914 eruption, the largest on land (Figs. 1 and 4). The secular changes in deformation of B.
M. 2474 referred to B.M. 2469 and the year of 1892, as a typical pattern, is shown in Fig. 2. The data before 1970 were obtained by the Military Survey and the Geographical Survey Institute, and later by the Sakurajima Volcanological Observatory, Kyoto University. After the 1946 eruption, a precise leveling was repeated in the area, but both the benchmarks had been lost before 1946. A probable value in 1946 (a hollow circle) is determined by interpolation among the subsidence contours obtained by the surrounding benchmarks.
B.M. 2474 subsided about 90 cm quasi simultaneously
with the explosions in 1914, and began to recover after a year. Miyabe (1934) already doubted what did the gradual counter deformation mean admitting that the remarkable and rapid subsidence was caused by the volcanic eruptions. If the 90 cm subsidence was crustal strain caused by the explosions, the following reverse movements were a recovery towards equilibrium. However, if the subsidence was the result of releases of stresses accumulated pre-ceding the eruption, the recovery means accumulation of stresses deviating from equilibrium. Miyabe (1934) cor-rectly concluded that he had no observational data at that time to solve the problem whether the recovery is endogenous or exogenous.
Later, Sassa (1956) took notice of that Sakurajima volcano issued a large amount of energy such as 1018J in
the 1914 eruption and caused subsidence of the ground, and hence there was a deficit of 1.6 km3at the magma
reservoir after the 1914 eruption. He interpreted that the caldera began to uplift next year (Fig. 3) according as the activity regained, and suspected that a small eruption would occur when the activity power reached an ultimate value. In short, Sassa (1956) assumed that the ground uplift was caused totally exogenously.
It is high time that the problem should be answered one step more. The present author suspects the upward recovery should be composed of two factors: One is viscoelastic recovery movement of the crust, and the other is upheaval of the ground due to injection of magmas into the
Fig. 5. Relation between subsidence (∆ h) and distance (r) from the subsidence center. Hollow circles: triangula-tion results on Sakurajima Island; asterisks: the values in the southern area in Fig. 4. A broken line is reproduced from the same relation of “A” distribution in Fig. 1 (after Mogi, 1958, Fig. 5).
Fig. 4. Vertical deformations around Aira caldera obtained by the triangulations (after the Military Survey). In the northern part, the contours are drawn with the help of the leveling results. Star-mark “B” indicates an assumed center of subsidence. The three asterisks correspond to the same in Fig. 5.
reservoir. The former would begin to appear immediately after the eruption while the latter would join with the former after some periods because a speedy reactivation in a few years is not always probable. Another evidences shall be discussed in 3-2.
The volcano manifested small activities several times after the 1914 eruption, in 1935, 1939 (1938〜42), 1946, 1948, 1950, and 1955 as shown at the top of Fig. 3 where volcanic activities are expressed in an arbitrary scale mainly depending on volume of the ejecta. It is suggestive that we had no surface activities for about 20 years until 1935: The present author assumes that, during that period, magma gradually had been accumulated to contribute the upward deformation of B.M. 2474.
In September 1935, the crater of South-Peak erupted ejecting ashes after a small group of volcanic earthquakes, and the activity continued for a month. In October 1939, an eruption took place at the E flank of South-Peak, around 750 m a.s.l. forming a small crater that is called “Showa Crater”.
The 1946 eruption burst at Showa Crater issuing lavas of 0.15 km3(DRE) that is about one tenth of the 1914 lava.
Such activities mean that Sakurajima volcano was gradually activated since 1935. After 1955, the volcano has been continuously active at the summit crater of South-Peak, usually in Vulcanian type. On June 4, 2006, Showa Crater was reactivated and thereafter solely it has been active as of 2011.
An accidental observation: In December 1958 (Fig. 2), a
lava pool was formed in the summit crater of South-Peak after tremors continued for about 21 hours, and a cooled lava field was accidentally photographed from the air: Its diameter was about 100 m, its depth about 30 m, the radius of its vent about 9 m, and the total volume of the lava 7.9× 10⁴m3. Within the following week, all lava blocks were
exploded off. Yokoyama (1961) estimated a probable depth of the vent at about 3 km by applying the Hagen-Poiseuileʼ s law to the ascent of magmas. Yoshikawa (1961) also assumed a magma pocket at a depth of about 5 km right below Sakurajima volcano from analyses of the deformation of Sakurajima Island.
This phenomenon means that magmas had ascended to a shallow depth beneath Sakurajima volcano at that period. Since 1955, some magma may have appeared at the crater, and some may have exploded before they reached the crater. Such magma movements at the depths probably contributed to the uplift of the caldera area as shown in Fig. 2 where the solid lines indicate the observed de-formation connecting the observations (dots) and the broken lines beneath the hatches do assumptive viscoelastic recovery: the hatched parts indicate the contributions of magmas to the deformations. In the figure, the broken line after 1946 has the same viscoelastic characteristics (re-tardation time) as the curve before 1946 and may asymptotically approaches the reference level.
In short, the present author interprets the secular deformations of Aira caldera by dividing into two periods: one is a viscoelastic recovery of the crust since 1915 and the other is the contributions of magma activity that became effective after 1935 or thereabouts according as magmas accumulate at the source (8〜10 km deep).
In Fig. 2, around 1935, magma pressure beneath the volcano may have begun to contribute to the uplifts of the caldera area as qualitatively indicated by hatches. It is a pity that we had no measurement for about 10 years preceding the 1946 eruption.
In the same figure, the recovery stagnated around 1962 for a few years. Kamo (1976, 1978) interpreted it as the effect of significant explosive activities centering at 1960. He also remarked that increased recovery during the period 1962 to 1972 was related to the low explosive activities of the same period.
On the other hand, it was already reported that the volcano body expands in advance of summit eruptions due to increase in magmatic pressure at the source at a depth deeper than 4 km right beneath Sakurajima volcano, by Kamo and Ishihara (1986) and Ishihara (1990).
3-2 Secular changes in regional deformation around Aira caldera
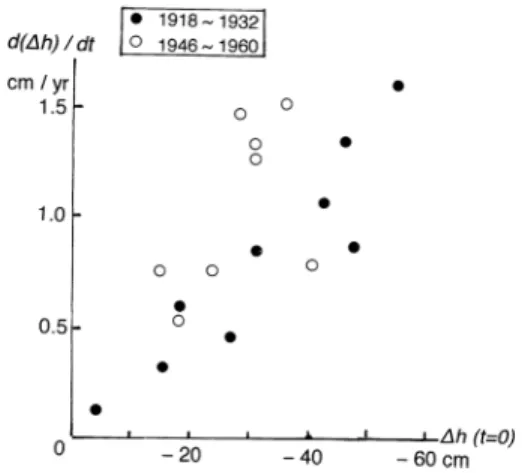
The recovery rates of 9 benchmarks around Aira caldera were already mentioned by Yokoyama (1986) and are reproduced in Fig. 6 where the rates of the two recovery stages, 1918〜1943 and 1946〜1960, are plotted against the initial displacements. They show roughly linear relationship: the larger the initial displacement the higher the recovery rate. This is characteristic of elastic or visco-elastic deformations of a medium, the crust in the present case. In Fig. 6, open circles (1946〜1960) a little diverge from linearity due to effect of magmatic pressure during the period (Fig. 2). Hence, the recovery is mainly spon-taneous or endogenous, and partly effected by magmatic
Fig. 6. Recovery rates vs. initial deformations at several benchmarks for precise levels.
force during the period 1946〜1960.
The other model may be possible. As discussed above, point source models can interpret subsidence or uplift caused by volcanic eruptions. Here we check their possi-bility in interpretation of temporal changes in the de-formations. As shown in Eq. (2), vertical displacement is directly proportional to P. If P changes exponentially with time, Δh changes in the same way. This model may interpret exponential changes of the Aira deformation, but needs to explain reality of such origin, and furthermore has difficulty in explaining the above characteristics; namely, the larger the initial displacement the higher the recovery rate (Fig. 6). Anyway, this is an exogenous origin model. Equation (2) can model the surface deformations caused by magmatic pressure successfully but not the secular changes in deformations.
3-3 Viscoelastic behavior of the ground around Aira caldera
From the standpoint that the recovery of the deformation around Aira caldera is endogenous, we interpret the process as illustrated in Fig. 7:
Assuming the crust to be viscoelastic body of Kelvin-type, we get the following relation:
p=γe+ηdedt , (3)
where p denotes force, e strain, γ Youngʼs modulus and
η viscosity. The second term is viscous resistance. Eq.
(3) is solved under the condition that the initial stress is zero and a constant stress p0is applied to the system: e=p0
γ
1−e ・t
. (4)When t tends to ∞, e tends to e∞=p0/γ. The term
(η/γ) has dimension of time:
τK=η/γ , (5)
And τKis the time necessary for the strain to decrease
from the initial value e0 to 1/ e, and named retardation
time. A body is assumed to be strained initially e0by
force p. When p is removed instantly, strain e of the body changes as follows:
e=e0etK, (6)
This is creep recovery.
Here it is a priori assumed that magma gradually accumulated in the reservoir and gradually exerted pres-sure to the earth crust. In Fig. 2, a probable height of B. M. 2474 in 1946 (a hollow circle) is determined by interpolation among the subsidence contours obtained by the surrounding benchmarks because it was lost at that time. We do not know its exact movements, and assume that B. M. 2474 suffered from a small subsidence and kept the same recovery rate because the volume of the 1946 lava was about 10 % of the 1914 lava. In the figure, the striped parts indicate probable contributions of magmatic pressure and the broken curves do viscoelastic recoveries. Hence the retardation time is estimated as 16.6±1 yr for the recovery curve (solid and broken line) between 1918 and 1946. The viscoelastic recovery between 1946 and 2000 (broken line) is drawn on the assumption that the benchmark continued to recover with the same retardation time. As a result, Fig. 2 may support acceptability of the above assumptions.
The accuracy of determination of the viscosity depends equally on Youngʼs modulus and retardation time. Mogi (2006) measured Youngʼ s moduli of rocks (andesite, marble and tuff) as a range of 1〜10×1010Pa. Here we
adopt the averaged value 5×10¹⁰Pa, and then, we get
viscosity of the ground as:
η=τK×γ=3×10¹⁹Pa・s
The deformation analyzed in the above discussion origi-nated in the upper crust of about 10 km deep because they can be interpreted by a point dilatation located at the same depth.
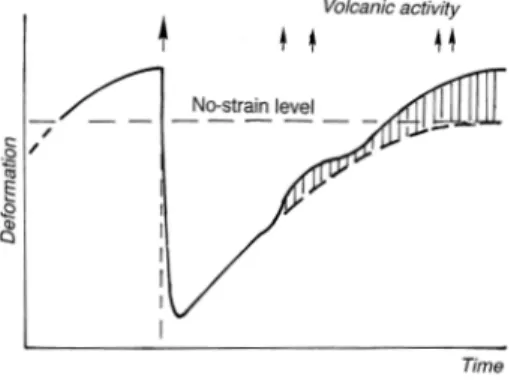
To interpret the meaning of Fig. 2, it is schematically redrawn in Fig. 8 where we assume “no-strain level” independent of volcanic activity. In the figure, the hatched part indicates the contribution of the magma pressure and the broken curve approaches asymptotically to the no-strain level due to elastic recovery. Actually, in Fig. 2, “no-strain level” cannot be defined exactly at present though it must be roughly near “reference level”.
In the present discussion, we assume the crust of volcanic regions to behave with viscoelasticity of Kelvin-type. Just before an eruption, the volcano and its sur-roundings may uplift somewhat due to a partial release of increasing magmatic pressure. In advance of a gigantic eruption of the volcano, the crust around the volcano suffers from magmatic pressure expressed by a point-source pressure P at depth D (about 8〜10 km in the event of Sakurajima volcano). The pressure P may reach high values, especially at andesitic volcanoes, at the climactic moment. When accumulated pressure is almost instantly released through the vents by an explosion, and simul-taneously implosive force acts at the point source P,
causing the crust to subside beyond the equilibrium level. The subsidence proceeds viscoelastically as exemplified in the 1914 Sakurajima eruption (Fig. 2). Shortly after the rapid subsidence is completed, the crust begins to recover towards the no-strain level (equilibrium level) due to viscoelasticity of the crust itself, and the crustal strain attains equilibrium in due time. Simultaneously with the recovery, magma pressure gradually accumulates at the source as the volcano is reactivated, and beyond the equilibrium that cannot be determined exactly at present. After 1980, as shown in Fig. 2, the recovery approaches the reference level, and the surface deformations are apparently governed by magma pressure (hatched parts). According to Iguchi (2007), the explosion activity or magma activity was highest around 1985 as shown in Fig. 2 (top) and thereafter decreased in number of explosions: Magma activity again tended to lift the ground after 1993. Anyway, in such a way, the volcano may approach the
critical condition for the next eruption.
4.Deformation Caused by the 1779〜80 Eruption of Sakurajima Volcano
The 1779〜80 eruption of Sakurajima volcano was comparable to or larger than the 1914 eruption: Explosion cloud reached a height of 12 km and ashes reached to Tokyo. According to Kobayashi (1988), pumices and lavas were issued from parasitic craters on the NE and S flanks, and almost simultaneously several small islands (“Ai” in Fig. 1) off the NE coast were formed by sub-marine eruptions and by upheaval of the sea bottom. The area covered with lavas of the 1779 eruption is nearly 9 km2 while that of the 1914 eruption is about 20 km2.
These values do not always exactly correspond to their magnitudes because their thicknesses are variable from place to place. As a volcanic activity before the 1779〜80 eruption, a summit eruption in 1766 is reported. After the 1779〜80 eruption, the volcano showed after-activities at “Ai” area in 1781〜82. We can refer old documents reporting that the N coast of Kagoshima Bay including the townships of Kagoshima, Kajiki and Kokubu (Fig. 1), were flooded to a depth of 1.5〜3 m by high tides for 4 or 5 years after the 1779 eruption. The subsidence was signifi-cant even without instruments at that time. Considering that B.M. 2474 subsided about 0.8 m in 1914, we provi-sionally assume that the site of B.M. 2474 subsided in 1779 within a range of 0.8〜1.5 m, or 1.2 m on the average, referred to the same height as the 1914 subsidence, i.e. 26. 4 cm above the reference level. Furthermore, the recovery after a subsidence in 1779 is assumed to have begun instantly.
Now we may extrapolate the time-axis in Fig. 2 back to the 1779 eruption as shown in Fig. 9. There occurred small 5 activities after 1779. However, the recovery should have not been influenced by these volcanic activities because they were not so much energetic. In Fig. 9, it is noticeable
Fig. 8. A schematic secular deformation curve of B.M. 2474, corresponding to Fig. 2. Actually “No-strain level” cannot be determined and “Reference level” is used in Fig. 2.
Fig. 9. Deformation curve of B.M. 2474; The time-axis in Fig. 2 is hypothetically extrapolated back to the 1779 eruption. The notations are the same as Fig. 2.
that the volcano was rather calm from 1799 until 1914 except phreatic activities at the summit in 1860 and 1899. The recovery curve of the 1779 subsidence is governed by the retardation time 16.6 years deduced from the recovery curve of the 1914 subsidence. As for “no-strain level”, the reference level in Fig. 2 is extrapolated to the year of 1779. In Fig. 9, we may imagine that the 1779 depression may have taken roughly the similar recovery process as the 1914 depression. This figure may offer us some sugges-tions regarding long-term prediction of the future activities of Sakurajima volcano.
5.Another Examples of Secular Changes in Volcano-genetic Deformation
Viscoelastic recovery of vertical deformation caused by volcanic eruptions is not particular to Aira caldera, but we have another example at Miyake volcano.
5-1 Deformation caused by the 1983 eruption of Miyake volcano
Miyake volcano is on a volcano island of basaltic rocks and has erupted repeatedly in historical times, such as 1811, 1835, 1874, 1940, 1962, 1983 and 2000 after the 19th century. In this paper, we refer the deformation
caused by the 1983 eruption.
In October 1983, linear fissures of about 4 km long on the SW flank (Fig. 10) ejected lava flows of 8×10⁶m3
DRE. In June 2000, a small submarine eruption occurred
1 km west off the island, and phreatic explosions occurred at the summit crater issuing ashes and bombs, no lavas and caused collapses of the crater bottom.
The Geographycal Survey Institute established the leveling routes circulating Miyake Island in 1979. There is a tide-gauge station at the SW shore of the island. In the present discussion, the tide-gauge station is adopted as the reference point because the height of the station was calibrated with a benchmark at the Izu Peninsula by continuous GPS observations of the Geographycal Survey Institute. Height changes at the benchmarks around the island caused by the 1983 and the 2000 eruptions were surveyed by the Geographycal Survey Institute (1984, 2005) referred to November 1981 and the tide-gauge station, as shown in Fig. 11. The distance between the successive benchmarks is about 1.5 km on the average. Yokoyama and Maekawa (1984) studied the deformation in 1983 and showed that the island tilted as a whole about 4×10⁻⁵(rad.) and in a direction N 30° E up. The height
changes of bench marks caused by the 2000 eruption are also given in Fig. 11 where both the changes are similar in pattern: The latter shows a tilt movement with a similar tilt axis but with a larger angle, 1.5×10⁻⁴(rad.). The tilts
caused by the 1983 eruption had recovered roughly half as of 1993 (Yokoyama, unpublished), and therefore the tilt of the 2000 eruption may have been smaller than the above value. We may say that Miyake Island would tilt a certain amount in roughly the same direction by an eruption of the volcano and the tilt would recover at a certain rate after the eruption. In the present paper, the author does not discuss the tilt movements because the data are not sufficient.
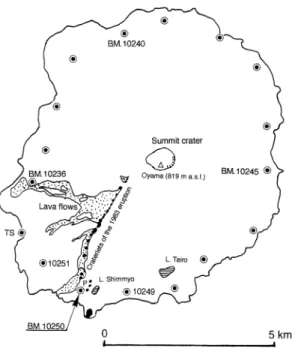
Fig. 10. The 1983 eruption of Miyake volcano: Distri-butions of vents (black) and lava flows (dotted) after Aramaki and Hayakawa (1984), and the benchmarks of precise levels. “TS” denote the tide-gauge station.
Fig. 11. Vertical deformations along the leveling route on Miyake Island caused by the 1983 and the 2000 erup-tions. TS: Tide-gauge station. The 1983 eruption curve shows the changes between Dec. 1982 and Dec. 1983, and the 2000 eruption curve does between June 1999 and Feb. 2002. Hollow circles indicate assumed values. (original data after the Geographical Survey Institute).
BM. 10250 is the benchmark nearest to the eruption site, about 230 m distant and was bombarded with rock ejecta from the new vents around P point in Fig. 10. The S part of the island centering at B.M. 10250 locally uplifted by the eruption as shown by a hatched part in Fig. 11. B.M. 10250 was found to have uplifted about 18 cm referred to the tide-gauge station and the year of 1979. This uplift was clearly caused by a magmatic intrusion during the 1983 eruption. This is confirmed by gravity changes observed along the route of precise leveling (Yokoyama and Maekawa, 1984): In a diagram of gravity changes vs. height changes, B. M. 10250 deviates plus 65 μ gal from the line of Free-air gradient line. This means that magmas of high density had intruded below the benchmark. An upheaval of 18 cm per a span of about 6 km is within elastic limits. B.M. 10250 was lifted by an increase of magmatic pressure, and began to recover viscoelastically after release of the magmatic pressure by explosions at the near vents.
5-2 Secular changes of deformations caused by the 1983 and 2000 eruptions of Miyake volcano
The secular changes in the height of B.M. 10250 since 1979 are shown in Fig. 12. After the 1983 eruption, the benchmark has subsided with time exponentially though the process was reset by the 2000 eruption. B.M. 10250 subsided about 17 cm by the 2000 eruption. This is a result of a tilt movement as a whole island. The present author assumes that BM. 10250 was instantly uplifted by magma intrusion near the benchmark, and after magma activities finished, the benchmark began to recover viscoelastically.
In the case of Miyake volcano (Fig. 12), the retardation time is roughly 5.8 years. Assuming Youngʼs modulus γ =5×10¹⁰Pa, the same to the case of Aira caldera, we get
viscosity of the upper crust surrounding B.M. 10250 as:
η=τK×γ=0.92×10¹⁹Pa・s
This is about 1/3 of that of Aira caldera (η=3×10¹⁹
Pa·s) and the difference may be due to the shallower origin of the Miyake deformation.
In the 2000 eruption, the activities were confined to the summit area, and B.M. 10250 subsided about 17 cm as shown in Fig. 11. This subsidence was resulted from a tilt of the island as a whole, not local deformation.
For reference to non-volcanic regions, Artyushkov (1971) gave the viscosity of asthenosphere beneath the Canadian shield as the order of 1019Pa·s by analyses of
rheological properties of the crust according to data on isostatic movements.
5-3 Secular changes in volcanogenetic deformation due to self-loading compaction: Serapeo and Showa-Shinzan
On the other hand, we know another examples of secular subsidence of volcanic structures:
a) Serapeo close by the port of Pozzuoli near Naples:
Secular changes in height of Serapeo, one of the Roman ruins, have been well documented since 200 B.C. The spot is located at the center of Campi Flegrei caldera, and usually would tend to subside monotonously and change to instant upheaval when major local earthquakes and major eruptions of nearby volcanoes. Oliveri del Castillo and Quagliariello (1969) attributed the linear subsidence (1.4
Fig. 12. Secular changes in height of B.M. 10250 referred to the tide-gauge station and the year of 1979. Hollow circles denote assumed values. (original data after the Geographical Survey Institute).
cm/year) during the period, the 1820ʼs to 1968, to self-loading compaction of the caldera fills.
b) Showa-Shinzan (the 1944 lava dome) of Usu volcano,
Hokkaido: This dacitic lava dome was formed by a parasitic eruption for the period, January 1944 to October 1945. After its completion, it has gradually subsided, and secular changes of its height have been observed, and proved to be roughly linear at 5 cm/year (Yokoyama and Seino, 2000, Fig. 13). The subsidence may be caused also by self-loading compaction of the basements of the dome. These two examples are contrasts to viscoelastic behaviors of Aira caldera and Miyake volcano.
5-4 Laboratory measurements of viscoelastic behav-ior of granite specimens
Kumagai (1991) and Itô (1979) carried out laboratory measurements of viscoelastic behavior of granite speci-mens for long years. Since 1957, they measured creeps of two large beams of granite, 215×12.3×6.8 cm in size. One of these specimens was bended under its own weight plus a center-load (22. 06 kg). The maximum bending stress in the unloaded beam is 1.3 MPa. After more than 30 year experiment, they analyzed deflection curves of the granite beam and obtained its Youngʼs modulus at 2.6× 10¹⁰Pa and its viscosity at 6.5×10¹⁹Pa·s assuming the
flowage of the granite beam to be Maxwell type. The value of viscosity is a little larger than the above estimates of the field data.
Deformations at Aira caldera and Miyake volcano are related to the upper crust of 10 km and a few km deep, respectively. Considering that the viscosity, in general, increases rapidly with the hardness of the material and the pressure, the above three values of viscosity, 6.5×10¹⁹Pa·
s for a granite specimen, 3×10¹⁹Pa·s for Aira caldera, and
0.9×10¹⁹Pa·s for Miyake volcano, are of a reasonable
order of magnitude though their Youngʼ s moduli are assumed to be identical.
6.Concluding Remarks
Co-eruptive deformation of the 1914 eruption of Sakura-jima volcano is reexamined: If we use the results of tri-angulations in the area, we can interpret the deformation by assuming the center of subsidence on Sakurajima volcano. Secular changes in the deformation caused by the 1914 eruption can be interpretable into that they are composed of two factors: One is viscoelastic recovery of the ground and the other is uplifts due to accumulation of magmatic pressure at the source. These two affected with time lags: In the early period, the viscoelastic factor solely acted, and after 20〜30 years, magmatic pressure began to join in uplifting the ground.
Recovery of the upheaval caused by the 1983 eruption of Miyake volcano is also interpreted by viscoelastic behavior of the volcano ground, of which viscosity proves to be a little smaller than that of the Aira deformation though these values have some ambiguity of the Youngʼs
moduli.
At the beginning of the 21st century, from the secular
changes in the Aira deformation caused by the 1914 eruption of Sakurajima, we may suppose that the viscoelastic recovery is approaching to no-strain level and the pressure effect of the magma reservoir is predominant though the no-strain level canʼt be exactly defined. Now, for a century, the results of various geophysical and geological observations on and around Sakurajima volcano have been fairly accumulated. It is high time that one should synthesize and interpret the observational results, and build, if possible, long-range prospects for future volcanic activities of Sakurajima volcano.
Acknowledgements
The author thanks the late Profs. F. Omori and B. Kotô who left their valuable reports on the observations of the 1914 eruption of Sakurajima volcano. The author is deeply appreciates the published data of seismological and geodetic observations by the Sakurajima Volcano Obser-vatory, Kyoto University since 1960. This paper benefited greatly from discussion with K. Ishihara for many years. The author wishes to thank heartily K. Kamo, T. Kobayashi and M. Iguchi for their willing supply of new findings in the course of the present study. The author is indebted to H. Y. Mori for helpful discussion with him. Infalliable reviews by K. Ishihara and an anonym are greatly appreciated.
References
Abe, K. (1981) Seismometrical re-evaluation of the Sakurajima earthquake of January 12, 1914. Geophys. Bull., Hokkaido
Univ., 39, 57-62 (in Japanese with English abstract).
Aramaki, S. and Hayakawa, Y. (1984) Sequence and modes of eruption of the October 3-4, 1983 eruption of Miyakejima.
Bull. Volcanol. Soc. Japan,29, 524-535 (in Japanese with
English abstract).
Artyushkov, E. V. (1971) Rheological properties of the crust and upper mantle according to data on isostatic movements.
J. Geophys. Res., 76, 1376-1390.
Dambara, T. (1966) Vertical movements of the earthʼs crust in relation to the Matsushiro earthquake. J. Geod. Soc. Japan,
12, 18-45 (in Japanese with English abstract).
Geographical Survey Institute (1984) Vertical deformation at Miyake island. Bull. Comm. Predic. Volca. Erup., 30, 32-34 (in Japanese).
Geographical Survey Institute (2005) Crustal deformations in Miyake island. Bull. Comm. Predic. Volca. Erup., 90, 92-103 (in Japanese).
Iguchi, M. (2007) Structure of Sakurajima volcano revealed by geophysical observation and significance of its survey.
BUTSURI-TANSA, 60, 145-154 (in Japanese with English
abstract).
Iguchi, M., Tameguri, K. and Yokoo, A. (2008) Sequence of activities of Sakurajima volcano -1997〜2007-. In Report
Volcano, Research Center of Volcanology, Disas. Prev.
Res. Inst., Kyoto Univ., 1-18 (in Japanese).
Ishihara, K. (1990) Pressure sources and induced ground deformation associated with explosive eruptions at an andesitic volcano: Sakurajima volcano, Japan. In Magma
Transport and Storage (Ryan, M. P. ed.) John & Sons Ltd,
335-356.
Itô, H. (1979) Rheology of the crust based on long-term creep tests of rocks. Tectonophysics, 52, 629-641.
Kamo, K. (1976) Some problems on the prediction of volcanic eruptions -In case of the Volcano Sakura-jima-. Bull.
Disas. Prev. Res. Inst., No. 19, A, 31-39 (in Japanese with
English abstract).
Kamo, K. (1978) Some phenomena before the summit erup-tions at Sakura-zima volcano. Bull. Volcanol. Soc. Japan,
23, 53-64 (in Japanese with English abstract).
Kamo, K. and Ishihara, K. (1986) Precursor of summit erup-tion observed by water-tube tiltmeters and extensometers.
Ann. Disas. Prev. Res. Inst., Kyoto Univ., 29B-1, 1-12 (in
Japanese with English abstract).
Kotô, B. (1916) The great eruption of Sakurajima in 1914. J.
Col. Sci., Imp. Univ. Tokyo, 38, 1-237.
Kobayashi, T. (1988) Geological map of Sakurajima volcano. In: A guidebook for Sakurajima volcano (Aramaki, S., Kamo, K., Kamada, M., and Kagoshima Prefectural Gov-ernment (eds)), Kagoshima Internat. Conf. on Volcanoes, 88 p.
Kumagai, N. (1991) Collected Papers on the Ongoing
Lab-oratory Experiments on the Creep of Granite to Com-memorate Thirty Years of Continued Research. Yoshioka
Shoten Co., Kyoto, 289p. (in Japanese).
Matuzawa, T. (1976) Theory of Earthquakes and Its
Ap-plications. Univ. Tokyo Press, Tokyo, 223p. (in Japanese).
Miyabe, N. (1934) Deformation of the earthʼ s crust in the neighborhood of Sakurazima. Bull. Earthq. Res. Inst., 12, 471-481.
Mogi, K. (1958) Relations between the eruptions of various volcanoes and the deformations of the ground surface around them. Bull. Earthq. Res. Inst., 36, 99-134. Mogi, K. (2006) Experimental Rock Mechanics. Taylor &
Francis, London, 361p.
Oliveri del Castillo, A. and Quagliariello, M. T. (1969) Sulla genesi del bradisismo Flegreo. Atti Ass. Geofis. Ital., 18° Convegno, 557-594.
Omori, F. (1914-1922) The Sakura-jima eruptions and earth-quakes. Bull. Imp. Earthq. Inv. Comm., 8, 1-525. Rikitake, T. (1975) Statistics of ultimate strain of the earthʼs
crust and probability of earthquake occurrence.
Tectono-physics, 26, 1-21.
Sassa, K. (1956) Some problems on the forecasting of the earthquake (II) (On the observation of the crustal strain accompanied by the earthquake). Collected Papers for the 5
Year Anniversary of Disas. Prev. Res. Inst., Kyoto Univ.,
1-5 (in Japanese with English abstract).
Sezawa, K. (1931) The plastico-elastic deformation of a semi-infinite solid body due to an internal force. Bull. Earthq.
Res. Inst., 9, 398-406.
Tsukui, M. and Aramaki, S. (1990) The magma reservoir of the Aira pyroclastic eruption -A remarkably homogeneous high-silica rhyolite magma reservoir. Bull. Volcanol. Soc.
Japan, 35, 231-248 (in Japanese with English abstract).
Yamaguchi, K. (1975) Research on Sakurajima Volcano - Geological and Petrological Researches of the
Sur-rounding Area of Kagoshima Bay and Sakurajima Volcano -. Educ. Soc. Earth Sci. Japan, 128p. (in Japanese).
Yokoyama, I. (1961) The flow and upwelling of lava (Parts I and II), Bull. Volcanol. Soc. Japan, 6, 51-59 (in Japanese with English abstract).
Yokoyama, I. (1986) Crustal deformation caused by the 1914 eruption of Sakurajima volcano, Japan and its secular changes. J. Volcanol. Geotherm. Res., 30, 283-302. Yokoyama, I. (1997) An interpretation of the 1914 eruption of
Sakurajima volcano. Proc. Japan Acad., 73, Ser. B, 53-58. Yokoyama, I. (2005) A side view of geophysical research of caldera structure for the recent 50 years. Bull. Volcanol.
Soc. Japan, 50, Spec. Issue, S59-S76 (in Japanese with
English abstract).
Yokoyama, I. and Maekawa, T. (1984) Ground deformation and gravity change associated with the 1983 eruption of Miyakejima volcano. Bull. Volcanol. Soc. Japan, 29, Spec. Issue, S130-S140 (in Japanese with English abstract). Yokoyama, I. and Seino, M. (2000) Geophysical comparison
of the three eruptions in the 20thcentury of Usu volcano, Japan. Earth Planets Space, 52, 73-89.
Yoshikawa, K. (1961) On the crustal movement accom-panying with the recent activity of the volcano Sakurajima (Part 1). Bull. Disas. Prev. Res. Inst., Kyoto Univ., 48, 2-15.