Radiation-induced glide motion of interstitial
clusters in concentrated alloys
著者
Satoh Y., Abe H., Matsunaga T.
journal or
publication title
Philosophical Magazine
volume
94
number
19
page range
2170-2187
year
2014-05-07
URL
http://hdl.handle.net/10097/63881
doi: 10.1080/14786435.2014.907511This is an Accepted Manuscript of an article published by Taylor & Francis Group in Philosophical Magazine on 07/05/2014, available online:
http://www.tandfonline.com/10.1080/14786435.2014.907511
Philosophical Magazine, 94 (2014), pp. 2170–2187. Radiation-induced glide motion of interstitial clusters in concentrated alloys
Y. Satoh, H. Abe, T. Matsunaga
Institute for Materials Research, Tohoku University, 2-1-1 Katahira, Aoba-ku, Sendai 980-8577, Japan
Abstract
We propose a mechanism for glide motion, i.e., one-dimensional (1D) migration, of interstitial clusters in concentrated alloys driven by high-energy particle irradiation. Interstitial clusters are fundamentally mobile on their respective 1D migration tracks, but in concentrated random alloys they are stationary at the position where the fluctuating formation energy achieves a local minimum. Irradiation changes the microscopic distribution of solute atoms through atomic displacement and recovery of the produced Frenkel pairs, which causes cluster 1D migration into a new stable position. In molecular dynamics simulations of interstitial clusters up to 217i in Fe-Cu alloys, stepwise 1D migration was observed under interatomic mixing or shrinkage of the cluster: a single 1D migration was induced by two exchanges per atom or cluster radius change by two interatomic distances. The 1D migration distance ranged up to several nanometers. We compared the frequency and distance of 1D migration with those for in-situ observation using high-voltage electron microscopy, allowing for the extremely large rate of interatomic mixing and cluster shrinkage in the present
1. Introduction
Long-standing efforts have been devoted to elucidating and modeling defect structural evolution from atomic displacements and subsequent point defect reactions because they are responsible for the degradation of mechanical properties of materials subjected to energetic particle irradiation. Molecular dynamics (MD) simulations of cascade damage in pure metals have shown the interstitial clusters produced in them (i.e., the cascades) escape from the damage zone through one-dimensional (1D) migration [1]: a glide motion along the direction of the Burgers vector with low activation energies. Thereafter theoretical work related to radiation damage has
emphasized 1D migration as a potential mechanism for controlling the kinetics of point defects produced by high-energy neutron irradiation. The probability of recombination between interstitials and vacancies would be reduced considerably by 1D migration, thereby making 1D migration a driving force for swelling onset [2, 3]. Although 1D migration in alloys containing both substitutional and interstitial solute/impurity atoms has importance in both fundamental and technical aspects, the mechanism whereby clusters and solutes/impurities interact remains inadequately understood.
In-situ observation using high-voltage electron microscopy (HVEM) has revealed
that electron irradiation causes 1D migration to interstitial clusters at low temperatures (e.g., room temperature) in high-purity model alloys and steels: V-Ti [4], Fe-Cr [5], Fe-Cu, Fe-Si and Fe-Ge [6], A533B steel [7], and SUS316L and its model alloys [8]. The frequency of 1D migration is proportional to the electron beam intensity [8]. No 1D migration occurs in concentrated alloys with conventional 200 kV TEM. Another
important observation is that solute atoms retard free 1D migration. In iron-based binary alloys with low impurity levels, the 1D migration distance decreased from a few tens of nanometers to less than 10 nm with increasing solute concentration of 50–1000 appm. At higher concentrations, the 1D migration distance is insensitive to the solute
concentration [6]. The concentrated alloys including practical alloys have similar 1D migration distance, i.e., less than 10 nm [4–8]. No clear difference is apparent in the frequency or distance of 1D migration among SUS316L and its high-purity model alloys (Fe-18Cr-13Ni) at room temperature, suggesting that the fundamental mechanism of the 1D migration in concentrated alloys is related to major solute atoms rather than to minor solute/impurity atoms [8].
concentrated alloys have been reported based on MD and molecular statics (MS) methods. Marian et al. compared the diffusion coefficient of interstitial clusters up to
20i between iron and Fe-1%Cu at temperatures of 400–1300 K [9].The diffusion
coefficient of 6i-20i in Fe-1%Cu is not less than 1/3 of that in iron; solute copper atoms do not change the migration energy much but decrease the diffusion prefactor.
Terentyev et al. examined 1D migration of interstitial clusters up to 331i in Fe-Cr alloys for Cr concentrations up to 20% [10–12]. They pointed out the difficulty of estimating the diffusion coefficient because clusters are confined in valleys of fluctuating
formation energy in the limited timescale of MD methods. They suggest that the diffusion coefficient has non-monotonic variation with solute Cr concentrations and cluster size. Interstitial clusters observed with HVEM are larger than 100i. Mechanisms for 1D migration induced by irradiation were proposed for iron [13–15], but not for concentrated alloys.
The present authors proposed an analytical model for fluctuating formation energy of a gliding interstitial cluster (radius rc) in a random binary alloy (solute concentration
cs). In the model, the superposition of interaction energy between the cluster and individual solute atom fluctuates with the glide distance of the cluster, which shows fluctuation in the formation energy [16]. The model yields the average amplitude of the fluctuation as proportional to rc1 2cs1 2
. Although the interaction energy between an interstitial cluster and a solute atom is as low as around 0.1 eV in an Fe-Cu system, the typical energy height of local peaks in the fluctuation exceeds a few electron volts for 217i in concentrated alloys. The fluctuation will act as a serious barrier against 1D migration of interstitial clusters, which must be considered for modeling of 1D
migration of large clusters in concentrated alloys. The fluctuation wavelength does not depend virtually on rc or cs, but on the range of the interaction potential. The distance between the neighboring hills and valleys ranges up to 4 nm in concentrated Fe-Cu alloys.
In this paper, we propose a mechanism for radiation-induced 1D migration in concentrated alloys as follows. Interstitial clusters are stable at a local minimum in the fluctuating formation energy on their respective 1D migration tracks. Under irradiation, atomic displacements and the following recovery of produced point defects change the microscopic distribution of solute atoms continuously from one random distribution to another (both are mutually equivalent). The interatomic mixing changes the stable
cluster position on the track and causes cluster 1D migration into a new stable position. Furthermore, growth and shrinkage of interstitial clusters under irradiation change the microscopic distribution of solute atoms around the loop dislocation itself, which results in 1D migration. The wavelength of the fluctuating formation energy of as much as several nanometers is regarded as responsible for the short 1D migration observed in various alloys. We examined the model applicability using atomistic simulations based on MD and MS methods. Then we compared the frequency and distance of 1D
migration between the present MD simulation and in-situ observation under electron irradiation. This study was undertaken to contribute to the elucidation and modeling of 1D migration processes of interstitial clusters in alloys of practical use. Results are expected to engender a more precise understanding and modeling of microstructural evolution upon energetic particle irradiation.
2. Calculation procedure
The calculation cell contained about 1.3 × 10⁶
mobile atoms [16]. An interstitial cluster of a hexagonal plate was placed around the center of the cell. The maximum radius of the cluster was 8b (217i), where b is the interatomic distance. Solute copper atoms were introduced at random at concentrations of 1, 3, 10, or 30 atomic percent. A random alloy is not real at high solute concentrations because of its low solubility, but we regarded the Fe-Cu system as an example of binary alloys. Using HVEM, Hamaoka et al. examined 1D migration in Fe-Cu alloys with solute concentrations of 50–9000 appm at room temperature [6]. Although an advanced interatomic potential based on results of recent ab initio calculations is available [17], we have used the potential given by Ackland et al. [18] in a series of our studies [14,16] and in the present work. The volume size factor of the solute copper atom in the iron lattice is about +8.8% in the potential [18]. In the MD method, the step time was 2 fs. Periodic boundary conditions were applied for all faces of the calculation cell at zero pressure, and the temperature was controlled at 300 K. To correlate the dynamic processes of 1D migration with the static formation energy of the system, we sometimes stopped the MD calculation, quenched the cell to 0 K, and calculated the formation energy of the cluster using the MS method. We translated the distribution of all the solute atoms in the cell toward the glide direction for a distance b, and calculated again the formation energy. An iteration
position.
The interstitial atoms in the cluster were identified as two atoms in a single Wigner–Seitz cell. The cluster position was represented by the center of mass of the interstitial atoms. The plane in which the interstitial cluster lay was determined using linear regression (i.e., least-squares method) of the interstitial atoms. The plane’s unit normal vector (h, k, l) was expressed as n=(H K L) in the form of a Miller index, where 10h, 10k, and 10l were rounded respectively to the nearest integers H, K, and L. The plane of 217i was {771} in iron. In Fe-10%Cu, the plane was {771}, {943}, or
sometimes deviated slightly, for example, into {861} or {933}. The plane was {771} for 61i in Fe-10%Cu, and was not determined for 7i. The plane was conserved during the quenching and MS methods. We monitored the configuration of interstitial clusters also by visual analysis of the MD and MS results.
3. Results
3.1. 1D migration induced by interatomic mixing in concentrated alloys
A kinetic energy transferred to iron and copper atoms, ranging from the threshold energy for atomic displacement (around 20 eV) to the maximum recoil energy (around 100 eV for a head-on collision of 1250 kV electrons), displaces several atoms in the subsequent atomic collisions, which results in the production of a single Frenkel pair or occasionally two pairs. Under typical HVEM conditions, most of the produced point defects disappear by mutual recombination between interstitials and vacancies. The rest disappear by annihilation at sinks such as specimen surfaces or defect clusters. The microscopic distribution of solute atoms will change under irradiation through the production and recovery of point defects, which is regarded as interatomic mixing.
We examined 1D migration driven by the interatomic mixing using MD with the following procedure. We selected a pair of atoms located at first-nearest distance randomly from the cell, and exchanged the species of the two atoms: we switched
parameters expressing the atomic species without changing the coordinates or velocities. The operation contributes to the mixing when the two atoms are a pair of solute and solvent atoms; otherwise it has no effect. Exchanges of first-nearest pairs were done to simulate the replacement of atoms involved in low-energy collisions and in point defect migration. We exchanged 51, 259, or 1296 pairs in the calculation cell (i.e., 4 × 10⁻⁵
, 2 × 10⁻⁴
, or 10-3
where the exchange rates were denoted respectively as 0.4, 2, or 10 epa ns-1
. Individual simulation runs were longer than 5 ns, adopting different initial conditions for the solute distribution, position of the interstitial cluster, and random number seeds for picking up the atom pairs. The total simulation time was longer than 60 ns for individual
conditions.
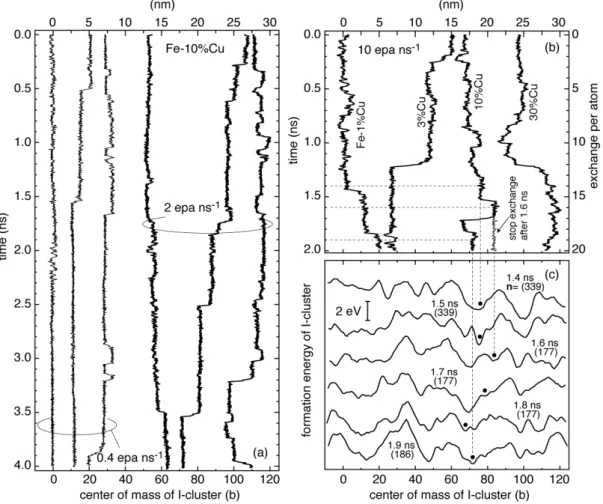
Figure 1 (a) presents examples of trajectories of 217i in Fe-10%Cu under successive exchanges of atoms at the low and middle rates. Trajectories involve
stepwise 1D migration at irregular intervals, slow 1D migration, and fine scale vibration within short distances. A few trajectories did not involve any stepwise 1D migration at the low exchange rate, as shown by the leftmost trajectory in the figure. Stepwise 1D migration occurs more frequently at the middle exchange rate. Figure 1(b) compares trajectories of 217i in Fe-Cu alloys with four solute concentrations at the high exchange rate. The thin line shows that the interstitial cluster in Fe-10%Cu was stationary
immediately after stopping the exchange operation. Figure 1(c) presents variation of the formation energy profile of 217i in Fe-10%Cu under successive exchanges. The cluster followed valleys of the profile through 1D migration and occasional changes in the cluster plane n. The 1D migration as long as 5 nm observed around 1.7 ns in Fe-10%Cu was attributed to the cluster running down the long potential slope that appeared around the cluster. These results support the inference that interatomic mixing induces 1D migration in concentrated alloys.
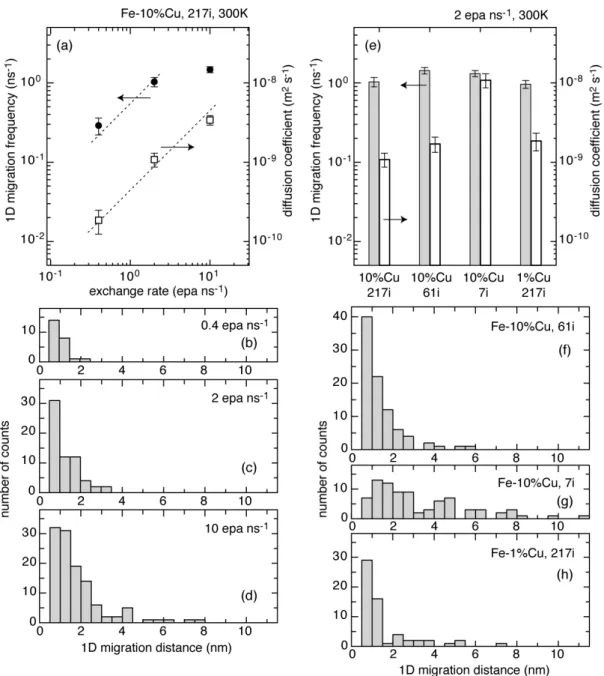
We evaluated the frequency and distance of 1D migration induced by interatomic mixing. We discriminated 1D migration events from the trajectories based on the following assumptions. 1) A cluster was in a stationary state if its center of mass stayed within 2b (0.5 nm) over 0.1 ns. Also, 2) a single 1D migration event was a sequence from one stationary state to another through 1D migration longer than 2b, irrespective of the time spent for the migration. Then the 1D migration distance was that between the two stationary points. The 1D migration frequency was defined by the average number of 1D migration events in a unit time. Figure 2(a) presents the variation of the 1D migration frequency in Fe-10%Cu against the exchange rate. At the low and middle exchange rates, the frequency was almost proportional to the exchange rate, where a
single 1D migration event was induced by about two epa: 0.5 migrations epa-1
. The saturation of the frequency at the high exchange rate is expected to be caused by an overlapping of 1D migration events. Figure 2(e) shows that the 1D migration frequency
did not depend strongly on the cluster radius or solute concentration under the middle exchange rate. Figures 2(b)–2(d) and 2(f)–2(h) compare the 1D migration distance among conditions. The occurrence of 1D migration decreased monotonically with increasing 1D migration distance. The distance was less than 10 nm, excepting the small cluster 7i shown in Figure 2(g).
We estimated the diffusion coefficient D of interstitial clusters from the
trajectories shown in Figure 1. In the method of analysis that has been widely applied to study diffusion of interstitial clusters [9, 19–22], each trajectory is divided into shorter
segments of equal time length ts, and the square displacement R
2
is calculated for each segment. The diffusion coefficient for one-dimensional diffusion is given as
D = 1 m R2 2ts i=1 m
!
, (1)where m is the total number of segments. In the present case, the value of D
decreased with increasing ts and then saturated to a constant value. In figures 2(a) and
2(e), we plotted D in the saturation: ts larger than about 200ps. Figure 2(a) shows
that the diffusion coefficient of 217i in Fe-10%Cu was proportional to the exchange rate, although the 1D migration frequency was reduced from the proportionality at the high exchange rate because of disturbance of the stationary state. The absolute value of the diffusion coefficient at the middle exchange rate was about an order of magnitude smaller than that for thermal 1D migration of small cluster 20i in Fe-1%Cu at 400K [9]. Figure 2(e) indicates that the diffusion coefficient was large for the small cluster 7i. It would reflect the long 1D migration shown in Figure 2(g). The origin of the long migration is briefly discussed in Sec 4.3.
3.2. 1D migration induced by shrinkage of interstitial clusters
Interstitial clusters change their radius under irradiation because of an imbalance of the number of absorbed point defects between vacancies and interstitials. Growth or shrinkage of an interstitial cluster, i.e., a climb motion of the loop dislocation, will alter the microscopic distribution of solute atoms around the loop dislocation itself, which might induce another 1D migration. To examine the model applicability, we monitored an interstitial cluster to shrink from 217i to 7i in MD simulation at 300 K while
intervals of 104
fs (i.e., 5000 MD steps). We examined shrinkage instead of growth because of the easy operation in the MD simulation. The model was not real because it did not include another interatomic mixing associated with migration and absorption of point defects that are essentially involved in the growth and shrinkage of interstitial clusters. We made eight simulation runs for each Fe-1, 3, 10, and 30%Cu alloy, adopting different initial conditions for the solute distribution.
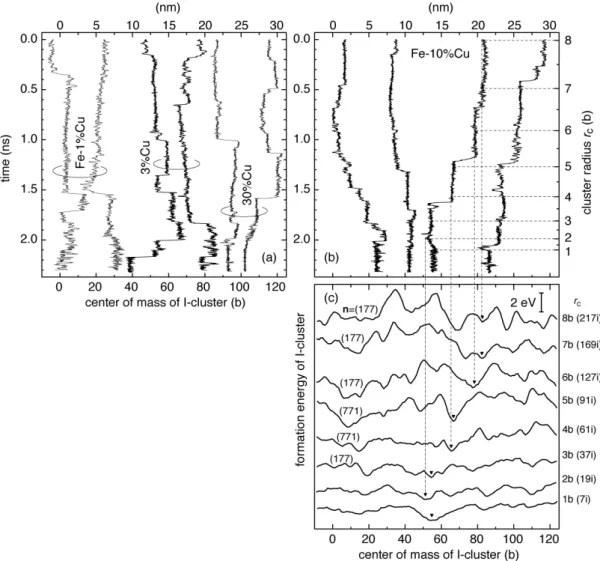
Figures 3(a) and 3(b) present examples of trajectories of shrinking interstitial clusters in the four Fe-Cu alloys. Again, the trajectories involve stepwise 1D migration, slow migration, and fine scale vibration. Figure 3(c) portrays the variation of the formation energy profile of a shrinking cluster in Fe-10%Cu. The cluster follows valleys through 1D migration and occasional changes of the cluster plane. With decreasing cluster radius, the amplitude of the fluctuation in the formation energy decreases, although the fluctuation wavelength remains unchanged, which is explained by the model for the fluctuating formation energy [16]. The profile changes
considerably by radius change by about 2b, which is expected to reflect the range of the strong interaction between the cluster and a solute copper atom, being a few b [16, 23].
Again we regarded the cluster staying within 2b over 0.1 ns as in a stationary state; and we ignored 1D migration less than 2b. Figure 4(a) shows variation in the number of 1D migration events with the time and the solute concentration. Although the data are scattered, it is readily apparent that the number of 1D migration events
increases with decreasing cluster radius, and that no considerable difference exists among the four solute concentrations. We defined the frequency of 1D migration as the average number of 1D migration events during the radius change by distance b. Figure 4(b) shows that the 1D migration frequency averaged over all the solute concentrations
was almost constant at around 0.5–0.6 b-1
, excepting the cluster radius less than 4b. The frequency is consistent with the variation of the formation energy profile shown in Figure 3(c). The position of valleys differs considerably when the radius changes by about 2b. Figure 4(c) shows distributions of the 1D migration distance. The distribution shows no great difference among the four concentrations. It is similar also to that induced by interatomic mixing shown in Figures 2(b)–2(d).
3.3. Other 1D migration behavior
results described above. Figure 5(a) shows the reference trajectories of the center of mass of 217i at 300 K while inducing neither the exchange of atoms nor shrinkage. The rightmost line indicates free 1D migration in iron; the migration was one-dimensional and involved no change in the Burgers vector or the cluster configuration. According to
the analysis proposed by Osetsky et al. [21],the jump frequency and the correlation
factor were 1.8 × 10¹¹
jumps s-1
and 2.8, respectively, which were not contradictory of the results obtained for 30i – 100i in iron [21, 22]. The other trajectories in Figure 5(a) are under interaction with solute copper atom(s). Figure 5(b) shows respective
formation energy profiles at 1 ns in Figure 5(a). The leftmost line in Figure 5(a) shows the cluster associated with a single copper atom immediately outside the cluster (a dilatational side of the loop dislocation core) with an attractive interaction as small as 0.1 eV [16]. In the present timescale, 1D migration was suppressed, although the cluster seemed to be on the way to escape from the potential valley several times. Similar trapping is observed for a small interstitial cluster (7i) associated with a single solute copper atom [14, 23]. The 1D migration was suppressed further in Fe-1%, 3%, 10% and 30%Cu alloys; the interstitial clusters were stationary in valleys of the respective
formation energy profiles. Deep valleys exceeded 1 eV in all alloys. The 1D migration is expected to be suppressed around room temperature, even in the timescale of in-situ
experiments: around 100
s. Generally, the suppression effect will be greater for a larger cluster at a higher solute concentration because the average amplitude of the fluctuation increases in proportion to rc
1 2c s 1 2
[16].
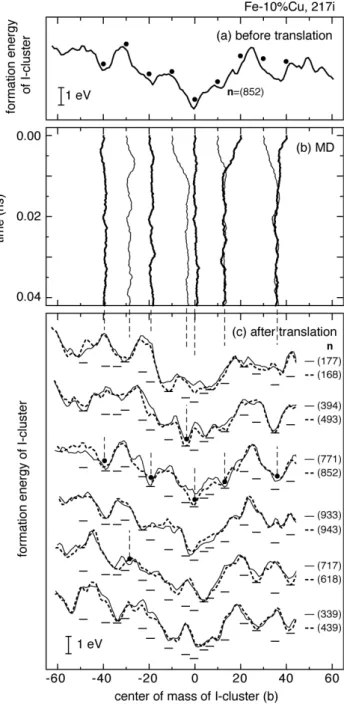
Next we examined the behavior of interstitial clusters at unstable positions. The cluster 217i in Fe-10%Cu shown in Figure 5(a) was translated abruptly along the glide direction during the MD simulation at 3 ns. In the practical operation, the solute distribution was translated by switching parameters representing the atomic species while changing neither those for coordinates nor those for velocities. The symbols in Figure 6(a) show the cluster position in the formation energy profile immediately after the translation. Figure 6(b) shows the subsequent trajectories of the translated clusters. All clusters migrated along the gradient of the formation energy and became stationary within 0.02 ns. These results indicate that interstitial clusters have mobility that is sufficiently large to be treated using the MD method when they migrate to a lower formation energy. Figure 6(c) portrays the stationary cluster positions in the six
translated by -10b and -30b also changed the cluster plane. All clusters were stationary at the position with a local minimum in the respective formation energy profile, but they were not always in the lowest energy state around the respective positions indicated by short horizontal bars. Potential barriers exist for changing the cluster plane. During the normal MD simulation of 217i at 300 K for 5 ns shown in Figure 5(a), we observed a plane change only once: that in the case of Fe-10%Cu around 1.5 ns.
Figure 6(c) depicts variants of the formation energy profile of an interstitial cluster lying on different planes, having a common Burgers vector, and being
accommodated in solute atoms with a common distribution. The profiles differ further among the variants with increasing angle between the plane normal vectors. The variation was understood by the model of the formation energy of interstitial clusters [16]. The formation energy is given by superposition of the interaction energy between the cluster and individual solute atoms. The interaction energy is large for the solute atom in the core of the dislocation loop. It decreases monotonically with increasing distance from the core. A set of atoms incorporated into the dislocation core of a cluster depends on the plane normal vector as well as the cluster position. The formation energy is expected to show smooth variation with a change in the plane normal vector and the cluster position.
4. Discussion
4.1. Comparison of 1D migration frequency with HVEM experiments
The frequency of experimental 1D migration is proportional to the electron beam intensity at low temperatures in the materials we examined: iron [14] and SUS316L including its model alloys [8]. If we assume linearity also to other alloys, then the frequency is expressed as 4.5, 20, 0.4, 0.9, and 0.6 migrations dpa-1
for V-5%Ti,
Fe-9%Cr, Fe-0.9%Cu, A533B, and SUS316L, respectively [4–8]. The frequency shows wide variation depending on the alloys. The absolute value of the frequency is expected to depend also on the definition of a single 1D migration event in the measurement, especially for short 1D migration and fine scale vibration. To compare 1D migration frequency between the present MD simulations and HVEM experiments, we sought to extrapolate the MD results into the HVEM condition for Fe-0.9%Cu irradiated with 1250 kV electrons at a damage rate of 10-2
dpa s-1
at 300 K [6].
attributable to the impact with incident electrons and the subsequent atomic collisions. We used MD for a calculation cell comprising 48,000 iron atoms (no solute atom) with an interatomic potential by Ackland et al. [24]. We produced a primary knock-on atom with kinetic energy of 10–100 eV at 300 K. Then we traced the atomic collisions. After the kinetic energy dissipated, we quenched the cell, relaxed the atoms to the equilibrium position using MS, and counted the Frenkel pairs and the atoms that were displaced from the original lattice site. Figure 7(b) shows the averages obtained from 1000 trials for each recoil energy. The estimation yielded about seven displaced atoms associated with a production of a Frenkel pair for the primary recoil energy spectrum for 1250 kV electrons shown in Figure 7(a). Figure 7(c) shows the displacement length of atoms. The majority were 0.4b – 1.2b, suggesting that displaced atoms replaced one of their first-nearest or second-nearest neighbor atoms, or became interstitials near the original site. To correlate the efficiency of interatomic mixing between the atomic collision and the exchange of atoms (i.e., the procedure in Sec 3.1), we assumed that production of two displaced atoms in the collision was equivalent to an exchange of a first-nearest pair of atoms. Both cases displace two atoms, but the assumption ignored, for simplicity, a possible difference in the mixing efficiency between replacements and exchanges.
Then the impact with 1250 kV electrons was equivalent to 3.5 epa dpa-1
. Applying the MD results in Sec 3.1 (i.e., 0.5 migrations epa-1
), the frequency of 1D migration induced
by the atomic collision was found to be 1.8 migrations dpa-1
. We ignored solute copper atoms in the atomic collision because copper and chromium atoms in iron matrix have no considerable effect on the number of Frenkel pairs produced or the damage zone size in cascade damage simulations [25,26].
Next we examined the frequency of 1D migration induced by thermal migration of radiation-induced point defects through another interatomic mixing. The mixing
efficiency was estimated based on the simple assumption that the migration of a point defect induces a chain of atomic replacements along its random walk trajectory. The numbers of replacements per atom during a unit time attributable to migration of interstitials and vacancies are, respectively, MICI and MVCV, where M stands for
the mobility (the average jump frequency) and C represents the point defect
concentration. Subscripts I and V denote interstitials and vacancies. Again we assumed roughly that two replacements in the chain were equivalent to one exchange. The interatomic mixing attributable to migration of interstitials and vacancies is
equivalent to 1
2MICI and 1
2MVCV epa s
-1
. According to a simple reaction rate
analysis of point defects under electron irradiation, the concentrations of interstitials and vacancies reach the steady state soon after the start of electron irradiation at high
temperatures where vacancies are thermally mobile [27] as
MICI = MVCV= PM
(
V ZIV)
1 2, (2)
where
!
P signifies the damage rate (i.e., production rate of point defects), and where
ZIV stands for the number of reaction sites for mutual recombination between
interstitials and vacancies. The total mixing is PM
(
V ZIV)
1 2epa s-1
in the steady state.
The vacancy mobility MV in iron was 3 × 10⁴
s-1
at 300 K, adopting 0.57 eV for the
vacancy migration energy [28, 29] and 1013
s-1
for the frequency of lattice vibration.
Applying appropriate values for the other parameters, P =10-2
s-1
and ZIV=102
, we obtained 52 epa dpa-1
as the exchange rate. For Fe-Cu alloy, we used the effective mobility of vacancies MVeff = MV 1 1! zcS
(
)
+ zcSexp E(
b kT)
, (3)where z stands for the number of trap sites around a solute atom, and Eb denotes the binding energy between a solute atom and a vacancy. The binding energy is 0.087 eV at the first nearest distance in the Fe-Cu potential [18]. The exchange rate was reduced to 29 epa dpa-1
in Fe-0.9%Cu ( cs=9 × 10 -3
and z =8). Applying 0.5 migrations epa-1
again, the frequency of 1D migration induced by point defect migration was 15 migrations dpa-1
at a damage rate of 10-2
dpa s-1
. We note that the frequency of 1D migration induced by point defect migration is proportional to P1 2 in the present model. The estimation ignored a reduction in the point defect concentrations around the interstitial cluster itself, which acts as a sink for point defects.
Finally, we estimated the frequency of 1D migration induced by the cluster size change. Interstitial clusters tend to grow under electron irradiation by absorbing
For example, the cluster radius increases linearly with the irradiation time at a damage rate of 6 × 10⁻³
b s-1
in Fe-10%Cr under irradiation with 1000 kV electrons at a damage rate of 10-3
dpa s-1
at room temperature [30]. In Fe-0.9%Cu irradiated with 1250 kV electrons at 10-2
dpa s-1
, the average size of interstitial clusters that caused 1D migration is around 4 nm [6]. The rate of the radius change was 2 × 10⁻¹
b s-1 if we assume that the clusters had grown to the size by irradiation for 40 s. Applying the MD results in Sec 3.2 (i.e., 0.5 migrations b-1
), the 1D migration frequency expected from the experimental growth rate was 0.1 migrations s-1
: 10 migrations dpa-1
at a damage rate of 10-2
dpa s-1
. Because the growth rate of interstitial clusters is generally proportional to P1 2
at vacancy-mobile high temperatures [27, 31], the frequency of 1D migration induced by cluster growth is expected to be proportional to P1 2
.
The frequency of 1D migration induced by the atomic collision, point defect
migration, and cluster size change were estimated as 1.8, 15, and 10 migrations dpa-1
, respectively, at the damage rate of 10-2
dpa s-1
. They were from several to several tens of
times the experimental frequency of 0.4 migrations dpa-1
in Fe-0.9%Cu. The discrepancy in the frequency derives partly from the rough estimation in the extrapolation of the MD results into the HVEM condition. Another origin of the discrepancy might be radiation-induced segregation of solute/impurity atoms into interstitial clusters in HVEM experiments. It has been suggested that the segregation pins down the interstitial clusters under irradiation at higher temperatures at which vacancies are highly mobile [5, 7]. The segregation might affect the frequency even around room temperature, depending on the alloys. Finally, it is worthwhile to repeat that the experimental 1D migration frequency is proportional to the electron beam intensity in iron [14] and SUS316L including its model alloys [8]. The damage rate dependence of experimental 1D migration frequency is consistent with the proposed model for atomic collision, but not for point defect migration or the cluster size change.
4.2. Distance of 1D migration
In the present MD simulations for Fe-Cu alloys, the fraction of 1D migration decreased monotonically with increasing distance; and the distance ranged up to several nanometers. The distribution of 1D migration distance showed no strong dependence on the solute concentration, the cluster radius, or the method of “shuffling” of solute atoms: interatomic mixing or cluster shrinkage. These results are consistent to the proposed
model in the following two respects: 1) the 1D migration distance reflects the wavelength of the fluctuating formation energy of interstitial clusters. 2) The
wavelength does not depend on the solute concentration or the cluster radius, but only on the interaction range between the loop dislocation and a solute atom in random binary alloys [16].
The distance of 1D migration in the HVEM experiment for Fe-0.9%Cu ranges up to around 10 nm [6], which is slightly longer than that in the present MD simulations. A considerable origin of the difference was discussed in the following section. The
experimental 1D migration distance has a common distribution among the alloys examined at low temperatures [4–8]. This is consistent with the interaction range between the dislocation loop and a solute atom in linear elastic theory: the range has no wide variation depending on the alloy [32]. We propose that the wavelength produces the characteristic length of 1D migration in concentrated alloys.
Slow 1D migration and fine scale vibration, in addition to stepwise 1D migration, were observed in the MD simulation. That fact does not contradict in-situ observations obtained using HVEM, where slow migration and fine scale vibration have been reported [4, 7, 8]. The latter was not counted as 1D migration events in SUS316L because of the difficulty of quantitative analysis in the experimental resolution in terms of both time and space [8].
4.3. Difference in timescale between MD simulation and HVEM experiment
The present MD simulations used extremely high rates for exchanges of atoms and the shrinkage of clusters because of a limitation in the timescale of MD methods. A typical exchange rate was 109
epa s-1
in the MD simulation. It was greater than 1010
times the HVEM conditions: 10-2
dpa s-1
. The rate of radius change was 1–2 nm ns-1
in
the MD simulation. It was over 109
times that observed under electron irradiation. However, the difference in the timescale is not expected to be fatal for the estimation of 1D migration frequency because interstitial clusters have large mobility as they migrate toward lower formation energy. This fact was supported by the results of the present MD simulations. For example, 1) interstitial clusters followed potential valleys through fast 1D migration under exchanges of atoms and the cluster shrinkage. Also, 2) the 1D migration frequency was proportional to the exchange rate at low and middle exchange rates.
On the other hand, the difference in the timescale was thought to affect the 1D migration distance. Figure 5 shows that an interstitial cluster 217i did not escape from a
shallow potential valley of 0.1 eV during the MD simulation up to several 10-9
s. For
in-situ experiments with a timescale around 100
s, however, interstitial clusters have some chance to escape from shallow valleys and be stable only in deep valleys. That would lead to longer 1D migration in the experimental timescale. For example, Figure 2 showed that the 1D migration distance was longer for the smallest cluster 7i than the other clusters under random exchange of atoms. This might be attributed to escape of the cluster from shallow valleys even in the MD timescale because of the small amplitude of the fluctuation for 7i: the average amplitude is proportional to rc1 2cs1 2
[16].
5. Conclusion
We proposed a mechanism for 1D migration of interstitial clusters in concentrated alloys that is driven by high-energy particle irradiation. Interstitial clusters are
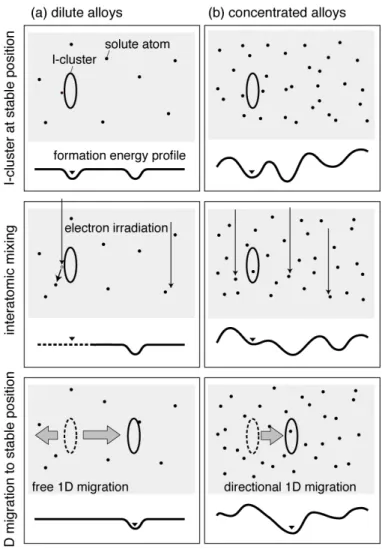
fundamentally mobile on their respective 1D migration tracks in concentrated alloys as well as in pure metals, but they are stationary at the position where the fluctuating formation energy achieves a local minimum. Irradiation successively alters the microscopic distribution of solute atoms from one random distribution to another, through atomic displacements and the subsequent recovery of produced point defects. The interatomic mixing changes the stable cluster position on the track, and causes the clusters’ 1D migration into a new stable position. The mechanism is presented
schematically in Figure 8 compared with that for dilute alloys and pure metals
containing impurities [14]. Moreover, growth and shrinkage of interstitial clusters under irradiation changes the microscopic distribution of solute atoms around the loop
dislocation itself, which results in 1D migration. Molecular dynamics simulations revealed the occurrence of stepwise 1D migration, slow 1D migration, and fine scale vibration of interstitial clusters in Fe-Cu alloys under exchanges of atoms or shrinkage
of the cluster. The 1D migration frequency was 0.5 migrations epa-1
under exchanges of atoms, and 0.5 migrations b-1
under the cluster radius change. The 1D migration distance ranged up to several nanometers. The frequency and distance of 1D migration were compared with those of the HVEM experiments for Fe-0.9%Cu at room temperature. The short-range 1D migration (< 10 nm) of interstitial clusters observed in various alloys under electron irradiation reflects the wavelength of the fluctuation of the
formation energy of interstitial clusters, which gives the characteristic length of 1D migration in concentrated alloys.
Acknowledgements
A part of this work was performed using the Center for Computational Materials Science, Institute for Materials Research, Tohoku University (Proposal No. 12S0408). This work was supported by a Grant-in-Aid for Scientific Research from the Ministry of Education, Culture, Sports, Science, and Technology of Japan (No. 21560868).
References
[1] A.J.E. Foreman, W.J. Phythian, C.A.English, Philos. Mag. A 66 (1992) pp.671-695. [2] B.N. Singh, C.H. Woo, A.J.E. Foreman, Mater. Sci. Forum 97-99 (1992) pp.75-96. [3] B.N. Singh, A.J.E. Foreman, Philos. Mag. A 66 (1992) pp.975-990.
[4] T. Hayashi, K. Fukumoto and H. Matsui, J. Nucl. Mater. 307-311 (2002) pp.993-997.
[5] K. Arakawa, M. Hatanaka, H. Mori and K.Ono, J. Nucl. Mater. 329-333 (2004) pp.1194-1198.
[6] T. Hamaoka, Y. Satoh and H. Matsui, J. Nucl. Mater. 433 (2013) pp.180-187. [7] T. Hamaoka, Y. Satoh and H. Matsui, J. Nucl. Mater. 399 (2010) pp.26-31. [8] Y. Satoh, H. Abe and S.W. Kim, Philos. Mag. 92 (2012) pp.1129-1148.
[9] J. Marian, B.D. Wirth, A. Caro, B. Sadigh, G.R. Odette, J.M. Perlado and T. Diaz de la Rubia, Phys. Rev. B 65 (2002) p.144102.
[10] D. Terentyev, L. Malerba and A.V. Barashev, Philos. Mag. Lett. 85 (2005) pp.587-594.
[11] D. Terentyev, M. Klimenkov and L. Malerba, J. Nucl. Mater. 393 (2009) pp.30-35. [12] D. Terentyev, P. Olsson and L. Malerba, J. Nucl. Mater. 386-388 (2009)
pp.140-142.
[13] S.L. Dudarev, P.M. Derlet and C.H. Woo, Nucl. Inst. Meth. Phys. Res. B 256 (2007) pp.253-259.
[14] Y. Satoh, H. Matsui and T. Hamaoka, Phys. Rev. B 77 (2008) p.094135.
[15] S.L. Dudarev, M.R. Gilbert, K. Arakawa, H. Mori, Z. Yao, M.L. Jenkins and P.M. Derlet, Phys. Rev. B 81 (2010) p.224107.
[17] G. Bonny, R.C. Pasianot, N. Castin and L. Malerba, Philos. Mag. 89 (2009) pp.3531-3546.
[18] G.J. Ackland, D.J. Bacon and A.F. Calder, T. Harry, Philos. Mag. 75 (1997) pp.713-732.
[19] M.W. Guinan, R.N. Stuart and R.J. Borg, Phys. Rev. B 15 (1977) pp.699-710. [20] N. Anento, A. Serra and Yu.N. Osetsky, Modelling Simul. Mater. Sci. Eng. 18
(2010) p. 025008.
[21] Yu.N. Osetskey, D.J. Bacon, A. Serra, B.N. Singh and S.I. Golubov, Philos. Mag. 83 (2003) pp.61-91.
[22] D.A. Terentyev, L. Malerba and M. Hou, Phys. Rev. B 75 (2007) p.104108. [23] A.C. Arokiam, A.V. Barashev, D.J. Bacon and Y.N. Osetsky, Philos. Mag. 87
(2007) pp.925-943.
[24] G.J. Ackland, M.I. Mendelev, D.J. Srolovitz, S. Han and A.V. Barashev, J. Phys.: Condens. Matter 16 (2004) pp.S2629–S2642.
[25] C.S. Becquart, C. Domain, J.C. van Duysen and J.M. Raulot, J. Nucl. Mater. 294 (2001) pp.274-287.
[26] K. Vörtler, C.C. Björkas, D. Terentyev and L. Malerba, J. Nucl. Mater. 382 (2008) pp.24-30.
[27] M. Kiritani, N. Yoshida, H. Takata and Y. Maehara, J. Phys. Soc. Japan 38 (1975) pp.1677-1686.
[28] T. Tabata, H. Fujita, H. Ishii, K. Igaki and M. Isshiki, Scr. Metall. 14 (1981) pp.1317-1321.
[29] S. Takaki, J. Fuss, H. Kugler, U. Dedek and H. Schultz, Radiation Effects 79 (1983) pp.87-122.
[30] N. Yoshida, A. Yamaguchi, T. Muroga, Y. Miyamoto and K. Kitajima, J. Nucl. Mater. 155-157 (1988) pp.1232-1236.
[31] T. Yoshiie, S. Kojima, Y. Satoh, N. Yoshida and M. Kiritani, J. Nucl. Mater. 133-134 (1985) pp.390-394.
Figure 1. Examples of trajectory of center of mass of interstitial clusters (217i) under random exchanges of first-nearest pair of atoms. (a) Fe-10%Cu at the exchange rate of 0.4 and 2 epa ns-1
. (b) Fe-1, 3, 10, and 30%Cu at 10 epa ns-1
. The thin line for Fe-10%Cu shows the case in which the exchanges were stopped after 1.6 ns. (c) Variation of the formation energy profile and the plane of the interstitial cluster in Fe-10%Cu shown in (b). Symbols show the cluster position; n denotes the cluster plane.
Figure 2. Frequency (a) and distance distribution (b)–(d) of 1D migration observed for an interstitial cluster 217i in Fe-10%Cu under random exchanges of atoms, as a function of the exchange rate. Variation of frequency (e) and distance distribution (f)–(h) of 1D migration with the cluster size and solute concentration at the exchange rate of 2 epa ns-1
. Diffusion coefficient of interstitial clusters was shown in (a) and (e). Error bars show the standard error.
Figure 3. Examples of trajectories of the center of mass of an interstitial cluster
shrinking from rc=8b (217i) to 1b (7i). (a) Fe-1, 3, and 30%Cu, and (b) Fe-10%Cu. (c)
Variation of the formation energy profile of the interstitial cluster shown in (b). Symbols show the cluster position; n denotes the cluster plane.
Figure 4. (a) Variation of the number of 1D migration events observed for interstitial cluster shrinking from 217i to 7i with the time and the solute concentration. (b)
Variation of the 1D migration frequency of interstitial clusters with time. The frequency was defined as the number of 1D migration events during the cluster radius change by b. (c) Distribution of 1D migration distances observed for interstitial clusters in Fe-Cu alloys under shrinkage.
Figure 5. (a) Trajectories of the center of mass of an interstitial cluster (217i) in Fe, Fe containing a single solute Cu atom, and Fe-Cu alloys at 300 K. (b) Formation energy profiles of the cluster at 1 ns in (a). Symbols show the cluster position; n denotes the cluster plane.
Figure 6. (a) Formation energy profile of the interstitial cluster (217i) in Fe-10%Cu before the translation. Symbols show the translated cluster positions. (b) Trajectories of the translated interstitial clusters in the MD simulation at 300 K. (c) Variation of
formation energy profiles of the interstitial clusters with cluster plane n. Symbols show the status of the stationary interstitial clusters. Horizontal bars show the lowest energy states among the six cluster planes.
Figure 7. (a) Primary recoil energy spectrum for iron irradiated with 1250 kV electrons. (b) Number of Frenkel pairs and displaced atoms produced by a single primary recoil atom, and their ratio as a function of the primary recoil energy. (c) Distribution of the displacement lengths of atoms as a function of the primary recoil energy.
Figure 8. Schematic illustration of the proposed model for 1D migration of interstitial clusters in (a) dilute alloys and (b) concentrated alloys induced by electron irradiation.