Cold Wave in East and Southeast Asia and Their
Effect on Atmospheric Circulation at Lower
Latitudes
著者
Nomura Chihiro
雑誌名
The science reports of the Tohoku University.
7th series, Geography
巻
50
号
1
ページ
59-74
発行年
2000-06
URL
http://hdl.handle.net/10097/45248
59
Cold Waves in East and Southeast Asia and Their Effect
on Atmospheric Circulation at Lower Latitudes
Chihiro NOMURA*
Abstract Cold waves in East and Southeast Asia based on the spatial pattern
of 850 hPa temperature anomalies and their effect on lower-level atmospheric
circulation at lower latitudes are examined in this paper. First, by applying
rotated principal components analysis to daily 98-station data in the area 100
—150°E , 0°-45°N, for 4 winters (1983/84-1986/87), five cold anomaly patterns
of 850 hPa temperature are extracted ; Type I (central China), Type II
(north-eastern China), Type III (Japan), Type IV (southern China), and Type V
(north-ern Japan). Secondly, the effect of these cold anomaly patterns and cold wave
events on cloud activity and lower-level atmospheric circulation at lower
latitudes is investigated. As a result, based on the moving direction of tropical
disturbance in the area near the equator, three kinds of lower-level atmospheric
condition at lower latitudes are regarded ; one usual eastward phase pattern
(EP pattern) and two unusual westward phase patterns (WP-N pattern and
WP-S pattern). The features are summarized as follows ;
WP-N pattern : In this pattern, cold waves have closest relation with
lower-level atmospheric condition at lower latitudes. Cross equatorial flow
derived from a part of cold wave flow in the Northern Hemisphere and
remark-able equatorial westerly appear near not only maritime continent but also the
Indian Sea, and these condition in latter site are associated with appearance of
easterly wave in the Bay of Bengal. These process leads to unusual westward
moving of tropical disturbance in the area near the equator.
WP-S pattern : Unusual westward moving of tropical disturbance in the
area near the equator in this pattern is due to appearance of a cyclonic
circulation in Southern Hemisphere.
EP pattern : The flow derived from a part of cold wave does not reach to
lower latitudes in this pattern.
In Particular, WP-N pattern appears to be accompanied with the
emer-gence of Type IV of cold anomaly patterns. Same tendency is somewhat
regarded in Type III.
Key words : cold wave, East Asia, Southeast Asia, rotated principal
nents analysis, midlatitude-tropical interaction
* Graduate Student, Institute of Geography, Tohoku University, Sendai 980-8578
Science Reports of Tohoku University, 7th Series (Geography) Vol. 50, No. 1, June, 2000, 59-74
1. Introduction
In most of studies on midlatitude-tropical interaction through Asian monsoon in
winter, the monsoonal character may be represented by seasonal or monthly mean
data (e.g., Tomita and Yasunari, 1996). However, in subtropical region over the
western Pacific, daily diabatic heating at the lowest atmospheric layer is balanced with
the horizontal temperature advection by heat loss of the ocean due to air-sea heat
exchange induced by cold wave flow (Kawamura, 1988). Therefore, cold waves that
occur in shorter term than a season or a month are remarkably associated with
midlatitude-tropical interaction.
In particular, cold waves reached to lower-latitudes have studied as "cold surges".
Chang and Lau (1980) showed the meridional process that occurrence of a cold surge
strengthened the local Hadley circulation and activated the near-equatorial
convec-tion, but details of its zonal process in Asia is not clarified. In various studies on cold
surges, its appearance (or onset) is defined by the local weather change at a specific key
location, and its temporal development has examined by composite analysis based on
its onset (e.g., Wu and Chang, 1995). But with these method, the spatial pattern of the
influence by the cold waves and various temporal continuance of the cold waves can
not be clarified.
In this study, cold waves are analyzed by daily temperature anomalies at 850 hPa
that are standardized in each station. With this method, cold waves at
lower-lati-tudes where daily temperature change is comparatively small can be clarify . By
applying rotated principal components analysis to these temperature anomalies, cold
waves are investigated from the spatial aspect as cold anomaly patterns and from the
temporal aspect with time series of component score. Nomura (1999) examined the
classification of cold waves in East and Southeast Asia based on these spatial pattern
of 850 hPa temperature anomalies and their relation to cloud activity at lower
lati-tudes. The present paper is a further study that the effect on disterbance near the
equator and on lower-level atmospheric circulation at lower latitude by appearance of
their cold anomaly patterns or cold waves is investigated.
2. Data and method
2.1. Data
The calculation of temperature anomalies were carried out by use of the sounding
data (SD tape) from Japan Meteorological Agency. The reason for using this data in
this study was to extract cold anomaly patterns by observation data.
To investigate the activity of disturbance near the equator , time-longitude
Cold Waves in East and Southeast Asia and Their Effect on Atmospheric Circulation at Lower Latitudes 61
was utilized. The original of this data is "Monthly Retort on Climate System,
Technical Note No. 32", pubrished by the Japan Meteorological Agency.
In the study of lower-level atmospheric circulation, wind at 1,000 hPa is
investigat-ed by using NCEP/NCAR (National Centers for Environmental Prediction/National
Center for Atmospheric Research) global reanalysis data (5-day mean), cloud activity
is examined by using 5-day mean OLR data.
The period that is examined in this study is from 1983/84 to 1986/87 (4 winters : from November to March (missing data : March 1987)).
2.2. Method
To extract cold anomaly patterns, temperature at 850 hPa was used. Since it is
impossible to remove the influence of the difference between each station and this level
was identified as the level of maximum horizontal heat flux in the East Asian region
by Blackmon et al. (1977), therefore temperature at 850 hPa is best to represent
depression of temperature by cold waves.
Analysis of temperature anomalies was performed to the daily data (at 00 GMT),
because the days before and after the onset of cold surges have been investigated by
using daily data in most of the previous studies (e.g. Wu and Chan, 1995). But 5-day
running mean data is used for making the influence of synoptic disturbances like
travelling anticyclones or cyclones at midlatitudes small.
Daily temperature anomaly from climatological value at 850 hPa was divided by
standard deviation at each station to normalize. For this calculation, climatological
mean temperature and standard deviation are necessary on each calendar day, but the
period of analysis is only 4 winters. In this study, average and standard deviation of
temperature at 850 hPa on each calendar day and its 15 days before and after during
4 winter (124 days in total) were substituted for 'climatological mean temperature and
standard deviation'. Using the data from November to March'), 'climatological mean
temperature and standard deviation' of the date from 16 November to 16 March were
calculated and therefore 467 distribution rnaps2) were made. The reason why this
process of normalization by these 'climatological mean temperature and standard
deviation' was applied in this study is that distribution of cold anomalies not affected
by the fluctuation of temperature in winters was tried to extract.
To investigate the cold anomalies at midlatitude and lower latitude in East and
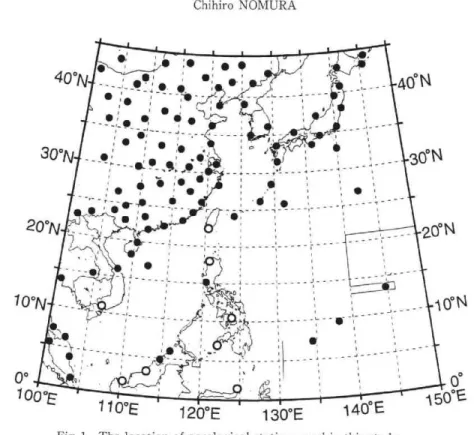
Southeast Asia, the analyzed region is 0°-45°N, 100-150°E (Fig. 1). On applying
princi-pal components analysis to extract the cold anomaly patterns, succeeding data is
needed. Therefore 98 stations (• in Fig. 1) where the missing data is below one third
of all analyzed day are adopted in this statistics analysis3). However, there are few
stations at lower-latitude near the Philippine. To Make the influence of these
4crN•4'1',:.;..
, fp' : •, -- --•.,. •,,•• I •
rr----11%,c,:r?-4
ti
•irOea: I •--) 1 • - - - -'-•_, ' • 7 • • ^ •3"
-- •i
-7 --0:-• _,Sili*:' .
1
•
• 1 :'• , • , •411: ..- ••___ 4 •,• ----—IIP-' •4Tr---•V
IL\
i>,,i
i,
20°N_,1.4,,Or • ---- - , - - 7 --- ' •qir
• , 10°N _ _ -l?
V-51.0
• •)1
al N I)/7
I • 1CF.4
1 _ - 40°N I I I 4,, 300 • I II I I II _ - _ 30°N 0° 0°N V • I I 0°N /00-E Fig. 1 • 0 , 1, 50 • / 10°E120°E 130°E140°EThe location of aerological stations used in this study Stations selected for rotated principal components analysis Stations compared with the results of the analysis
(1987) described that stable solutions could be obtained generally by the rotated
principal components analysis to large spatial degree of freedom compared with the
domain. This analysis have often been applied for the station data which are
dis-tributed unequally in the study area (e.g., Yasunari et al., 1996).
For applying the rotated principal components analysis in this study,
variance-covariance matrix was used. The five principal components were rotated by using the
varimax method. The number of components for rotation is decided according to the
maximum difference of each eigenvalue.
3. Spatial patterns of cold waves in East and Southeast Asia
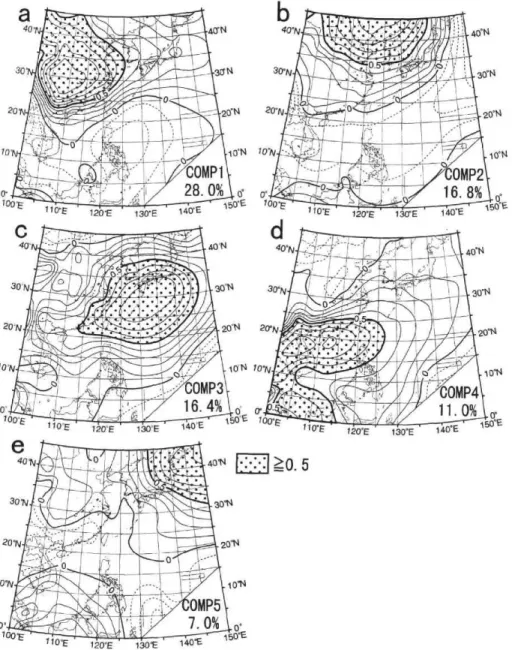
Fig. 2 shows the geographical distributions of factor loading of five components
and these percentage variances from rotated principal components analysis for the 850
hPa temperature anomaly. The cumulative percentage variance of the 5 components
is 79.1%.
Cold Waves in East and Southeast Asia and Their Effect on Atmospheric Circulation at Lower Latitudes 63
a
40 _°,1
,_•:;1,L
-
SOV 7
20.N 10J . . 401`1 3014 • J 100E407v.r)
30°N 4 4 1 20.N----4:
107V 0.d
401
Ig./• L._ 201 iO N - COMP1 28. 0% 0° 0. r.; 40°N Q • r • 30°N 11 CL,. (:17E 110•E 120°EC
40°N 130'E 140°E 30-N I 1 11 "II 2014 COMP2 16. 8% 10°N110°E 120°E 130°E 140°E 150'
40'N 20'N
a3
I. • 30Is) 30°NL
Fr'r4—ai
_ 4,-. orArN,. —,-...- •;'' .1' L ---' GOMP3 20°N 10'NEr:
A40°N
rrrqit;:S
;JW(41707
, . 107vi! 30°N 16. 4% 110°E 120E 140E 0-, 1.50 .V.:4 100° • /10°E ic 130Ee
4" 120°E 20°N• COMP4
14CE 130°E 4.cr 150° 30w 20°N 0 low ±-100 `E .• !_]6 .2.
• • 40t4 1.30°N 4_,"7OMP5
7.0% 201•1 7FH 10°N110°E • 120°E 130°E 140rE
Fig. 2 Geographical distributions of factor loading of five components derived from
rotated pricipal components analysis for the 850 hPa temperature anomaly in winter
(1983/84-1986/87)
solid line : -F, dashed line : — 4.0°, 150°m
first component (Fig. 2-a), in northeastern China on the second component (Fig. 2-b), over the south of Japan on the third component (Fig. 2-c), over the South China Sea on
the fourth component (Fig. 2-d), in northern Japan on the fifth component (Fig. 2-e).
The negative score of each anomaly pattern (the lst---5th components) represents
each cold anomaly pattern. Since dealing with cold waves in this study, these cold
anomaly patterns are examined. Incidentally, the positive score of each anomaly
pattern represents the condition that a cold wave does not occur on the continental
area or that an extratropical cyclones passes on the oceanic area, but this is not my
present concern.
Therefore, these cold anomaly patterns were named Type I (central China) for the
first component, Type II (northeastern China) for the second component, Type III
(Japan) for the third component, Type IV (south China) for the fourth component, Type V (northern Japan) for the fifth component.
4. Effect on low-level atmospheric circulation at lower latitudes by cold waves
4.1. Cloud activity near the equator in relation to these cold anomaly patterns
In this chapter, cloud activity near the equator in relation to these cold anomaly
patterns is examined. Fig. 3 shows the time series of component scores (Fig. 3-a, b, c,
d, e) and time-longitude sections of 5-day mean OLR averaged from 10°N to 10°S (Fig.
3-f). Fig. 3-g is explained in next chapter.
Atmosphere near the equator has the feature of the eastward-moving wave with
30-50-day oscillation (Madden and Julian, 1972). But the period that this
eastward-moving wave is not remarkable exists. In Fig. 3-f, tropical disturbance in the area
near the equator by OLR move eastward in 1984/85 winter and 1986/87 winter, on the
other hand, the eastward-moving of the tropical disturbance is not definite in 1983/84
winter and 1985/86 winter. To investigate the relation between the period that
eastward-moving of the tropical disturbance is not remarkable and a cold wave,
disterbances area near the South China Sea (100-120°E), where Chang et al. (1979)
studied cold surges and their effect, is examined in detail. In Fig. 3-f, rectangles with
solid lines and dashed lines indicate westward and weak westward phase of the
tropical disturbance in this region, respectively. From the relation between these
rectangles and each component scores, it is clarified that the appearance of Type IV
coincides with the westward phase of the tropical disturbance in the area near the
equator rather than the usual eastward phase. In addition to this, the minimum value
of the third components tends to precede the minimum value of the fourth components.
This means that tropical disturbance is likely to move westward when Type IV and
Cold Waves in East and Southeast Asia and Their Effect on Atmospheric Circulation at Lower Latitudes 1983/84 NOV DEC
f0
in in b, 'o
in
JAN FEB MAR 1984/85 NOV I II IIE T-- 7 DEC JAN FEB MAR 1985/86 NOV86E 80E 120E 150E 1
_ I I >
3
1.; 1 1 a 0T g
Case1 III IV <WP-N>I Case2
I —.IV <WP-N> -Case3 - —.11[- 'I Case4
V - T Case5 <WP-N> <WP-N> <EP>I
I —.11 <EP>Case6
- Case760E DOE 120E 150E 180 150W
DEC JAN FEB MAR 1986/87 NOV I I I I 1 1r_ •A^e •
I Casa
II—'IVITCase9
U —.11[ T Case10 1 --.1IIV <WP-S> <WP-N> <WP-N> <EP>ICasell
111--41V <WP-N> DECJAN
r_
FEB IF 7 - < ) _ _ cl-k. 1 1 .1 1I Casie12
Case13 - 1V 1---; 4-1COMP1 COMP2 COMP3 COMP4 COMP5 80E 90E 120E 150E 180 150W
Fig. 3 Time series of the lst-5th component scores for 850 hPa temperature an
winter and fluctuation of tropical disturbances
Rectangles with solid (dashed) line in westward (weak westward) pha
disturbance area from 100°E to 120°E.
a : the 1st component, b : the 2nd component, c : th 3rd component, d :
component, e : the 5th component, f : Time-longitude sections of 5-day nu
(Outgoing Longwave Radiation) averaged from 10°N to 10°S (hatch : below 2( (Original : Monthly Report on Climate System, Technica Note No. 32, publish,
Japan Meteorological Agency.), g : Cases of cold waves and their types
anomaly patterns and transition patterns
<WP-N>
<WP-N>
Time series of the lst-5th component scores for 850 hPa temperature anomaly in
dicate westward (weak westward) phase of the
e 3rd component, d : the 4th
sections of 5-day mean OLR 10°S (hatch : below 00 W/m2) l Note No. 32, published by the Ives and their types of cold
4.2. Case study on the effect of cold waves on low-level atmospheric circulation at lower latitudes
To clarify variation of tropical disturbance in the area near the equator associated
with cold waves, the case study on the effect of various cold waves on low-level
atmospheric circulation at lower latitudes is performed.
Cases of each cold wave are determined based on cold anomaly patterns. Since
NCEP/NCAR global reanalysis data for wind at 1,000 hPa and OLR data for cloud
activity are both 5-day mean value, a suitable cold anomaly pattern need to be
assigned to each pentad. Practically, for each day in the period of analysis, the
component that have maximum absolute value in 5 component scores is assigned. If
the component value is negative, temperature at 850 hPa on the day is identified as a
suitable cold anomaly pattern. The pentad that this component value below —1.0
with same component succeed for more than 4 days or that below — 1.5 for more than
3 days is assigned to its suitable cold anomaly pattern. Through these processes, 13
cases of cold waves that have successive cold anomaly patterns are extracted. For
each case of cold waves, tropical disturbance below 200 W/m2 of OLR and wind field
at 1,000 hPa are investigated.
As a result, based on the moving direction of tropical disturbance in the area near
the equator in Fig. 3-f, two kinds of lower-level atmospheric transition patterns at
lower latitudes are divided roughly ; one usual eastward phase pattern (EP pattern)
and another unusual westward phase patterns (WP pattern). In WP patterns, due to
the origin of the westward tropical disturbance, two kinds of patterns are further
subdivided ; one origin from the Northern Hemisphere (WP-N pattern) and another
origin from the Southern Hemisphere (WP-S pattern). Date on 13 cases of cold
waves, their transition patterns, and their composing cold anomaly patterns are given
in Fig. 3-g.
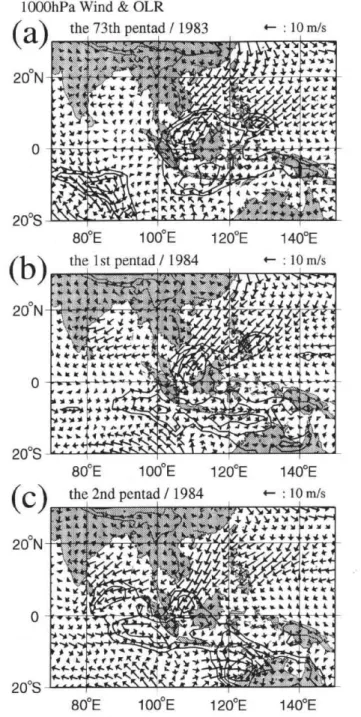
(1) WP-N pattern : Fig. 4 shows a typical case of WP-N patterns from the 73th
pentad in 1983 to the 2nd pentad in 1984. In Fig. 4-a, northeasterly by a cold wave
prevails over the South China Sea. Tropical disturbance exists mainly on the area of
10°N-10°S, 100-130°E. On the next pentad (Fig. 4-b), northeasterly over southern part
of the South China Sea further accelerates, a part of the northeasterly turns into cross
equatorial flow near 105°E (maritime continent) and intensifies equatorial westerly
from 0° to 10°S. Also near 125°E, Cross equatorial flow from the Northern Hemisphere
and strengthened equatorial westerly appears weakly. The other part of the
north-easterly passes over the Malayan Peninsula, and further strengthens easterly over the
Bay of Bengal. On the following pentad (Fig. 4-c), tropical disturbance emerges at the
remarkable easterly zone over the Bay of Bengal. This easterly zone further turn into
cross equatorial flow and equatorial westerly near 80°E over the Indian Sea, minimum
Cold Waves in East and Southeast Asia and Their Effect on Atmospheric Circulation at Lower Latitudes 67
(a)
1000hPa Wind & OLR
the 73th pentad / 1983 20°N 0 20°S t,ei, Pe 4 .4
4,\K
4,,e,c A,0 .,, A,494 *4 1, 11 A' )1 It 3/ 4— : 10 m/s 1/4 .4. 441..rk *11
4- ynr 4444444 1,-•411,4,4 4 r 4 N. 4 r 4 4-10 yrr rfrr /r1 AK Y1-4 0- r+1"C
3r)/ 4 .4,4. eelelebeti VA' e i v.. b. • I. 1.1b."*." 'AV* sbi 41/ KKK K W.JOZzis,*1 ^ CItra t tf ehew ie. e IC *" la la b. ,4 r 4 4 4,4 • --• 80°F 100°F the 1st pentad / 1984 120°F(b)
140°E 4— : 10111/S 20°N 0 20°S 10.44 *44,4 * •4, r.`I kkk 4 4- 4. it It j4•-770,:a_ .* 4 ^"*Ps% 20 44 4-4- + Ye ‘1, -te-ek,/41 ed 4. k"4--4-qr-4.--4- kkkkr*"*% •• • •4-4041;1
't
ep°
:ff44
4- it A A .1, * * 'Tr 9- * + + * • • 1 •••FO PE 4**-44...**Ki t... 14. 4. le he EIC t'ehe'1,7 7 he k- V,ete ^klk Vo • k ,1,v-Ir.4141 41,1, 111 ac 444 k • • 0. 40.1. t414
0;
80°E 100°E the 2nd pentad / 1984 4 a, 4,4 F(c)
120°E 20°N 0 20°S 140°E : 10 m/s 4.* fakAki<kne° 410014 No. rt
:
1\
74:10
••• 4.4f 1. • • • IL ve ^yyII '11011 `0".^C•1 49 •* 144. 43
^r + eie iikr4." ticket* le la • III, 4 9...srev.v.•^ ^4 v44-11V11 • 4 et.1,10 11f; 4-44• 4-4"4-4 k k 4 it 44 ^ * / • -• • 3 fryrritit f-f-f-I K.1‘ %ZS rs.'\ 11. IOC* i n4SI"*".4 1, 4A P. I. rr 480°F 100°E 120°E 140°E
Fig. 4 1,000 hPa wind and OLR in the case of WP-N pattern
1000hPa Wind & OLR
(a)
20°N
0
20°S
the 1 ith pentad / 1985 : 10 m/s
444 * k AKA
004'
q
741
#4.W4.-ArA eetetell4'"-tivig,'"
4,,A11,4,4 4 * 0-.0 t ' t I4*,_
...i. arA-lekei reek, s P, *, rev reek- 11 &reek",44;peeee
Jim' If ,.
' ,' 444r):CS;\
1 4 4, vie e he ~yyy444 V.%yl4e
k v.** St-rA vw49 4`,7404('A
4
A
tit
10- A/C.4 4 A -4 4.1k 4 4, 1. -A 0 4 4 r 21 ZAL CA"; 4r 1,0 * 4,(b)
80°E 20°N 100°E 0 20°S 120°E the 12th pentad / 1985 w, 4V
k
JI ' allw 4101,711
,10,";
* 4m4.10.,VH4* I 4, 114 x ge 4A 4), .., ,.. '... 4 b. •A t... A A A 1 4 4 KRKwwf 140°F 4— : 10 m/sX 411
4 44 I IL•44^ 4 ‘,41V 4 4 I r' A' 4 4' -•*".,, 'rI' irittc ,.* fJrhe It '44re4- 0-4- -; 4-4-4
4
4
4-
4-ef;441t
44,4 4 %.•4... !I ;LW 41.# AL, irRf. ff. * wwwwwaw 11,1•111' o4.0,AA A A 0, *Val • • -4 9 4 • 4444 f I KI 444 ALZO in k.- oc,t 4 * ' .4'1411,4 A AAAAN44 rrrkr „ir 11 •-A -A-A -0 4 4.30.4 4. *OA rr1 4-4-4- 4-4 11+. 4 1 4(c)
80°E 20°N 100°E the 13th pentad / 1985 0 120°E 44 4 ^4 4 .op 4^.q;
*A: II"1.. t' 4 V V'44 4 140°E zigr 4'V ,44, 544044 /1% Al 444,1, 4— : 10 mis 20°S ke 5,..*M41? ^ I 1 'I ) 4 f 4 f f rrr keer 4 L4.44. ***icier A. A. rr4U.NA 4^ ".../.4^A
A AAS
tt~i A AI 441,11A . .0 A, II L „Air At it tt K 04-416,4/0g Vitieem ieseWe ebeekel AI-4,34,11cg s4, 7'4 4.4 lk 444 4-420 44.-2--•-v •^ ^ 0 -0 r•Nik Aa. 14 4 4 +Wi 4 4 11 `A `A k_-11Ad 4, 80°F 1 00°E 120°E yf 10,41, 140°F Fig 5 1,000 hPa wind and OLR in the case of WP-S pattern
Cold Waves in East and Southeast Asia and Their Effect on Atmospheric Circulation at Lower Latitudes 69
disturbance tend to arise from appearance of equatorial westerly, the cause of this
remarkable westerly is to appear cross equatorial flow from the Northern Hemisphere
near not only maritime continent but also the Indian Sea. These processes seem to
lead to unusual westward moving of tropical disturbance in the area near the equator
in Fig. 3-f. According to Fig. 3-g, the latter period of cold waves with WP-N patterns tend to be type III or type IV of cold anomaly patterns.
(2) WP-S pattern : Fig. 5 shows the only case of WP-S pattern from the 11th
pentad to the 13th pentad in 1985. In Fig. 5-a, northeasterly associated with cold
waves predominates over the South China Sea. Cross equatorial flow exists near 80°
E, but it disappears on the next pentad (Fig. 5-b). Cross equatorial flow and
strength-ened equatorial westerly do not exist near 105°E or 125°E by this pentad. On the
following period (Fig. 5-c), a cyclonic circulation in the Southern Hemisphere centered
at 10°S, 95°E emerges suddenly, this leads to intention of equatorial westerly at 5°S.
Tropical disturbance also stretch to 90°E. Therefore, since abrupt development of
cyclonic circulation in the Southern Hemisphere occurs on the latter period of the cold
wave with this pattern, unusual westward moving of tropical disturbance in the area
near the equator also seems to appear in Fig. 3-f.
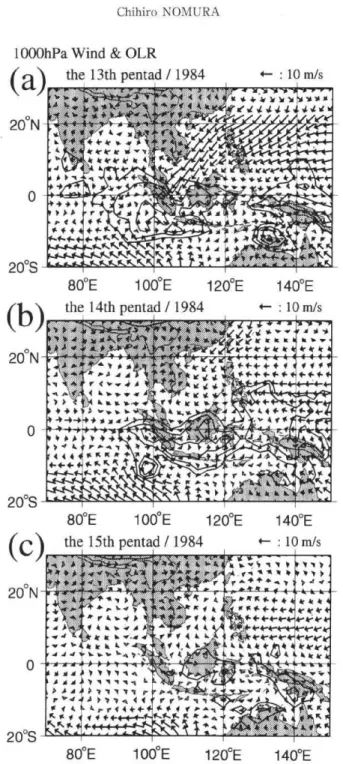
(3) EP pattern : Fig. 6 shows a typical case of 3 EP patterns, from the 13th pentad
to the 15th pentad in 1984. Northeasterly by a cold wave predominates over the South
China Sea in Fig. 6-a, but it weakens after the next pentad (Fig. 6-b, c). Cross
equatorial flow and strengthened equatorial westerly are not found. Tropical
distur-bance by OLR moves eastward as well as usual condition shown in Fig. 3-f.
There-fore the influence of cold wave on lower latitudes does not be seen in this pattern.
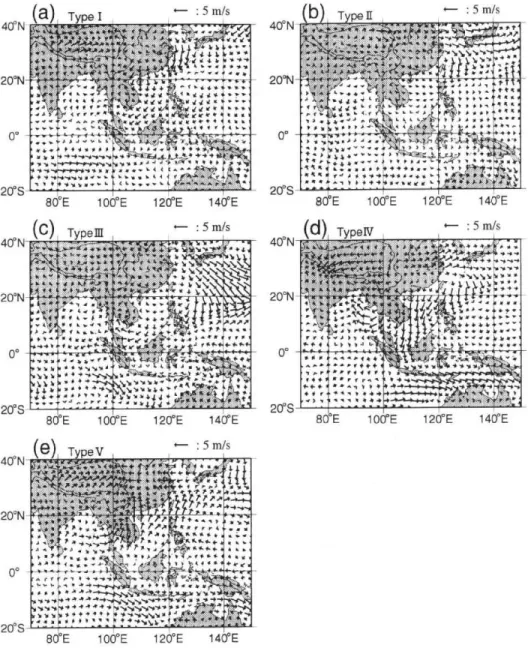
4.3. Characteristics of wind field at low-level atmosphere when each cold anomaly
pattern emerged
In the previous chapter, three kinds of lower-level atmospheric transition pattern
at lower latitudes are divided and emerging tendency of several cold anomaly patterns
in these transition patterns is regarded. In this chapter, composite 1,000 hPa wind
anomaly charts for each cold anomaly pattern are shown in Fig. 7, characteristics of
wind field at lower-level atmosphere when each cold anomaly pattern emerged is
confirmed as the summary of this study. Type I of cold anomaly pattern (Fig. 7-a) has
northerly wind anomaly over the East China Sea and northeasterly wind anomaly over
the South China Sea, Type II (Fig. 7-b) has westerly wind anomaly east of the East
China Sea. Flows of both types are influenced by cold waves, but cross equatorial flow
does not appear. In Type III (Fig. 7-c), on the contrary, strong northwesterly wind
anomaly by cold waves that reaches east of the Philipines exists, a part of this is
weakly connected with cross equatorial flow at 125°E. Northeasterly wind anomaly
1000hPa Wind & OLR
(a)
20°N 0 20°S the 13th pentad / 1984 4— : 10 m/s A IS*. Oak, 1p4*.0 41-74 4 a + 1r le it 444.4ekk 41V.14r,
• 4'; ^1 -0/41K;p44
414
kt .2 2 2 2 hert 4^;"
f I ) .• 141 044.. +1 r.< < 044 147/pifiCiri.V4..11(e
It
At
•
r
r NC
o 4. +4-C.-4 ^#•1,...K. 1--.4...K..C.N. 0 44,4W^Wq' 110 Wie'V'e +4 4. t tr± le& 4-41te /Vie* a A 4 • .4 .1Tit
(b)
80°E 20°N 0 100°E 20°S the 14th pentad / 1984 120°E 140°F 4— : 10 m/s *0 4 4**4 .,ski,b.4c 4 4 J0-0 A *4,4 4 .1 .4.4" ) ^ * -444 o 444 ^ 464 4 A • Al r 4 4 41,4-0-A.4.4 4I 42.2. *-4. 44\
0.1 ^ ^ 4 .0 .1 4 , • .4 f.. r..4. 4 f flICKR+710..
K.
N
1\
V L.../...AN% ...°1/41`....K..SINs.. l. * 4 4. 4. 1.4 ^Lot:„.12 keitrakk krir4r 4- is 4 +44-4 4 4 ' 440 • 21 11..• Ar 4 4 4-•k t 4-so Lk'. I it • F r ^`a Alt it, 4 i7Zr•(c)
80°E 100°E 20°N 0 20°S the 15th pentad / 1984 120°E*
WO! 44 • ,* a 14 • rr 444 140°F 4— : 10 m/s * r 4 k ^ 4 ic 4. .1,441 •k k ^6'4 'r•Z?4,4
or). le. 4r, 1* MA 14 41 .1 I • rvr 4 ^••i• • • • • • /1 A>vv-A 44 kpr4444-,F 44-4-4-4-4
t
I':
4.4
A.I 4 *;. 4 4r
44
46.
I 4,4 ‘ f 4 .. -•^4- -4 i, • ^ 041tf.4.4 k^k** In4 kk 104,40 4 pif-t44-4- • - G:4.. ,4\- 44 *2471 ear-:11fr,,,1 4" •• • ). 4 . k 4- *car rrr ,4Ack.5,41wi,47
r r " 1 4^I," PC or t •44-1, 4La1\1c:z
4.41 80°F 100°E 120°F 140°FFig. 6 1,000 hPa wind and OLR in the case of EP pattern
Cold Waves in East and Southeast Asia and Their Effect on Atmospheric Circulation at Lower Latitudes 71 •
(a)Type I
1-- :
5
m/sb
T pe
if
'— :
5
m/s
40°N5-'.11e4w,:,;:i„,:.;-••,v'.„,
P.-2,1,h.4„,,f,,..-,e40°Nrio2--;!ft.,0.-.-7—,-...!..,!:-„,-4-:.:
-1=7,,t,
'0-.'11,:
.4WkA41..,";,,'r-4".'44'1`.
:„,tr''S':.-.A1:Z.'4:',.:',,-!144.1011;01
...,,.
..„„
_.,,----iii
ilto,tr".6,Vii
A
A,
. 44
.4N..40.
^4.-1-"'S
±ii-'V10.'4',A,4
::*.•*4.,•7al'il"...",Y^'It!:::.4...o.Pk,,i,„,...•..„,,,,C1+It.-1,,,,o, 4-..A444.,,,,.._
°A4
1k
.WNW ,:44,,:pdp'-iftz:.-='
20°N/r
Will'1,4`.pisame'—••-...,,,mit..A.,.,,,,,10!,F,..,"
Ira::
:::20°NIr...,„ ,,
r40.4._,,,,,,.1!" .,•44,>
0.40',‘,",g•CV'....,,,(1(1,...4.,44,r.•4V *V..v.',tit
.0',,f/44,•p,....if,^.'`,.,,,,a'1,ENO.{ ',.. .4 4 4..,,,.., 4 . ,',A,•V *4 IA4.
''',4r".".'.sfiewit'"7ev.r. Mu.r C 4 V.IL. , ,Ai^ 44*^+•".
^
4.v,•^•^
p.1,Ittkieje
,:hif0
k r
1>
:4,;;..:^:.1:!t.1..!15.4'.:{1:4y,AA4.41'.:...a
v. 4 1. 4 . -..i ' ..-• q ,.., 1 . . Aff I 4+...
.,,,,,,.
, A
.1
v 4 , e qt,„„i
. 1146.4
"x-.A..1",=:IN
,,,
,,,, ,,,, A
A
A
a 4,‘
At:,
. w 4. ,,,,..k...m,
AlYIII
401,4-4,,,,, ••^ ...•Or...,.t4 r +a , .. .4, V .1 t ^ ^ Ili 4 v V. .., , ^ 4y
.A.41.
.41,4,
a•a.,4
4
i
gii"'I144.-aaall.*...4,-.111'
+
4--/.-4,1111
. . . '1.4
f.&f4.‘.
f4,1-
A0444 40A44. .•-+1 0 0 vu.a.,...- " ... ..., v 0144 •,,,,,, • - '
20°S 20°S
80°E 100°E 120°E 140°E 80.E 100°E 120°E 140°E
(c)TypeIa
4—
:
5 tri/s
•,
1(d)
TypeN4—:
5
m/s
40°N thli0004-•-*"lra;...41,"./t,40°NM•iffIM..„,,,,;,--I4
4,1,1;...,
la
,,.,.,1::,.:.11,...,., :;:kr-A:-.'q7;k4,.7*-7,1:::1,44,;J-47:.:
>...-•^„,.
It0.*tiptitAi,I.,
.L,44i.A4, 4 r.S.:"'i"vs.. , A
,[. A
,10,\,:)
*0-V.$''...-".-0.""A.#4,",a,t,.47.ir....-+„..,,...„.,:,,,..aa.,,,,.„„,...**1.11:v.a
4,...o.r,..::
t. &it
rrt..40;:3,
N,N,lt,•7:11:..,&
,*:agi-t1,,-i.,
20°N
"' 4Elk'8411114 Iv ALNk20°N
,'.:1,',114111:4b::..f
..4k..4ir•'''•'y
.r:7$
1'!0
T
.. ; " 0 ^ ^ ^ 4, . ,'' s• A, a ' ,.:-. 1 , , 7,... , t 4; .."Co..., eil A. , ',. , . a• ....4 : : : .. '0, ^ : : Z RA- hr4 a!, 1 I'414.,, • f r .444 • ^1r•-..4-4,.40 My •4,
I.,. ,4akca44,
k,,,,,-.4.4 (4)!7I
,,l'_1
f• 4-
0.."
r , 1 v.1,,
4404,.ixt..0^...••• I
fa
.
44 V farie y 4-0, .41;,rr ,...r,-....1,,..4.4. 4L.. V V,,,,i4^2.,:.."..4, 0° 0°4,
.4.4,,,,,,10
..!:.j,..yrd4V.„:411.tr4,40.,
*^:
::::::‘q'4Vrallignil
1,tr,: : :2;0'',;p,*...I....k.-:rtit.:teN.",In/^..,44fr,...0_ 1Ils'iNti ..4,,,,,.-..4-*.,,:iik...7--,...00,,,I.•
4,41,N4-^•••••••••-,004r,....„
•-0•vio.,00.4',V174.":4411,
,...:,,.,.,..
,!Y,
,7:r„„"4-4
.iti.0r
.., y ,4.4-4-0.-0-044 4-4,--4-4-0-044 20S4-4. 20S80°E 100°E 120rE 140°E 80°E 100°E 120°E 140°E
(e) T peV
4--
:
5
m/s
40°N cim54,404— ...4;,-„.4-;4 ' 41 - 11
F',4,WF t..= *ttr,Ag• 44 !,4-*-- ,tirr"' 4 i„....s1„,?^04`sOt.$ 01,./V.,* ** • ?. i.: r.;`,.1 ; ,,, ^" . • Jo, --.4,, 777,. „ 1 "" . . Art 447,..k.tiirisV • . inp.-.1:„
,. !I -P.p..,
, . ,
... l f . 4 . , . ..I , .,.. t • • - '", ,,,,, . k ^4 • i .4
,,,
IL'. r,•4 ypti
K.4414
4 x•
.0.0. 4 „,...,.1.1[ .„., • 'I 44.4 4,,0° .. i•
, " , 0
4
-04-^I't,,N
intr,1--
.,,‘„,71-cimi
— , .1.4 . , , 4 ..., -7. } + 4.3 ' •ariV, 7,....,...11*,.'„ , ,..,71."-m..1„,t . socv• 37,X24,- t .
. )10101. 10,,,,,,Nes. 4.
20°S .. . 41,,•,14 4 4,,,,
80°E 100°E 120°E 140°E
Fig 7 Composite 1,000 hPa wind anomaly chart for cold anomaly patterns
a . Type I, b : Type II, c . Type III, d . Type IV, e : Type V
easterly wind anomaly intensifies over the south part of the Malayan Peninsura, but
cross equatorial flow at 105°E is not clear. Concerning Type IV (Fig. 7-d), strong
northerly wind anomaly by cold waves prevails over the South China Sea, it forms
anomaly that zone from 5°S to 10°S. A part of flow near the South China Sea passes
over the Malayan Peninsula, and change into easterly or southeasterly wind anomaly
over the Bay of Bengal. These conditions seem to be associated with appearance of
easterly wave in the Bay of Bengal. Type V has only northerly wind anomaly east of
Japan, flow by cold wave is not seen over south of Japan, the East China Sea and the South China Sea.
From the results above, It may be concluded that appearance of Type IV of cold
anomaly patterns particularly give rise to connection between midlatitude and the
tropics in the wide range from the western Pacific to the Indian Sea, and same
tendency is somewhat regarded in Type III. This means that link between cold waves
and lower-level atmosphere at lower latitudes is not the simple meridional process that
strengthen local Hadley circulation shown by Chang and Lau (1980), has the zonal
structure that cause easterly wave in the Bay of Bengal.
5. Concluding remarks
Cold waves in East and Southeast Asia based on the spatial pattern of 850 hPa
temperature anomalies and their effect on lower-level atmospheric circulation at
lower latitudes are examined in this paper.
First, by applying rotated principal components analysis to daily 98-station data
in the area 100-150°E, 0°-45°N, for 4 winters (1983/84-1986/87), five cold anomaly
patterns of 850 hPa temperature are extracted ; Type I (central China), Type II
(north-eastern China), Type III (Japan), Type IV (southern China), and Type V (northern
Japan).
Secondly, cloud activity at lower latitudes in relation to these cold anomaly
patterns is examined. In particular, the appearance of Type IV coincides with the
westward phase of the tropical disturbance in the area near the equator rather than the
usual eastward phase. To clarify the effect of these cold anomaly patterns and cold
wave events on cloud activity, lower-level atmospheric circulations at lower latitudes
for 13 case of cold waves are investigated. As a result, based on the moving direction
of tropical disturbance in the area near the equator, three kinds of lower-level
atmospheric condition at lower latitudes are regarded one usual eastward phase
pattern (EP pattern) and two unusual westward phase patterns (WP-N pattern and
WP-S pattern). The features are summarized as follows ;
WP-N pattern : In this pattern, cold waves have most relation with lower-level
atmospheric circulation at lower latitudes. A part of the northeasterly turns into
cross equatorial flow near 105°E and 125°E and intensifies equatorial westerly from 0°
to 10°S. On the other hand, the other part of the northeasterly passes over the
Cold Waves in East and Southeast Asia and Their Effect on Atmospheric Circulation at Lower Latitudes 73
to cross equatorial flow and equatorial westerly near 80°E over the Indian Sea. These
process leads to unusual westward moving of tropical disturbance in the area near the
equator.
WP-S pattern : Unusual westward moving of tropical disturbance in the area near
the equator in this pattern is due to appearance of a cyclonic circulation in Southern
Hemisphere.
EP pattern : The flow derived from a part of cold wave does not reach to lower
latitudes in this pattern.
In Particular, WP-N pattern seems to be accompanied with the appearance of
Type IV of cold anomaly patterns. Same tendency is somewhat regarded in Type III.
These features is also confirmed by composite 1,000 hPa wind anomaly chart for cold
anomaly patterns.
Acknowledgements
I am indebted to Dr. R. Suzuki, Frontier Research System for Global Change, for
providing the SD data used in this study. Special thanks are due to Professor T.
Maruyama at Tokyo Gakugei University, for editing this SD data. I woud like to
express my gratitude to Dr. S. Miyazaki at Tsukuba University for critical reading of
the manuscript.
Notes
1) For the calculation of 'climatological mean temperature and standard deviation' from 16 February to 16 March, the data of March 1983 was substituted for the missing data of
March 1987.
2) In 1986/87 winter, distribution maps were made until 26 Feb 1987.
3) The average of each two days before and after the missing data was substituted for the missing data.
4) When applying rotated principal components analysis to the data, the fourth component that have the maximum area of factor loading at lower latitudes where observing station
is few was extracted. To confirm the reliability of the fourth component, 850 hPa
temperature of 8 observing stations at lower latitudes (a in Fig. 1) that have many missing
data and are not used for statistics analysis were compared with the score of the fourth
component. As a result, variations of both data tend to resemble each other. Therefore,
it is appropriate to deal with the fourth component as well as other components.
References (*in Japanese, **in Japanese with English abstract)
Barnston, A.G. and Livezey, R.E. (1987) : Classification, seasonality and persisternce of
frequency atmospheric circulation patterns. Mon. Wea. Rev., 115, 1083-1126.
the Northern Hemisphere wintertime circulation. J. Atmos. Sci., 34, 1040-1053. Chang, C.P., Erickson, J.E., and Law, K.M. (1979) : Northeastely cold surges and
rial disturbances over the winter MONEX during December 1974, Part 1 : Synoptic
aspects. Mon. Wea. Rev., 107, 812-829.
Chang, C.P. and Law, K.M. (1980) : Northeastely cold surges and near-equatorial disturbances
over the winter MONEX during December 1974, Part 2 : Planetary scale aspects. Mon.
Wea. Rev., 108, 298-312.
Japan Meteorological Agency (1989) : Monthly report on climate system : Technical Note No.
32.* Japan Meteorological Society. Tokyo.
Kawamura,R. (1988) : The interaction between winter monsoon activities in East Asia and sea
surface temperature variations over the western Pacific Ocean.** Geographical Review
of Japan, 61A, 469-484.
Madden, R.A. and Julian, P.R. (1972) : Description of global-scale circulation cells in the
tropics with a 40-50 day period. J. Atmos. Sci., 29, 1109-1123.
Nomura, C. (1999) : Classification of cold waves in East and Sontheast Asia and their relation
to cloud activity at lower latitudes.** Geographical Review of Japan, 72A, 808-828.
Tomita, T. and Yasunari, T. (1996) : Role of the northeast winter monsoon on the biennial
oscillation of the ENSO/monsoon system. J.Meteor. Soc. Japan, 74, 399-413.
Wu, M.C, and Chan, J.C.L. (1995) : Surface features of winter monsoon surges over south
China. Mon. Wea. Rev., 123, 662-680.
Yasunari, T., Nishimori, M. and Mito, T. (1998) : Trends and inter-decadal variations of the
surface and lower-tropospheric temperature in the Northern Hemisphere from 1964 to
93. J. Meteor. Soc. Japan, 76, 517-531.