Quantifying a Neighborhood in Transition : A
Spatial Analysis of Japantown, San Francisco
著者
ODA Takashi
journal or
publication title
The science reports of the Tohoku University.
7th series, Geography
volume
58
number
1/2
page range
1-26
year
2012-03
URL
http://hdl.handle.net/10097/60579
Quantifying a Neighborhood in Transition :
─ A Spatial Analysis of Japantown, San Francisco ─
Takashi ODA*
Abstract Most of the dozens of Japantowns that dotted America’s West Coast before World War II disappeared following the wartime internment of Japanese-
Amer-icans. Only three Japantowns remain in the continental United States today, including San Francisco’s Japantown. A series of sales of major Japanese properties to non-
Jap-anese investors at the beginning of the 21st century led to a significant reduction in size of those ethnic communities. The neighborhood’s transformation, particularly the development of what some people in the community call market-led “gentrification,”
has resulted in a community narrative that has advocated the need to preserve, revital-ize, and increase public participation in the planning of San Francisco’s Japan-town. Such community’s concerns about “gentrification” brought about the Save
Japantown campaigns, eventually leading to formal zoning and public planning
schemes. This article aims to quantify local knowledge of and anecdotes about the neighborhood, and to describe transitions the neighborhood has gone through, by using statistical data and housing and population statistics obtained using Geographic Infor-mation System (GIS). Additionally, the Japan-related businesses in the area are
dis-cussed, along with a historic overview given of preservation policies. A detailed understanding of the status quo of the neighborhood, and its surroundings, will help contribute to a wider discussion on socioeconomic, political, and urban renewal within the greater community. Some useful comparisons to San Francisco’s Chinatown will also be made. This article also serves to clarify community concerns of those involved in the preservation and revitalization of Japantown, thereby providing further knowl-edge for future assessments in policymaking and public planning programs.
Key words : neighborhood transition, gentrification, public planning, U.S. Census, GIS, Japantown
* Assistant Professor, Ochanomizu University
c/o : Department of Geography, 2-1-1 Otsuka, Bunkyo, Tokyo 112-8610, JAPAN
1. Introduction
This study aims to analyze socioeconomic dynamisms behind an urban neighborhood’s change in San Francisco, California, U.S.A., using population, housing, and economic statis-tics. The focus of the study is derived from the transitions and recent state of ethnic neighbor-hoods in America’s urban areas. Ethnic neighborneighbor-hoods in the United States are frequently located in inner areas of old cities, and are often formed as a result of socioeconomic segrega-tion of immigrants and refugees (Knox, 1982, pp. 170-173). After the postindustrial urban
society of the late 1960s, reconfigurations of urban industries led to low-skilled laborers losing
employment opportunities. This resulted in inner city problems throughout many of Amer-ica’s urban centers. Urban blight, a series of riots, and the emergence of the Civil Rights movement generated national debates on issues pertaining to race, ethnicity, and class. Stud-ies on inner city ethnic minoritStud-ies and concentrations of poverty have been documented in the social sciences and public policy (e.g., Wilson, 1987 ; Dreier et al., 2004). A significant amount of research in geography has detailed the mechanisms that contribute to the rise of inner city problems, the formation of ethnic enclaves, and the impact on their respective residents. How-ever, there has been little focus on former ethnic enclaves that are decaying and facing the need of preservation and revitalization to maintain their ethnic character and economic viability, as observed in such historical ethnic neighborhoods as the more than century old Japantowns throughout California.
San Francisco’s Japantown is an ethnic enclave formed by Japanese immigrant pioneers in the early 1900s. As with other ethnic neighborhoods in the U.S., Japantown went through dif-ferent transitional phases over the years while reflecting the socio-economic and political
dynamics at local, regional, and international levels. The traditional Japantowns in the U.S. that remain─ such as those in San Francisco and San Jose, as well as Little Tokyo in Los Angeles ─ have gone through a period of initial ethnic clusters playing a defensive role (Knox, 1982, p. 172) to protect them from charter group discriminations. The Japantown community then went through a phase of exclusion and eviction during World War II, when Japanese-Americans
were forcibly removed to internment camps (Kawaguchi and Seigel, 2000 ; Graves, D. and Page & Turnbull, Inc., 2009).
The Japantown community went through a period of rebuilding and redevelopment after the war, followed by an influx of postwar Japanese residents (Shin-Issei) and Japanese business
investors. The redevelopment changed the built environment in these ethnic enclaves, and the postwar redevelopment process led Sansei, third-generation Japanese Americans, to
mobi-lize to protect their immigrant community from external capital investors, as described in Lai (2001) and Sugiura (2007).
Since the turn of the century, Japantowns have faced increasing pressures. As waves of “gentrification” occurred, members of the community sensed the need to internally reorganize and transform their neighborhoods. Previous academic studies conducted by geographers in
Japan have examined the sociopolitical dynamisms and actors involved in the transactions of Japantown properties. Sugiura and Oda (2009) examined and interpreted the struggles over place in Japantown, taking the sales of major Japanese-owned property to non-Japanese
inves-tors as an example. Based on local newspaper coverage and a field study, it shed light on the conflicting values between economic revitalization and cultural preservation while examining the conflicts between different actors in the urban process.
Oda (2010) discussed a more recent Save Japantown campaign that surged in early 2006 in San Francisco when the then largest owner of Japantown properties announced its intention to sell its properties. The campaign resulted in a formal zoning regulatory scheme being intro-duced (Japantown Special Use District legislation, 2006) as well as the implementation of a par-ticipatory public planning process (Japantown Better Neighborhood Plan, 2007-). In this study,
Oda pointed out that this public planning process could be regarded as the formation of institu-tional grounds of neighborhood governance, where more citizens are involved in the decision
-making process of a particular neighborhood through a bottom-up approach to politics,
policy-making and public-private partnerships.
The 2009 and 2010 studies examining different aspects of the changes in Japantown referred to local fears of continuing neighborhood change and “gentrification” that were expressed in the narratives and anecdotes of the political campaigns that arose in an effort to achieve some institutional frameworks including legal regulations on land use in Japan-town. Some of such transitions are visible and are reflected in building structures and in the opening and closing of businesses. Other factors are not perceptible, such as population and the social characteristics of residents, their ethnicity, and income. While the term “gentrifica-tion” was not necessarily used in the same way as it is in academic definitions, it is worth assessing and confirming anecdotes about and knowledge of neighborhood changes and transi-tions from the local community through presenting measurable data using a wide variety of sta-tistics.
With regards to neighborhood planning, an increasing number of programs have been pro-vided to assist public planning through participatory use of GIS (Murayama and Shibasaki, 2009), and interaction between specialists and ordinary people concerned about the commu-nity. It is essential for citizens to be provided with more knowledge about their neighborhood so that they can more effectively participate in decision-making about it ; in this way,
commu-nities are empowered (Coburn, 2005 ; Hagiwara, 2009). Furthermore, as pointed out by Fujime (2007) in his discussion on an approach to governance, geographers can play an increas-ing role in helpincreas-ing people in a community grasp the state of that community in a scientific and thus objective manner.
The study in this volume of Science Reports, therefore, constitutes an attempt to demon-strate the results of the spatial analysis of neighborhood change and “gentrification,” anchoring its arguments on statistical analysis. This research focuses on the visible, spatial indicators that drive neighborhood change in a transforming ethnic neighborhood. Specifically, this study
aims to discover statistically what led to social movements of preservation and revitalization such as the one in Japantown in 2006.
This study will not only contribute to further dialogue about neighborhood-scale urban
transitions in the context of wider socioeconomic and political shifts in urban geography, but will also provide further insights into policymaking, as well as clarifying community concerns through measurable data.
The rest of this paper is organized as follows. First, a brief overview of San Francisco and the Bay Area is given in the following section. In Section 3, an examination of a variety of indi-cators of neighborhood transition is made that includes : 3.1) the spatial socioeconomic charac-teristics of residents examined ; 3.2) change of Japanese-related business environment ; and
3.3) state of buildings within the neighborhoods and preservation schemes applied. These are all based on statistics with some spatial comparisons to a Chinatown neighborhood in the city. In section 4, a detailed discussion of the academic definitions of “gentrification” is given, and an analysis of the housing and demographic characteristics is provided in Table 2.
This study is based on the decennial census (U.S. Census, 2000) from the Bureau of the Census, U.S. Department of Commerce, statistical and spatial data provided by the San Fran-cisco Planning Department, survey data published by the San FranFran-cisco Office of the Japan External Trade Organization (JETRO), and other publicly available data. Data with spatial information were processed with ArcGIS Desktop Ver. 9.3.1. at the Institute of Geography, Tohoku University1, Sendai, Japan.
2. San Francisco and the Bay Area
Located in the northern part of the State of California, San Francisco is a consolidated city
-county that was incorporated in 1850. In 1852, it had only 36,154 residents but by 1870 there were 149,473 residents recorded (Biller, 1993 ; Census Bureau, 1870). San Francisco went through at least three distinct periods of development and redevelopment. The first started in the late 1840s, when the “instant city” emerged as a result of the influx of migrants triggered by the 1849 California Gold Rush, and ended with the 1906 Great Earthquake1, which caused
tre-mendous damage that the city then had to recover from. The second period of development occurred with a phase of rebuilding and transformation before and after World War II. During the third stage of development in the 1960s, many high-rise buildings were constructed
down-town, making San Francisco a World City and window to the Asia Pacific with the establishment of corporate headquarters of organizations such as Chevron and Bank of America (Godfrey, 1997, pp. 315-319). Postwar redevelopment led to the obliteration of neighborhoods
desig-nated by the San Francisco Redevelopment Agency (SFRA) during the 1950s and 1960s. Dur-ing the 1970s and 1980s, the anti-high rise movement came into effect and strict growth-
con-trol regulations were implemented in San Francisco. The city adopted a Downtown Plan in 1984, and placed further restrictions on downtown development in the following years,
includ-ing Proposition M in 1986 (Godfrey, 1997 ; Hartman, 2002). Environmental activists in the San Francisco Bay Area organized these political campaigns.
Labeled the “Left Coast City” (DeLeon, 1992), San Francisco is known as a center of Amer-ican liberal activism that later spread elsewhere. The anti-war, civil rights, free speech,
redress for Japanese-American internment, environmentalism, and same-sex marriage
move-ments have strong associations with this city.
The City and County of San Francisco is part of the wider San Francisco Bay Area, consist-ing of Alameda, Contra Costa, Santa Clara, San Mateo, Sonoma, Solano, Napa, and Marin Coun-ties (Figure 1). The metropolitan San Francisco Bay Area population totals approximately seven million. The so-called “Silicon Valley” areas in Santa Clara and San Mateo counties
have boomed with the growth of information technology industry headquarters such as Apple, Google, Hewlett Packard, and Yahoo !.
To accommodate the highly paid young professionals working in the Silicon Valley, the con-struction of luxury condominiums increased from the 1990s onward (discussed in 3.3). San
Figure 2 Japantown, Chinatown, and redevelopment areas in San Francisco
Photo 1 On-going Mission Bay redevelopment Photograph by Takashi Oda, in October 2008
Francisco’s South of Market (SOMA) and Mission Bay are currently areas where there are many redevelopment projects (Figure 2). The Mission Bay project was accelerated by the ini-tiatives of local authorities that accommodated new development of the University of California San Francisco (UCSF)2 campus (Hartman, 2002, pp. 189-190). The nation’s top medical
insti-tutes are located in the Mission Bay now, and this has attracted retail and housing projects as well as a concentration of related medical and biotechnology industries (Photo 1).
3. Characteristics of and transitions in Japantown’s Neighborhoods 3.1. Residential composition of Japantown and Chinatown
This section presents the results of analyses of San Francisco’s East Asian residential pop-ulations, with particular emphasis on the city’s Japanese, Chinese, and Korean populations. We will discuss Japantown in terms of its residential population, and compare it with the Chinatown community in San Francisco in order to obtain a current picture of ethnic neighborhoods in tran-sition and to present differences in the size and ethnic compotran-sitions of neighborhoods.
According to the U.S. Census (2000), San Francisco has a diverse population of 776,773 persons, more than half of whom are non-white. The 2006 American Community Survey
esti-mated that Asians comprise 31% of San Francisco’s population. San Francisco has long served as a major host city and port of entry for East Asian immigrants to the U.S. Beginning at around the turn of the 20th century, Chinese and Japanese immigrants mainly resettled in ethnic
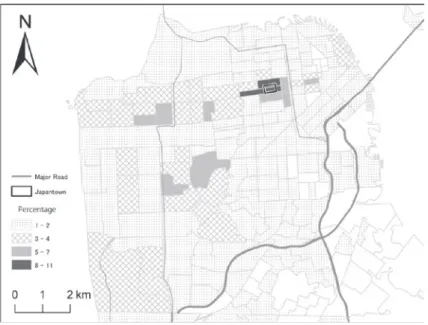
Figure 3 Percentage of Japanese residents in San Francisco by census tract 2000 Source : U.S. Census, 2000
enclaves in the city.
Figure 3 shows the percentage of Japanese residents by census tracts in the U.S. Census of 2000. It suggests a relatively higher concentration of Japanese residents in and around the Japantown area. The highest occupancy rate is approximately 11% compared to the rest of San Francisco. However, western residential areas such as the Richmond district (north of Golden Gate Park) and Sunset district (south of the Park) contain 5% or more Japanese (see Figure 2 for locations).
San Francisco’s Japantown began to grow in 1906, after the great earthquake hit the city. Many Japanese immigrants moved to the Western Addition district and built a vibrant ethnic community throughout the 1920s and 1930s. However, after the attack on Pearl Har-bor, President Franklin D. Roosevelt issued Executive Order 9066 on February 19th, 1942 which
led to the forcible removal of all “enemy aliens” from coastal areas, including Japanese nationals and the Japanese-American populations from Japantown, who were relocated to internment
camps across the country. This led to the decline of the Japanese population in San Francisco’s Japantown. After the War, some of the residents came back and rebuilt the community, and Japantown flourished during the late 1940s. The federal redevelopment program, however, targeted the Western Addition district for its “slum clearance” project. The San Francisco Redevelopment Agency designated A-1 and A-2 redevelopment project areas in and around
Japantown, as shown in Figure 2. This major postwar redevelopment ultimately resulted in the eviction of numerous residents and businesses from Japantown, and led to the construction of a new shopping mall called the Japan Trade Center, which was opened in 1968 by the Kin-tetsu Enterprise Company of America, a U.S. subsidiary of a major private railway company
Photo 2 Japan Center Mall and Peace Pagoda from Geary Blvd. Photograph by Takashi Oda, in June 2009
Photo 3 Cherry Blossoms Festival Ground Parade in Japantown Photograph by Takashi Oda, in April 2009
Photo 4 Chinatown commercial area Photograph by Takashi Oda, in July 2007
Photo 5 Firecrackers at Chinese New Year Celebration in Chinatown Photograph by Takashi Oda, in
headquartered in Osaka, Japan, as a showcase of Japanese high economic growth (Sugiura and Oda, 2009 ; Oda, 2010). The Japan Trade Center, later renamed as Japan Center Mall (Photo 2), and surrounding businesses, including two hotels and a bowling alley, initially flour-ished, attracting many tourists. The neighborhood economy, however, has declined over the past two decades with the relocation of Japan-related businesses. Nevertheless, the
Japan-town Merchants Association and other business and community leaders still work together to hold street festivals (Photo 3) and other events to attract tourists, maintain economic vitality, and preserve the cultural heritage of the Japanese and Japanese-American community.
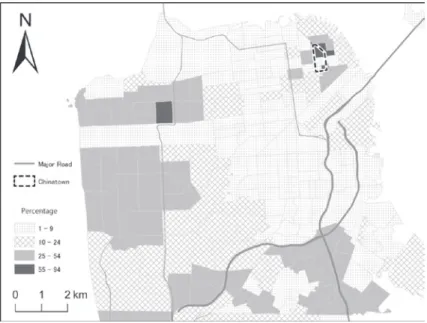
San Francisco’s Chinatown and the Chinese community have gone through a different tra-jectory of growth and development than Japantown, despite a similar history of immigra-tion. Figure 4 indicates the high concentration of residents of Chinese ethnicity in the China-town area located in the northeast part of the city ; some tracts have a more than 90% ethnic Chinese population while, as seen with the Japanese, the Chinese population is widely distrib-uted in the eastern residential districts, with much higher occupancy rates in these tracts than the Japanese. These new Chinatowns have been formed to serve newly arrived, highly edu-cated, and relatively wealthy immigrants from Taiwan and Hong Kong. This phenomenon of the creation of a new Chinatown, in addition to the traditional ones, is also found in other cities in the U.S., Canada, and Australia (Yamashita, 2005, p. 158).
The influx of those newcomer ethnic residents who migrate to these existing ethnic
neigh-Figure 4 Percentage of Chinese residents in San Francisco by census tract 2000 Source : U.S. Census, 2000
borhoods not only affects the neighborhood’s social characteristics, but also impacts the neigh-borhood’s economy. In public forums, many Japanese-Americans have pointed out the
decrease in Japanese residing in and around Japantown, while issues pertaining to the resettle-ment of low-income immigrants are often reported from the Chinatown community.
Figure 5 shows the change in the number of foreign-born persons from China, Japan and
Korea who obtained legal permanent resident status in the U.S. from 1850-19993. Figure 5
also shows how the changing numbers reflect historical state, national, and international socio-political events such as immigration acts, war-related immigrations, and the relocations of
par-ticular ethnic groups.
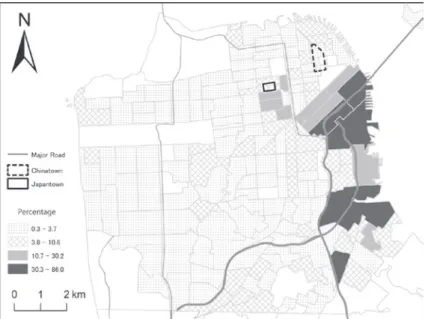
Figure 6 is a map of the percentage of foreign-born populations in the census tracts of
2000. It shows the high concentration of foreign-born residents in the Chinatown area, with
the maximum concentration ranging from 49% to 84%. Japantown has a relatively low concen-tration of foreign-born residents, but it is still higher than the affluent waterfront areas. Not
only does traditional Chinatown serve a wider international community as a tourist destination (Photo 4), but it still plays an active role as an enclave for first generation Chinese immigrant households. Their everyday dwellings can be glimpsed on side streets a few blocks from the tourist and business areas (Photo 5).
Table 1 summarizes the above residential figures of the ethnic groups4 in comparison to
other areas. It also provides figures of ethnic Korean populations that also have a high per-centage of residents in the Japantown area due to the growth of Korean businesses. For the
Figure 5 Persons originally from China, Japan and Korea who obtained permanent legal resident status in the U.S., 1820-2008
sake of this analysis, the same census tracts as Japantown’s are used for the Ethnic Neighbor-hood, since the presence of Korean residents and businesses is high and some Korean tourist guides call the area Korea Town. Although Chinese comprise only 1% of the entire U.S. pop-ulation, they comprise 20.6% of the population in San Francisco and 83.7% in the Chinatown area. The ethnic Japanese populations comprise 1.9% of San Francisco’s total population, and
Table 1 Occupancies of residents by ethnic groups, 2000
U.S. Total California San Francisco NeighborhoodS.F. Ethnic San MateoCounty Santa ClaraCounty MetropolitanBay Area Chinese 2,734,841 1,046,775 160,113 11,387 53,746 122,790 506,068 1.0% 3.1% 20.6% 83.7% 7.6% 7.3% 7.2% Japanese 1,148,932 394,896 14,618 806 13,003 35,124 106,427 0.4% 2.3% 1.9% 10.8% 1.8% 2.1% 1.5% Korean 1,228,427 375,571 8,706 435 5,374 23,670 65,218 0.4% 1.1% 1.1% 5.8% 0.8% 1.4% 0.9%
Total 281,421,906 33,871,648 776,733 see note* 707,161 1,682,585 7,039,362 *Note : S.F. Ethnic Neighborhood for Chinese refers here to Census Tract Nos. 107, 113, 114 and
118 that encompass Chinatown, San Francisco, and for Japanese and Korean, it refers to Census Tract Nos. 152 and 155, which encompass the Japantown area, which is sometimes referred to as Korea Town, San Francisco
Source : U.S. Census, 2000
Figure 6 Percentage of foreign-born residents in San Francisco by census tract 2000 Source : U.S. Census, 2000
10.8% of the Japantown area residents are Japanese. There are 14,618 Japanese in San Fran-cisco and 35,124 in Santa Clara County (a part of Silicon Valley), representing 2.1% of the total population. There were 435 Koreans living in the Japantown area in 2000 ; this shows the growing presence of Koreans in the neighborhood and reflects recent ethnic business trends in the community (Photo 6).
There are distinct differences in the sizes and compositions of Japantown and China-town. Japantown is much smaller in size, and the ethnic Japanese influx lacked ethnic residen-tial representation. Given this demography, the existence of Japanese businesses in the neigh-borhood may be a key contributor to maintaining the ethnic character of the neighneigh-borhood. We will look at the ethnic business trends in the neighborhood within the context of the region as a whole.
3.2. Business trends
The anecdotes and narratives from local people that were included in this study concern the transitions in business trends, particularly where Japanese-affiliated businesses are located in San
Francisco. After the redevelopment and arrival of major Japanese corporate offices as a show-case for Japan’s high economic growth in San Francisco, Japantown flourished during the 1970s and 80s. The presence of iconic Japanese firms such as Nissan and Sony lured other Japan
-related businesses and government offices. Years later, Japantown’s economy─ its very exis-tence─ has come to rely on the existence of such Japanese businesses.
Many Japanese firms and public agencies moved their Japantown offices back to Japan or to other locations in the early 1990s, as reported in community narratives and personal accounts
Photo 6 Korean businesses in Japan Center Mall Photograph by Takashi Oda, in June 2009
by residents. Statistics on Japanese-related companies, based on surveys conducted by
JETRO San Francisco in cooperation with the Japanese Chamber of Commerce of Northern California (JCCNC), are presented here. Figure 7 specifically shows the number of Japanese
-affiliated companies5 established in the Bay Area6 between 1966 and 2000. It can be seen that
the number of Japanese-affiliated firms gradually increased. The number doubled between
1986 and 1990, during the period when the U.S.-Japan trade friction of the 1980s reached its
height, and Japanese companies moved Japanese manufacturing centers to the U.S. to avoid fur-ther friction. Although the growth of Japanese business investments in the Bay Area gradually slowed due to the 1991 collapse of the bubble economy in Japan, the figure shows how there was a return to growth in the 1990s due to the rise of the information technology industry. The locations of Japanese-affiliated firms in five Bay Area counties are presented in Figure 8 (see
also Figure 1). The graph indicates the largest growth in Silicon Valley counties (such as Santa Clara and San Mateo Counties). In Santa Clara County, the number of Japanese-affiliated
busi-nesses doubled within ten years ; in San Mateo County, there was also an increase in Japanese
-affiliated firms. However, the number in San Francisco remained steady throughout the decade.
After the 1991 financial crash in Japan, a number of Japanese-related businesses closed and
left San Francisco’s Japantown. This resulted in the closure of showrooms of major Japanese manufacturers. Government offices also moved out of the neighborhood. The Consulate
-General of Japan was relocated to the financial district in 1988, and the JETRO San Francisco Center moved to the downtown area in 19937.
After the postwar redevelopment that evicted a number of Japanese-American residents
Figure 7 Number of Japanese-affiliated companies established in the Bay Area by year, 1966-2000 Note : The statistics includes data for Sacramento County in addition to the nine counties
mentioned in 2
and businesses, the Japantown community faced the reality that they were reliant on the exis-tence of Japanese corporate businesses and organizations as contributors to the economic sus-tainability of the central Japantown area. However, due to the fact that the Japanese economy was based on the other side of the Pacific, along with the reconfiguration of Japanese-affiliated
organizations in the Bay Area, the economic vitality the neighborhood had shown eventually started to wane. Internal neighborhood economic transitions, influenced by regional and inter-national trends, can be seen in these statistics.
Members of the community experienced furthering “gentrification” and witnessed the transitional process occurring in their community with the closure of businesses and arrival of new, non-Japanese businesses to Japantown. Their concern over the future of the century-old
community increased, later spurring them to take action to put preservation and revitalization planning programs in place.
3.3. The physically built environment and historic resource designations
Change and the rebuilding of physical building structures are often noticeable as indicators of neighborhood transitions and “gentrification” by residents, business owners, and community organizers. As San Francisco’s economy has been tied to the “tech boom” in nearby Silicon Valley, the developers sought investment opportunities that could accommodate highly paid professionals, including those commuting to high-tech business headquarters. Figure 9 shows
the number of new condominium units recorded by the San Francisco Department of Public
Figure 8 Number of Japanese-affiliated companies in major Bay Area counties, 1992-2002 Source : JETRO San Francisco (1992 ; 1994 ; 1996 ; 1998 ; 2000 ; 2002)
Works and reveals a significant increase between 1998 and 2007. San Francisco is a good mar-ket for investors and developers. The percentages of housing units built between 1990 and 2000 in the census tracts are described in Figure 10, with higher percentages around the Japan-town area (see also Figure 1).
The state of the physical building environment in Japantown and historic resource designa-tions, based on the spatial data up to 2005 provided by the Planning Department in 2009, will now be examined. The data contains the year that buildings were built and the status of his-toric resource designations by authorities. Figure 11 shows that the buildings in red were constructed before 1799 ; those in pink between 1800 and 1944 ; those in sky blue between 1945 and 1969 and those in dark blue between 1970 and 2005. In comparison to the buildings in the Japantown neighborhoods, it is clear that most of the buildings in Chinatown are old, while many Japantown buildings (except the ones that are churches and other “historic” build-ings that survived redevelopment) were postwar, and encompass the A-1 and A-2 Western
Addition redevelopment areas to the south.
While complex rules for building alterations and redevelopment often make it difficult for citizens, scholars, and even planning professionals to understand the overall state of historic preservation schemes, this study presents some of the major historic resource designations for protections on spatial distributions. The distributions of historic landmark sites and districts are shown on the same map. The dots in orange are the historic resource sites designated by Article 10 of the San Francisco Planning Code, set forth in 1967 by the City and County of San Francisco to protect designated historic resources from inappropriate alterations8. The
assess-ment of the historic resource and environassess-mental impact reviews are conducted by the standard set forth under the California Environmental Quality Act (CEQA). According to the CEQA, building structures built more than 50 years ago with architectural or historic significance may be considered a potential historic resource and may require an Environmental Impact Review
Figure 9 New condominiums recorded by Department of Public Works in San Francisco, 1998-2007 Source : San Francisco Planning Department (2008) ; reproduced from Oda (2010)
(EIR)9. Based on such standards, most Article 10 historic sites were built before World War II,
as seen on the map (Figure 11). Different rules for what constitutes a place with historic sig-nificance are applied by local, state, and federal jurisdictions, and careful application and review processes were conducted to make the designations (Cresswell and Hoskins, 200810). Some
areas have been designated by the National and California Register11 as historic places. These
are shown in light green on the same map. It can be seen that many buildings and districts with historic significance designations, in some cases if not all with development restrictions, are located in the south part of Chinatown and in the downtown area in the southeast. Some buildings within the Chinatown area have historic resource status, though not very many in Japantown. Such older properties with more than 50-year historic and architectural
signifi-cance can be listed as a historic resource and may be protected from “undue” alteration, demoli-tion, and redevelopment.
Because many traditional buildings were demolished postwar, Japantown (Photo 2) lacks the physical architectural “significance” recognized and protected by planning and building reg-ulations.
The community’s fear of market-oriented “gentrification” is due, in part, to the “lack of
protection” expressed in public hearings and forums. The community’s concern about change and its expectations that more loss of the area’s character would occur eventually compelled them to work with the Planning Department and Supervisor’s office to adopt a special zoning code to regulate the change of use in properties designated in the Japantown area (Japantown
Figure 10 Percentage of housing units built between 1990 and 2000 in San Francisco by census tract Source : U.S. Census, 2000
Special Use District legislation adopted on June 27, 2006) and an additional planning forum (Japantown Better Neighborhood Plan, 2007-) to discuss ways to preserve and revitalize the
Japantown community (Oda, 2010).
4. Gentrification re-examined
Earlier in this study, we attempted to gather, and then confirm, the Japantown community’s knowledge, narratives, and anecdotes about neighborhood transitions using a variety of quanti-tative and spatial data. As mentioned earlier, community organizers and business people often cite the term “gentrification” when referring to (the fear of) change and decline in ethnic neigh-borhoods and, therefore, in defending the argument that some measures need to be taken to preserve and revitalize what was once an immigrant neighborhood.
The term “gentrification” was coined by Ruth Glass in 1964, and has been mostly used to describe the residential aspect of the process of reinvestment of capital for a more affluent class of people than currently occupies an area. However, the definition of gentrification is itself evolving. Gentrification is essentially about urban reinvestment, a process that includes not only residential rehabilitation and redevelopment, but also now embraces commercial redevel-opment and loft conversions. It is often geographers that contribute to the growing amount of
Figure 11 Years in which buildings were built and designated historic sites and properties in San Francisco Source : Data up to 2005 obtained from San Francisco Planning Department in 2009
literature on gentrification (Johnston, 2000, pp. 294-295).
In reference to these disciplinary discussions on the changing definition of gentrification, we will examine the changes in the demographic and housing characteristics between 1990 and 2000 using the U.S. Census taken in both years, and again make a comparative analysis among Japantown, its neighbors, and Chinatown.
Table 2 summarizes the statistics on population, education, household income, rent, and units from the 1990 and 2000 census. These are divided by the areas in San Francisco in total, the census tract areas of central Japantown, its neighboring tracts in the north and south, as well as tracts encompassing the Chinatown area. The areas that have or have not been affected by postwar Western Addition redevelopment are described in the column “P.W.R.D.”. Among many suggestive characteristics of transitions, the median household rent in the southern neighborhood in Japantown (Tract No. 159) doubled between 1990 and 2000, while the central area of Japantown (No. 152) showed a 36% rise in rent. Newly developed condomini-ums and high-rise buildings seemed to have increased rent structures in the neighborhood
(Photo 7 ; Figure 10).
In the central area of Japantown, a condominium was developed on Webster Street at Post Street (Photo 8). The 1600 Webster housing development replaced a former Japanese bowling alley and was sold to a non-Japanese developer in 2000 after a series of protests aganst
demoli-tion from members of the Japanese American community (Sugiura and Oda, 2009). This can also be considered a new form of gentrification, in which a former commercial building, due to the economic downturn, is replaced with an affluent, residential project.
These new housing projects have brought affluent professionals to the area and the total population of the neighborhood increased during the decade. The number of residents with a higher level of education also increased. According to the 2000 figure in Table 2, in the north-ern neighboring census tracts (No. 135) and central Japantown (No. 152), approximately half to 60% of the total residents hold Bachelor degrees (or higher). New, highly educated wealthy professionals began moving to the neighborhood during these years. The level of income also increased, especially in the northern Japantown neighboring tracts.
On the other hand, according to the figures for the Chinatown area, the number of newly constructed housing units was smaller (see Figures 10 and 11) with a decline in the total pop-ulation. In addition, although these figures show an increase in educational attainment and household income in Chinatown, the increases are much smaller than those of Japantown. In the Chinatown tract (No. 107), 79% of the residents are ethnic Chinese, but there was no signif-icant change between 1990 and 2000 in the annual income. In comparison, the annual median household income in the northern neighborhood of Japantown was $78,215 in 2000. There is thus a huge economic gap between these two ethnic neighborhoods. The transitions in the Japantown neighborhood were identified with these comparisons of spatial statistics that recog-nize the changes of residential composition.
Table
2
Changes in the r
esidential and housing characteristics between 1990 and 2000
Ar ea Tract No.* P. W . R.D.** Total P opulation Educational A ttainment (P
ersons with Bachelor’s degr
ee or higher) 1990 2000 incr ease 1990 2000 incr ease All S.F . - - 723,959 776,733 6.8% 187,835 25.9% 267,992 34.5% 29.9% Nor th 135 × 2,534 2,666 5.0% 1,350 53.3% 1,677 62.9% 19.5% ○ 3,527 3,857 8.6% 1,509 42.8% 2,128 55.2% 29.1% 155 ○ 3,505 3,591 2.4% 830 23.7% 1,347 37.5% 38.4% South 159 ○ 2,348 4,165 43.6% 742 31.6% 1,546 37.1% 52.0% Chinatown 107 × 5,621 5,634 0.2% 454 8.1% 752 13.3% 39.6% 113 × 3,361 3,264 - 3.0% 341 10.1% 436 13.4% 21.8% 114 × 3,260 3,175 - 2.7% 93 2.9% 140 4.4% 33.6% 118 × 1,642 1,528 - 7.5% 148 9.0% 181 11.8% 18.2% Ar ea Tract No.* P. W . R.D.** M edi an Annual H ousehol d Incom e ( U SD )* Median monthly r ent (USD ) Units built b/w 1990 -2000 1990 2000 incr ease 1990 2000 incr ease Total Units Units built % All S.F . - - 33,414 55,221 39.5% 622 933 33% 345,912 14,061 4.1% Nor th 135 × 43,309 78,215 44.6% 955 1,058 10% 1,903 14 0.7% Japantown 152 ○ 31,966 53,906 40.7% 616 961 36% 2,519 220 8.7% 155 ○ 20,975 36,190 42.0% 564 839 33% 2,280 153 6.7% South 159 ○ 30,474 41,671 26.9% 536 1,069 50% 2,250 673 29.9% Chinatown 107 × 16,099 16,097 0.0% 324 344 6% 2,976 73 2.5% 113 × 15,568 23,933 35.0% 320 422 24% 1,629 25 1.5% 114 × 9,000 15,064 40.3% 233 323 28% 1,658 -0.0% 118 × 15,156 18,262 17.0% 281 448 37% 791 6 0.8% *Note : The 1990 incomes ar e fr
om 1989, and the 2000 ones fr
om 1999. **P .W .R.D.=P ostwar R edevelopment Sour ce : U.S. Census, 2000
higher income populations in the north and neighborhoods with new housing developments in what used to be the postwar redevelopment project areas in the south. Chinatown is also sur-rounded by areas of redevelopment. However, Japantown has buildings built after the war that have not been designated historic resources and are thus not protected, and because of
Japan-Photo 8 1600 Webster new housing on Post Street, Japantown Photograph by Takashi Oda, in June 2009
Photo 7 High-rise buildings near Japantown (south of Geary Blvd.) Photograph by Takashi Oda, in June 2009
town’s proximity to downtown, this makes Japantown an ideal target neighborhood for redevel-opment from an investors’ perspective. These socioeconomic trends have generated fears among the community about the process they have identified as “gentrification.”
5. Concluding remarks
This study aimed to grasp and confirm the community’s knowledge and feelings about neighborhood transitions in and around Japantown through a variety of measurable data. The GIS and census statistical analysis found that the socio-economic situation of Japantown is quite
different from that of Chinatown, where the majority of residents are Chinese immigrants living in buildings built more than 70 years ago. Japantown has already lost a number of pre-war
tra-ditional buildings, and the number of immigrants into the U.S. from Japan is very low. The construction of new luxury housing units in and around Japantown appear to have changed the socioeconomic composition and demographics of the neighborhood. It became clear through spatial statistical analyses that the community’s understanding of the status quo and its sense that the neighborhood is undergoing a transition toward “gentrification” are true. Additionally, the process the community describes as gentrification is in accordance with how gentrification is defined in the field of urban renewal. The feelings that Japantown is changing have been felt by members of Japantown communities over the past decade. The community’s fears that the character of Japantown was being eroded were confirmed when a series of sales of Japanese
-owned properties to non-Japanese developers occurred, including a bowling alley in 2000 and
two hotels and two shopping malls in 2006.
Political campaigns to Save Japantown ultimately gained support from local politicians (Photo 9), officials, and the wider San Francisco community. These institutionalized historic preservation and collaborative planning schemes are regarded as an entitlement acquired by the community as a result of the institutional framework for public participation and planning for the neighborhood’s future (Oda, 2010). The community has been facing the need to take action.
The community’s efforts to define what a community ought to be and how such an ethnic neighborhood should be preserved and revitalized have begun, but the process is a complicated one that requires them to deal with the socially constructed nature of ethnicity, culture, and his-tory. Similar tasks conducted among academics in the disciplines of humanities and social sci-ences have often been complicated and controversial. To build consensus in real-world
plan-ning, it is essential to have at least a clear and shared understanding of the state of the neighborhood in question. Not only do planners have to assess the neighborhood itself at the neighborhood scale, but they also have to consider how wider urban and regional socioeconomic trends affect the neighborhood’s transition. The work of geographers, through the use of GIS and spatial statistics, can provide accurate and comprehensive scientific analyses of the neigh-borhood in question. This can be achieved through interactions among geographers,
policy-makers, and those who participate in public planning and its assessment.
The quantitative analyses in this article have not reflected the impact of the financial crises following the bankruptcy of Lehman Brothers in September, 2008. The majority of the census statistics used in this study were from the years 1990 and 2000. The collapse of real estate investments and subprime loans has affected many developments in California and else-where. Future research based on the results of the Census 2010 will enable us to compare and analyze Japantown’s changing demographics and housing characteristics. In addition, more detailed analyses on the state of growing Korean businesses in Japantown would be helpful in painting a comprehensive picture of “Japantown” as a more diverse, ethnic neighborhood in transition.
Acknowledgement
I would like to express my deep appreciation to the members of the Japantown community for supporting my study. I would especially like to thank the participants of the Japantown Better Neighborhood Planning forum organized by Mr. Robert Hamaguchi, Executive Director, Japantown Taskforce, Inc. Their kind assistance and friendship has sustained my interest in, and passion for, the Japantown community. I would like to thank Mr. Ron Miguel, the president of the San Francisco Planning Commission, and other commissioners, as well as Mr. Matt Weintraub and Ms. Rosemary Dudley of the San Francisco Planning Department, for streamlining my data collection and arranging meetings with planners. I am very grateful to my academic supervisors, Professor Michael Omi at the University of California, Berkeley, Professor Gen Ueda at Tohoku University, and Professor Keichi Kumagai at Ochanomizu University, for their insightful comments and tireless assistance. Many thanks
Photo 9 Then San Francisco Mayor Gavin Newsom at a community meeting Photograph by Takashi Oda, in February 21, 2006
to the graduate students at the Institute of Geography, Tohoku University, particularly Mr. Tadayoshi Tada, for providing technical assistance.
This research was conducted under the 2008-2009 Fulbright Scholarship Program at the University of Cali-fornia, Berkeley. Dr. David Satterwhite and Ms. Mizuho Iwata at the Japan-U.S. Educational Commission (JUSEC), Tokyo and Ms. Kate Leiva at the Institute of International Education (IIE), San Francisco, greatly assisted me with my studies in the U.S. The San Francisco Office of the Japan Society for the Promotion of Sci-ence (JSPS), directed by Dr. Seishi Takeda, provided continuous assistance as I conducted my field research. The views expressed here, and any errors herein, are my own.
This paper was accepted on February 14, 2011.
Notes
1) The field study was conducted between August 2008 and June 2009, and the data used in this study were collected during the field study and examined thereafter. Some of the analyses reported here were presented and discussed at the Association of American Geographers 2009 annual meeting in Las Vegas, Nevada.
2) It is part of the University of California System, and has graduate schools, a hospital, and research center in the health and medical sciences.
3) The number includes those who were from Japan, Republic of Korea, Democratic Peoples’ Republic of Korea, Peoples’ Republic of China, Taiwan, and Hong Kong.
4) The “ethnic group” figures include both U.S.-born and foreign-born respondents, and do not define and categorize these groups into, for example, Japanese and Japanese-Americans, as this would require additional discussion and operations.
5) As identified by JETRO/JCCNC.
6) The “Bay Area” in this survey source includes Sacramento County, in addition to the nine counties mentioned in 2, seven of which appear in Figure 1.
7) Confirmed by phone with a JETRO Tokyo official, December 2, 2009.
8) San Francisco Preservation Bulletin No. 9 published in January 2003 at http://www.sf-planning.org/ Modules/ShowDocument.aspx?documentid=5081 (Last visited on January 20, 2011).
9) Also referred to in San Francisco Preservation Bulletin No. 16 available at http://www.sf-planning.org/ Modules/ShowDocument.aspx?documentid=5339 (Last visited January 20, 2011).
10) Refer to Cresswell and Hoskins (2008) for procedures on the federal historic resource designations where the authors discuss the importance of physical materiality in evaluating properties for historic significance.
11) Properties with California Historical Resource Status Code “1D” as defined as a contributor to a dis-trict or multiple resource property listed in the National Register by the keeper and listed in the Cali-fornia Register were extracted from the database.
References (* in Japanese with English abstract, ** in Japanese)
Biller, W. (1993) : The San Francisco Thrift and Wisdom Almanac. San Francisco : San Francisco
Alma-nac.
Census Bureau (1870) : Ninth Census Statistics. Bureau of the Census, U.S. Department of Commerce. Census Bureau (1990) : Census 1990. American FactFinder Dataset. Bureau of the Census, U.S.
January 19, 2010).
Census Bureau (2000) : Census 2000. American FactFinder Dataset. Bureau of the Census, U.S.
Department of Commerce. http://www.census.gov/prod/cen2000/index.html (Last visited January 19, 2010).
Corburn, J. (2005) : Street Science : Community Knowledge and Environmental Health Justice.
Cambridge : The MIT Press.
Cresswell, T. and Hoskins, G. (2008) : Place, Persistence, and Practice : Evaluating Historical
Signifi-cance at Angel Island, San Francisco, and Maxwell Street, Chicago. Annals of the Association of
American Geographers, 98(2) : 392-413.
DeLeon, R. (1992) : Left Coast City : Progressive Politics in San Francisco, 1975-1991. Lawrence : University
Press of Kansas.
Dreier, P., Mollenkopf, J. and Swanstrom, T. (2004) : Place Matters : Metropolitics for the Twenty-first
Century. Lawrence : University Press of Kansas.
Fujime, S. (2007) : An Approach to Governance with Special Reference to a Contribution of
Geogra-phy*. E-journal GEO, 2(3) : 132-138. Downloadable from http://www.jstage.jst.go.jp/article/ ejgeo/2/3/2 132/ article (Last visited January 22, 2011).
Godfrey, B. (1997) : Urban Development and Redevelopment in San Francisco. The Geographical Review,
87 : 309-333.
Graves, D. and Page & Turnbull, Inc. (2009) : Historic Context Statement : Japantown San Francisco, California. San Francisco : City and Country of San Francisco.
Hagiwara, N. (2009) : Citizens’ Research Activities on Environment and the Creation of “Shimin-chi”**.
Tooshindo.
Hartman, C. with Carnochan, S. (2002) : City for Sale : the Transformation of San Francisco.
Berkeley : University of California Press.
Kawaguchi, G. and Seigel, S. (2000) : San Francisco’s Prewar Japantown : The Shaping of a
Commu-nity. Nikkei Heritage, 7 : 4-7.
JETRO San Francisco (1992 ; 1994 ; 1996 ; 1998 ; 2000 ; 2002) : Japanese-affiliated Companies in the
Bay Area. Japan External Trade Organization, survey conducted with Japanese Chamber of
Com-merce of Northern California (JCCNC).
Johnston, R. (2000) : The Dictionary of Human Geography. 4th ed. Oxford, UK ; Malden, Mass. : Blackwell
Publishers.
Knox, P. (1982) : Urban Social Geography : an Introduction. London ; New York : Longman.
Lai, C. (2006) : Between ‘Blight’ and a New World : Urban Renewal, Political Mobilization, and the Produc-tion of Spatial Scale in San Francisco, 1940-1980. Unpublished PhD Dissertation, University of
California, Berkeley.
Murayama, Y. and Shibasaki, R. (ed.) (2009) : Seikatsu bunka-no tameno GIS**. Series GIS No. 3.
Asakura Shoten.
Oda, T. (2010) : Governance of Preserving and Rebuilding an Ethnic Neighborhood in San Francisco : A
Focus on the Institutions and Actors*. Quarterly Journal of Geography, 62 : 12-27.
Otsuka, H. (2001) : Gendai amerika shakai ron : kaikyū jinshu esunishitī karano bunseki**. Otsuki
Sho-ten.
San Francisco Planning Department (2008) : San Francisco Housing Inventory. San Francisco : City
and County of San Francisco.
Seigel, S. (2000-2001) : San Francisco Nihonmachi and urban renewal. Nikkei Heritage, 12 : 6-9.
Sugiura, T. (2007) : The Structure of Redevelopment and Changing Built Environment of San Francisco
Japantown : Focusing on the Interactions of Local Actors*. Quarterly Journal of Geography, 59 : 1 -23.
Sugiura, T. and Oda, T. (2009) : The Struggle over Place in an Ethnic Urban Space : An Example from
Wilson, W. (1987) : The Truly Disadvantaged : the Inner City, the Underclass, and Public Policy.
Chicago : University of Chicago Press.
Yamashita, K. (2005) : Kajin shakai-ga wakaru hon : Chūgoku-kara sekai-e hirogaru nettowāku-no
reki-shi, shakai, bunka**. Akashi Shoten.
Zhou, M. (2009) : Contemporary Chinese America : Immigration, Ethnicity, and Community Transforma-tion. Philadelphia : Temple University Press.