Lake Pyykösjärvi water quality model
Timo Huttula
† and Ninni Liukko†† Freshwater Centre, Finnish Environment Institute, Finland [email protected]
Abstract:
Lake Pyykösjärvi waters are eutrophied with frequent algal blooms and oxygen depletion. The main reasons are nutrient rich sediments and long retention time the waters. In the recent project funded by EU the effects pumping the extra waters from Oulunjoki were assessed and for this purpose also a wter current and water quality model was applied in the lake. The project results are presented in a recent report [1].The main results are summarized here.
1. Introduction
Lake Pyykösjärvi is situated in the city of Oulu, Finland. It covers an area of 146 ha and has an average depth of 1.33 m with total volume of the lake of 1.95 million. m3 . In 2003, during the dry period the theoretical lake residence time was very long, more than seven years (Visuri, etc. , 2003). It obtains waters from the urban catchment. The ecological state of the lake is weak due to the frequent algal blooms in summer and winter time oxygen depletation and fish kills. The Oulu City has equipped the lake with aeration pump during the winters of 1985-2010. The effects of aeration are locally limited and because of that and also to reach a long lasting solution City of Oulu has constructed a pipe line for leading river water from the Oulunjoki River to the Lake Pyykösjärvi. For the assessing the effects pumping the nutrient poor river waters a water current and water quality model was applied in the lake in the recent project. The project was funded by the regional funds from EU.
2. Model
COHERENS model is a three-dimensional hydrodynamic and water quality model. It has been developed in Belgium at Management Unit for the Management of Mathematical Models for the North Sea (MUMM) unit. Luyten et al. (1999) give an accurate description about the model. Model includes a physical model, sediment and water quality model. The physical model is a sub-models for currents, salinity and temperature. In this work the algebraic formulation of the turbulence was used in the flow calculations. Waves and currents interact in
Coherens was one in EMAPS model comparison project and it was found to function well on Gulf of Finland [2]. The water quality model is by the Finnish Environment Institute (SYKE), which based on the model of Kiirikki et al. [3] .
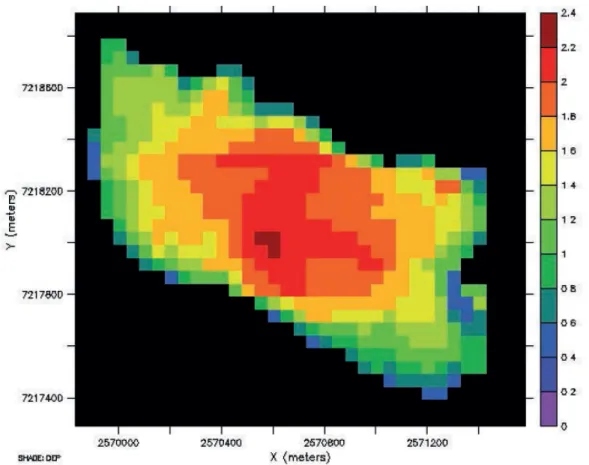
Fig. 1. The computational grid in the Pyykösjärvi-model application. The color scale describes the water depth in meters.
The spatial resolution in the model domain was 50 m (Fig. 1) with four vertical layers. The simulations covered three months in the winter 2010 and five months in summer 2010. The meteorological data was obtained from the local weather station, about 700 m from the lake. The initial values for water temperature and the nutrient concentrations were obtained from the water samples. The simulations were conducted both for the present situation and for the pumping situation.
For the model calibration Lagrangian drifter measurements were conducted on the lake during five days in autumn 2010. Also an acoustic current meter was used for one month measurement period in the NW cornet of the lake.
3. Results
Fig. 2. Measured and simulated water currents in Lake Pyykösjärvi on 21.9.2010. Measured in the upper left panel. The direction of the flow is indicated with arrows. The numbers near the arrows show the velocity in cm/s during different measurements. The simulation results are in panels b…d. b) shows the surface currents resulting from barotropic simulation, c) same as b) but resulting from baroclinic simulations, d) is near bottom currents from baroclinic simulations. The velocity scale for simulation results is between panes b) and d).
It was seen that in the dynamic simulations on each measurement days the baroclinic result were much more realistic as the barotropic ones (Fig. 2), especially during the weak winds. During the stronger winds the results were not corresponding the measurement results. This seems to be due to the local wind field. In our simulations wind was assumed to be evenly distributed over the lake. In reality such a small lake is sheltered by building and trees
Model simulates the water temperature evolution in a satisfactory way leaving the lake waters cooler than in reality, with the most discrepancies in autumn (Fig. 3.). This may also to be a due to the too large heat loss due to the over estimated wind field.
Fig. 3. Observed and simulated water temperature in the deepest place of the Lake Pyykösjärvi during the period of 1.5.-31.10.2010. Blac line = simulated surface temperature, red line= simulated near bottom temperature, circle= water temperature measured with YSI-probe near surface and star= temperature measured with YSI-probe bottom.
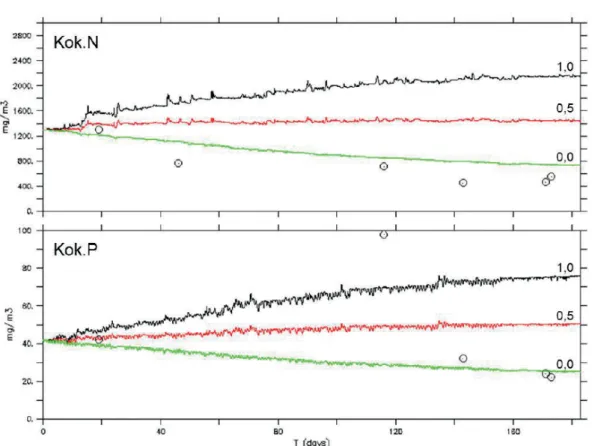
The nutrient modelling was limited due the lack of data on external loading. Also the quantification of internal phosphorus loading was a challenge. Fig. 4. shows an example, how the estimation of urban nutrient loading effects to the simulated concentration in the lake water. It was clear that using the annual values of the urban loading was not feasible in this study. Model was mainly calibrated with the sinking velocity of nutrients.
Fig. 4. Observed and simulated concentrations of total nutrients in surface waters in the deepest site at Lake Pyykösjärvi period of 1.5.-31.10.2010. Black line = with earlier reported annual urban loading, red line= same as black but with 50 % reduction, green line = no urban loading. Circle= observed nutrient concentration.
Fig. 5. The effects of pumped waters in Lake Pyykösjärvi total phosphorus content in winter 2010. The changes in concentration (in mikrograms/liter) are shown in colors.
The pumping simulations the results showed clear changes in nutrient concentrations and the were more remarkable during the winter time (Fig.6.). The modelling results are also supported by the monitored data from the lake (Martinmäki 2013). Now it is possible to use model for optimizing the pumping practice for the best possible results for the benefit of the lake.
5. Conclusions
The 3D- Coherens model application in a shallow lake Pyykösjärvi was realized. The challenges in the model application were on the atmospheric interaction in correct wind forcing and heat balance as well as in the external and internal nutrient loading estimations. Still the goals for demonstrating and quantifying the effects of river water pumping on the lake water quality were met. The collaborative work of between SYKE and University of Okayama was improving the atmospheric interaction of the model. This work is reported elsewhere in this publication.
References
[1] N. Liukko and T. Huttula: “Coherens model and its application to Lake Pyykösjärvi”. In K. Martinmäki, T. Ulvi T. and M. Visuri: Effects of dilution water in Lake Pyykösjärvi. Reports of Finnish Environment Institute 3/2013.
[2] K. Myrberg, V. Ryabchenko, A. Isaev, R. Vankevich, O. Andrejev, J. Bendtsen, A. Erichsen, L. Funkquist, A. Inkala, I. Neelov, K. Rasmus, M. Rodriguez Medina, U. Raudsepp, J. Passenko, J. Söderkvist, A. Sokolov, A., H. Kuosa, T. Anderson, A. Lehmann & M.D.Skogen: Validation of three-dimensional hydrodynamic models of the
Gulf of Finland. Boreal Env. Res., 15: 453-479. 2010
[3] M. Kiirikki, M., A. Inkala, A., H. Kuosa, H., H. Pitkänen, H., M. Kuusisto, M. and J. Sarkkula: Evaluating the effects of nutrient load reductions on the biomass of toxic
nitrogen-fixing cyanobacteria in the Gulf of Finland, Baltic Sea. Boreal Env. Res.
6:131-146. 2001
[4] P. J. Luyten, J. E. Jones, R. Proctor, A. Tabor, P. Tett and K. Wild-Allen,. COHERENS - A
coupled hydrodynamical-ecological model for regional and shelf seas: user documentation. MUMM report. Management Unit of the Mathematical Models of the