西 南 交 通 大 学 学 报
第 55 卷 第 1 期
2020 年 2 月
JOURNAL OF SOUTHWEST JIAOTONG UNIVERSITY
Vol. 55 No. 1
Feb. 2020
ISSN: 0258-2724 DOI:10.35741/issn.0258-2724.55.1.50
Research articleComputer and Information Science
C
OMPATIBILITY OF
E
NHANCEMENT AND
S
EGMENTATION OF
D
IGITAL
I
MAGE
P
ROCESSING IN
M
EDICAL
A
PPLICATIONS
医学应用中数字图像处理的增强和细分的兼容性
Mayada Jabbar Kelain
College of Tourism Sciences, Al-Mustansiriyah University
Palestine Street, Baghdad, Iraq, Mayadajabbar @ALuomustansiriyah.edu.iq
Abstract
The proposed work is an attempt to investigate the compatibility of enhancement and segmentation within the digital image processing framework in the medical field. The correction nonuniform illumination enhancement technique and marker-controlled watershed segmentation method were conducted in order to calculate the red blood cells in digital images of blood samples. Twenty-five patients at Medical City Teaching Hospital in Baghdad participated in this study. The attained outcomes of the two mentioned methods were compared with the real results, which were obtained by a digital camera coupled with a high technology microscope. The comparison illustrated large matching between two proposed techniques and real outcomes throughout very short computation time in spite of limited features of the used computer and available MATLAB environment.
Keywords:Gradient, Image Analysis, Morphological Opening, Foreground Marker, Background Marker
摘要 提出的工作是试图研究医学领域中数字图像处理框架内增强和分割的兼容性。为了计算血液 样本数字图像中的红细胞,进行了校正不均匀照明增强技术和标记物控制的分水岭分割方法。巴 格达医疗城市教学医院的 25 名患者参加了这项研究。将上述两种方法获得的结果与实际结果进行 比较,而实际结果是通过数码相机和高科技显微镜获得的。比较结果表明,尽管使用的计算机和 可用的 MATLAB 环境的功能有限,但两种建议的技术之间的匹配度很高,并且在很短的计算时 间内便获得了实际结果。 关键词: 渐变,图像分析,形态学开放,前景标记,背景标记
I.
I
NTRODUCTIONDigital image processing is one of the highly advanced processes in the medical field. It employed thoughts and ways from other fields, such as visuals, digital electronic, complex algorithms in computer science, as well as
advanced mathematics, in order to deal with images sufficiently. Therefore, functionalizing digital image processing in a practical field requires adequate information about mathematical and computational tools that support it [1], [2], [3]. The system of digital
image processing includes three main stages that can be described as follows:
A. Image Acquisition
In this stage, compatible sensors were used in order to distinguish the illumination and capture features of images, as well as to convert images from analogue to digital form, in order to be compatible for processing via computer.
B. Manipulation or Processing
This stage is considered to be the core function of digital image processing; it comprises basically five processes (Table 1). Moreover, images are subjected to mathematical operations through advanced computer algorithms.
C. The Output of Processing
Finally, the manipulated images will be displayed on the computer monitor or appropriate screen in the analogue form; thus, images will be converted from digital to analogue in this stage [4], [5], [6].
Table 1.
Manipulation or processing and examples of the processes
Today, a wide range of needs significantly depend on the digital image processing and improvement of image visualization in order to analyze and extract useful data. This process is indispensable in numerous applications and diverse fields, such as diagnose of diseases and wireless health monitoring for patients in medical field; monitoring of troops activities in military; quality assessment and process watching; and simulated and improved reality in automation and robotic applications, as well as calculating and categorizing of constituents and impurities in material investigation [7], [8], [9].
In this paper, the computation of red blood cells in blood smear was investigated as an example of a medical application utilized in digital image processing. Two of the typical five processes, which shown in Table 1, were used to manipulate images of blood. The first process was the correction nonuniform illumination
enhancement technique, which was conducted for this purpose; in the next process, images were analyzed by using the marker-controlled watershed segmentation technique.
II.
T
HEC
ALCULATION OFR
EDB
LOODC
ELLSIn medical fields, the calculation of red blood cells is employed in order to assess a person's broad health conditions. Some major medical requirements rely on the calculation of blood cells, such as the examination for a large number of health issues and infections, observing the health situation of patients, and evaluating the extent of influence of medications after an analysis. The common and comprehensive blood test outcomes for a normal individual are indicated in Table 2.
Table 2.
From the statistics of Table 2, the blood test provides essential data for physicians in order to attain the correct diagnoses for patients. Obviously, there is a tremendous number of red blood cells in a very tiny volume measured by a micrometer. Therefore, digital image processing (as an advanced system) will significantly facilitate handling such a large amount of data.
III.
W
ORKE
NVIRONMENTA. Resources
On 23 July 2019, image samples of the blood test were taken at Medical City Teaching Hospital, i.e., one of the most famous medical institutions in Baghdad. The images were captured by a qualified medical staff via a digital camera coupled with a microscope (AmScope, 40X-2500X LED). A total of 25 patients participated in this study. It should be noted that the study was conducted on a busy working day; thus, our time was so limited for study conduction.
B. The Calculation of Red Blood Cells by Using the Enhancement Process
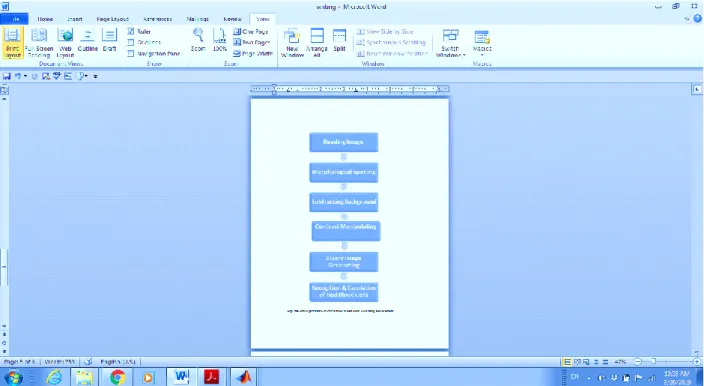
The purpose of the enhancement process is to address a digital image in order to get a higher quality image than a unique image for use in particular applications. A wide range of ways are available in the enhancement process, such as interpolation, contrast stretching, and histogram equalization. Dynamic range compression enables users to develop the visualization of images by adjusting colors or pixels’ values in order to conduct a number of complex analyses by computer and extract specific data. In this paper, the correction nonuniform illumination enhancement method was employed to recognize red blood cells from samples. Therefore, the computation of their number will be facilitated [11], [12], [13]. The proposed technique was conducted in several steps as follows: (a) reading and converting images to gray form; (b) using of morphological opening to estimate background; (c) subtracting background from the unique image; (d) manipulating the contrast of image; and (e) generating binary image of blood in order to recognize and calculate the number of red cells in the image (Figure 1). Image samples of blood were processed through these steps of enhancement in order to calculate red blood cells for each one (Figure 2).
Figure 1. The proposed procedure of calculation of red blood cells by using enhancement
Reading image
Converting to gray format
Subtracting background
Morphological opening
Contrast manipulating
Binary image generating and calculating red blood cells Figure 2. Sample of blood image subjected to enhancement
C. The Calculation of Red Blood Cells by Using Segmentation Process
Segmentation is one of the most crucial processes in digital image analysis. Segmentation recognizes the objects of images and separates them by using their borders. The objective of the segmentation process is simplifying and altering the appearance of the digital image to be more expressive and compatible with analyzing. It is classically employed to detect objects and borders such as outlines and curvatures in images. More accurately, image segmentation can be described as allocating a marker to pixels in an image separately in order to categorize pixels that have the same marker within one group that has particular features [14], [15], [24].
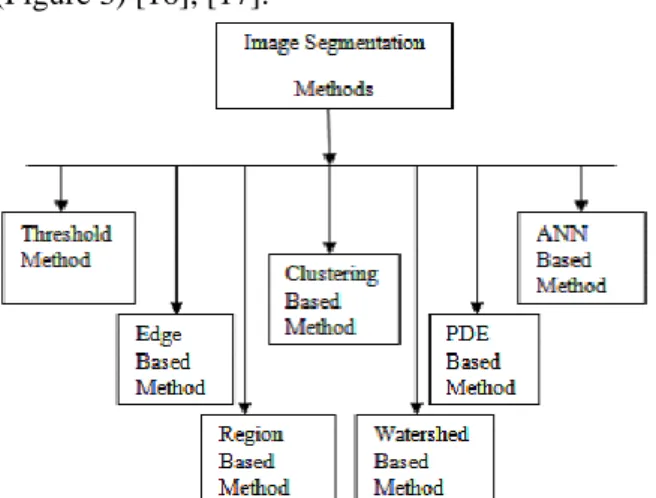
In general, the segmentation process is categorized into two kinds: The first one is limited segmentation (involved a particular portion or area of an image), and the second is comprehensive segmentation (involved dealing with the entire image. The widespread methods utilized for the segmentation process are thresholding scheme, edge detection-based methods, region-based methods, clustering-based methods, watershed-based methods, partial differential equation-based methods, and artificial neural network-based methods, and so forth (Figure 3) [16], [17].
Figure 3. Comprehensive categorization of segmentation techniques
1) Marker-Controlled Watershed Segmentation Method
In this research, the marker-controlled watershed segmentation method was used in order to calculate the red blood cells. The theory of this watershed technique can be described as follows: The pixels’ values signify sinks have holes in their bottoms from where the water leaks. Once water touches the boundary of the sink, the contiguous sinks are amalgamated together in order to keep parting between sinks. Thus, according to this description, barriers are essential to distinguish the boundaries of the segmented region. These barriers are created via dilation. The basic assumption builds watershed methods and considers the gradient of the image as a mathematical surface to identify light pixels as a high value and dark pixels as a low value [18], [19].
2) Image Gradient Techniques
As mentioned above, the segmentation process depends on the gradient of the image to address pixels’ values; the gradient as a mathematical tool has been performed in many techniques. The two most common gradient methods to deal with segmentation are Sobel and Prewitt methods. Sobel can be described as a mathematical tool that accomplishes a two-dimension spatial gradient on a digital image. It concentrates on the image’s regions, which have a high gradient and reach to the edges [20], [21]. Mostly, the Sobel operator is comprised of a convolutional matrix (3×3) shown below in a set of matrices:
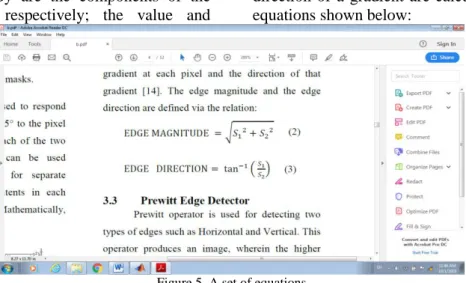
where Gx and Gy are the components of the entire gradient, respectively; the value and
direction of a gradient are calculated by a set of equations shown below:
Figure 5. A set of equations
On the other hand, the Prewitt technique was utilized in order to detect horizontal Gx and
vertical Gy, two categories of gradients [22], [23].
Figure 6. Categories of gradients
This method yields a digital image by identifying edges between two objects within the image via the higher gray values of pixels as identifiers. Similar to the Sobel method, the value
and direction of the gradient calculated by the Prewitt technique can be described mathematically by a set of equations.
Figure 7. A set of equations
In the proposed work, calculating of red blood cells was conducted by using the marker-controlled watershed segmentation technique, which can be identified in the following steps:
1. Reading images of blood samples and converting them to gray form.
Figure 8. RGB image
Figure 9. Gray image
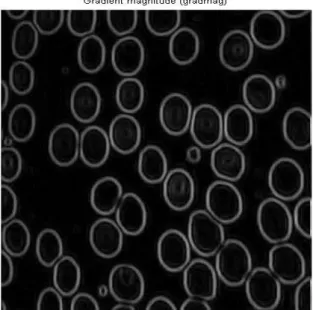
2. Applying the mathematical expression of the gradient as a segmentation modeling. In this research, the Sobel and Prewitt methods were implemented separately in order to calculate the gradient of blood images.
Figure 10. Gradient of the image via Sobel function
Obviously, in both the Sobel and Prewitt methods, the gradient is more intensive at the boundaries of each blood cell, whereas it is inside them. Thus, the gradient computation can be described as a way paver that distinguishes the targeted objects (red blood cells in the proposed work) within the digital image.
3. Computation of the foreground markers, which are responsible for connecting pixels’ globules within each foreground object separately. Under this phase, a digital image of a blood sample was processed morphologically via opening and closing methods, which are based on the erosion and dilation, as shown below, in order to attain the foreground markers.
a. Opening (erosion plus dilation)
b. Opening by rebuilding erosion plus the morphological process
c. Opening closing by rebuilding
d. Local highest of opening closing by rebuilding
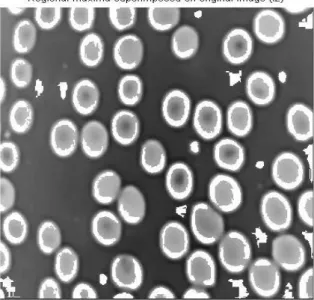
f. Adjusted local highest superimposed on the initial image Figure 12. Computation of the foreground markers
The function of the process from a to c is to eliminate unwanted blotches and maintain the outline quality of each object with minimum influence. In process d, the local highest of opening closing was computed by rebuilding in order to attain better possible markers. Foreground markers integrated with the initial image in process e in order to conclude the results.
Some shaded objects were not marked. Therefore, such objects will not be subjected to the segmentation process sufficiently; furthermore, some foreground markers move to the edges of the objects, and thus requires cleaning the edge of the marker globules and then reducing the size of them. For achieving this purpose, closing plus erosion was used in process f.
4. After obtaining the adjusted image in the previous step, dark areas, which represent background, will be distinguished; thus, the computation of background markers will be computed sufficiently. Attaining a binary image of each blood sample is completed by thresholding image, which was obtained in process c in the previous step, as shown below.
Figure 13. Binary image of a blood sample
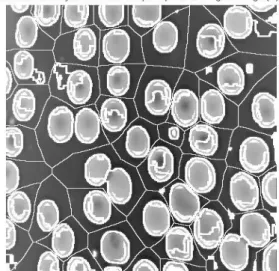
It is worth mentioning that all the above steps were implemented with both Sobel and Prewitt functions. Also, in order to avoid touching markers of background (black areas) with edges of particular objects (red blood cells), watershed border lines must be produced by the watershed transform of the thresholding distance to maintain the separation between background and foreground pixels, as shown below.
Figure 14. Watershed border lines
5. Finally, the watershed transform of the gradient value was computed; in this step, the gradient value might be adjusted for the occurrence of the local lowest of all markers. Therefore, the targeted objects (red blood cells) can be segmented and calculated appropriately, as shown below.
Figure 15. The final form of segmented red blood cells
IV.
I
NVESTIGATION OF THEW
ORKO
UTCOMESThe computer, which was used to obtain experimental results, has Intel® Core™ i3-3200
processor M350 (2.5 GHz), RAM (8GB), VGA Intel® HD Graphics, and 64-bit operating system. The entire image processing, including the correction nonuniform illumination enhancement and marker-controlled watershed segmentation methods, was done via the MATLAB environment Version 7.8. In order to investigate the compatibility extent of digital image processing including enhancement and segmentation, it was essential that a comparison was made between the attained results from both processes in the proposed work and reference results (real number of blood cells per sample), which were obtained by the medical staff via microscope plus digital camera (Table 3). The matching percentage (Table 4) between the reference and attained results was calculated via the below equation:
Matching percentage = ………..1
Table 3.
Comparison results through two proposed ways with reference results Sample
No.
Real number of blood cells per sample
Number of blood cells per sample via proposed
enhancement
Number of blood cells per sample via proposed segmentation (Sobel
gradient)
Number of blood cells per sample via proposed segmentation (Prewitt gradient) 1 76 75 73 74 2 43 40 39 38 3 66 64 65 64 4 87 84 86 86 5 82 79 80 79 6 69 66 67 68 7 44 42 42 42 8 74 72 71 73 9 26 25 25 25 10 36 34 34 35 11 75 74 74 72 12 48 44 46 46 13 59 55 57 58 14 61 58 60 60 15 28 24 26 25 16 89 86 88 88 17 49 45 48 49 18 93 89 91 90 19 56 53 55 54 20 94 90 92 92 21 68 65 68 66 22 72 70 70 70 23 39 36 38 38 24 40 36 37 38 25 55 52 53 53 Table 4.
Matching percentage between reference and attained results Matching percentage (Enhancement) % Matching percentage (Segmentation-Sobel) % Matching percentage (Segmentation- Prewitt) % 0.99 0.96 0.97 0.93 0.91 0.88 0.97 0.98 0.97 0.97 0.99 0.99 0.96 0.98 0.96 0.96 0.97 0.99 0.95 0.95 0.95 0.97 0.96 0.99 0.96 0.96 0.96
0.94 0.94 0.97 0.99 0.99 0.96 0.92 0.96 0.96 0.93 0.97 0.98 0.95 0.98 0.98 0.86 0.93 0.89 0.97 0.99 0.99 0.92 0.98 1.00 0.96 0.98 0.97 0.95 0.98 0.96 0.96 0.98 0.98 0.96 1.00 0.97 0.97 0.97 0.97 0.92 0.97 0.97 0.90 0.93 0.95 0.95 0.96 0.96
V.
C
ONCLUSIONThe above-investigated outcomes sufficiently illustrate that the proposed nonuniform illumination enhancement and marker-controlled watershed segmentation methods are compatible and dependable in medical applications, as addressing processes in a digital image processing environment. The minimum matching percentages for enhancement and segmentation with Sobel and Prewitt were 86%, 91%, and 88%, respectively. Moreover, the implementation time was 1.25, 3.99, and 3.98 seconds, respectively, which shows the complexity of segmentation with respect to enhancement by taking into consideration the high performance of segmentation with both gradient techniques.