ASSUMPTIONS FOR ESTIMATING THE FATIGUE STRENGTH OF NOTCHED SPECIMENS
By
Masao TAKAHARA, Hideo KANEsHiRo, Tatsuo ENDo (Received Nov. 1, 1971)
ABSTRACT
Since the computation of cyclic plasticity problems of notched part of which materials soften or harden under repeated strain is necessarily complicated, an ap- proximate method suitable for engineering application is discussed. The experi- mental results were compared with the results by the approximate calculationwhich is based on the following four assumptions. a) Invariance of the ratio of total strain holds even when the material is under cyclic plastic deformation. b) Cyclic stress- strain relationship of plain specimen holds at the every point over the sections of notched specimens, c) Equilibrium on the section of notch must be satisfied, d) The occurrence of the crack of engineering size at a critical location defines the fa- tigue life. The experimental results under repeated torsion of a cyclically hardening annealed copper and of a cyclically softening heat treated high tension steel and aluminum alloysusing a longitudinally or a circumferentially notched roundbar, agreed quite well with the result of calculation which is based on the cyclically softening or hardening properties of the materials tested. Namely not only the cyclic softening or hardening properties of notchedspecimen under constantstrain amplitude control, which is expressed by the relationship between the moment vs. angle of twist, but also the hysteresis loop form of notched specimen, and the initiation of crack were predicted by using the cyclic properties of materials.
In the appendix of the paper a trial equation which is useful to calculate the maximum stress-strain of notched plate is proposed.
INTRODUCTION
The purpose of this paper is to examine a simple method which enables us to estimate the low cycle fatigue behavior of a notched member from the mini- mal laboratory data of materials, taking into account the cyclic hardening or soften- ing property. It is well known that the metals currently used show cyclic harden- ing or softening during the repetitions of stress, and the property is especially important in low cycle fatigue" ef engineering materials.
Several methods, which are useful to approximate the maximum amplitude or the concentration factor of stress or strain, have been proposed by several
investigators without intending to introduce the change of cyclic hardening or softening in an explicit manner. For instance, Forrest3' suggestedthepossibility of substituting the total strain distribution ratio for the elastic one, for determin-
ing fatigue strength of notched members which are subjected to tension-com- pression. Udoguchi, Mitsuhashi andWada`' and Langeri5' discussed the notch effect in low cycle fatigue range. Stowel15' presented a simple relation for getting stress and strain concentration factors under tension of the partially plastically deformed plate having a circular hole in an infinite plate (Stowell's equation).
By rewriting Stowell's equation, Hardrath and Ohman6' presented a simple rela- tion which is applicable to sharper notch (Generalized Stowell's epuation). Accord- ing to this equation Hardrath & Crews" studied the simulation which connects the strain amplitude at notch root with the smooth specimens data. On the other hand Neuber8' proposed a useful idea for getting an approximate solution, based on the mathematical investigation on the stress-strain behavior of the shear flow in prismatical bodies having non-linear deformation law. The idea is that the geometrical mean value of the strain and stress concentration factors (at any stress-strain law) is equal to the Hookian stress concentration factor Kt (Neuber's rule). Manson, Hirschberg2i' and Wetzel, Morrow & Topper9) 23' applied these rules to fatigue life estimation by replacing the Kt by the notch factor or fatigue stress concentration factor Kf.
The finite element method combined with the recently developed high speed digital computer2' is most promissing in this field and has much merit. However, there are many troubles remaining, for example, it generally needs enormous computer memory and long computation time and the accuracy of the method has problems still, depending on the case applied. Even in statically loaded ca- ses, the calculations which completely satisfy the equilibrium, boundary condi- tions, compatibility and elasto-plastic relationship are quite time-consuming. There- fore, the more complicated stress-strain relationship under cyclic hardening or softening requests some approximate approach. Namely, the estimation of the strain amplitude at a critical location or life by exact elasto-plastic solution is
fundamentally best, however, the method is complex and tedious, even if the property of cyclic hardening and or softening is disregarded for the sake of simplicity. This is the reason why the approximate method which makes it easy to introduce the cyclic properties is examined in this paper.
Several simplified methods suitable for engineering application have been in- vestigated. The methods of cyclic plasticity, elastic-strain invariance method, initial-plasticity method and elastic stress invariance method have been compared by Manson and the results are shown in his book : Thermal Stress and Low Cycle Fatigue.
In this paper a method which is based on the cyclic stress-strain curve and
the approximate distribution of strain was applied to the low cycle fatigue prob- lem of a shaft with longitudinal or circumferential groove under monotonic and cyclic torsion for the materials which cyclically harden or soften. The method is also applied to get the fatigue life of notched specimens. In the appendix of this paper the similar preliminary investigation on aluminum alloy JIS A3B4-T4 (which is equivalent'to 2024-T4 in USA.) in the stable state of cycling is reported.
The fundamental assumptions used for the cases of cyclic torsion which are shown in this paper are as follows:
a) Invariance of the ratio of total straip
When the strain in elastically stressed material is divided by the maximum strain on a section, the ratio is only a function of the geometrical form of notch and ofthe loading mode (for example tension, bending or torsion). Theratiois practically the function of the radius of notch on the section but is independent of magnitude of strain. It is assumed in this paper that the ratio is also kept constant even if material is subjected to cyclic deformation provided that the magnitude of the strain is an order of magnitude which corresponds to usual low or intermediate cycle fatigue. The assumption "Total Strain Ratio Invariance" is hereafter written as TSRI for brevity in this paper by picking up the initials of each letter. And the ratio may be called by strain intensity ratio, which is determin- ed by theory of elasticity.
The absolute value of strain at any point in material is obtained by multiply- ing the strain intensity ratio by the maximum representative strain of the sec- tion which is dermined by using the additional following assumptions b) and c).
The strain intensity ratio on the minimum section of notch is used, but the ra- tios on proper additional sections may be selected in order to get a better ap- proximation for deformation estimation. In this paper the ratio was taken to be constant over any sectlon.
b) Use of cyclic stress-strain curve
The stress value on the section at n-th cycles is determined from stain by using the cyclic stress-strain curve at the cycles.
c) Equilibrium on the section of notch
On the section of notch, the stress which is determined from the assumption a) & b) have to satisfy equilibrium condition. Results of integration of the in- finitesimal force which is determined from the stress by infinitesimal area must be equal to a force on the section, and the integration of the elementary moment which is determined from the stress must be equal to a moment which is deter- mined from free body concept.
d) Fatigue crack initiation
Th.e amplitude of maximum strain vs. number of cycles relationship determines in- itiation of engineering size crack, independent of the gradient of stress or strain near the not.ch root, in the body of this paper.
Above assumptions a) through c) mean that the approximate solutions satisfy the cyclic stress-strain relationship, boundary conditions, condition of compatibility and the equilibrium on sections. But the condition of equlibrium at the every elementary volume of material is approximately satisfied.
TORSION OF A SHAFT wrTH OIN[E SEMI-CIRCULAR LONGITUDINAL GROOVE
1-1 Elastic-plastic strain distribution
In this chapter the torsional problem in the elastic-plastic state was analyzed by using a relatively simple assumption: shearing strain r on the cross section is proportional to an angle of twist per unit length 6 after the assumption TSRI,
r-K(r, q)•e, (1)
where r and q are polar coordinate of the section of a bar.
The proportional constant K (r, q) is assumed to be only a function of coordinates and not to be independent of the material used (assumption b)) even if the speci- men is subjected to plastic deformation. This means that K (r, q) can be deter- mined from the elastic solution. (Fig. 1)
Tt
litill"""z' g
--b X
Fig. 1. The cross section of the shaft with one semi-circular longitudinal groove.
In the case of torsional problem of a shaft with one semi-circular longitu- dinal groove, the proportional constant K (r, q) can be easily determined as follows.
According to the theory of elasticity the stress function of torsional problem must satisfy the following differential equation:
a2Åë
1 a2Åë 1 aÅë
ar2+7 6T, +7, aq2=-- 2Ge (2)
at every point in the cross section, and
on the boundary of cross section, where G is modulus of shear.
By reference to Weber's theory Eqs. (2) and (3) are satisfied by taking the stress function of the following form :
Åë-{lte (r2-b2) (1-2-ll-cosq) (4)
where a is the radius of the shaft and b is the radius of the semi-circular groove.
Therefore, the shearing stress T. in the radial direction and the shearing stress Tt in the tangential direction become respectively as foliows:
T.- -il- gl:t3 =Ge (a- ",,b2) sinq (s) T, =- -Q,-2- Ge (a (i+l9il) -r} (6)
From Eqs. (5) and (6) the resultant shearing stress T at any point (r, q) on the cross section is represented in the following form :
T = (Tr2+Tt2)112
= Ge[ (a- ar92)2sin2q + (a (1 + 9;1) cosq -r)2]i/2 (7)
In the elastic region the shearing stress-strain relationship is :
where r is the resultant shearing strain. Substituting Eqs. (8) and (1) into (7), we have:
r== [a2 (1--brt)2sin2q+ (a (1+91) cosq-r}2]ii2e (g)
or
K(r, q) == [a2 (1-9;1)2sin2q+(a(1+9il) cosq-r}2]'i2 ao)
Thus the shearing strain distribution on the cross section for elastic-plastic torsion of the shaft with one semi-circular longitudinal groove can be approximately de- termined by Eq. (9) from the assumption of TSRI.
Substituting r-=b and op-O into Eq. (9), we have the resultant shearing strain rm.. at the notch root, and it is represented as follows:
r...= (2a-b) •e (11)
1-2 Fatigue Fracture Criterion
The repetition of plastic strain is directly connected with fatigue phenomena.
Hence one might postulate that the fatigue crack of notched specimen initiates on the surface of specimen at the same number of cycles which is necessary to initiate fatigue crack on a smooth specimen under the equal amount of amplitude of strain.
1-3 Shearing stress-strain relationship
The monotonic shearing stress-strain relationship was obtained from monotonic torsion tests of circular solid specimens graphically.i6)
Similarly, the cyclic shearing stress-strain relationships were graphically determined from the cyclic torque vs. angle of twist relationship of circular solid specimens'7) i8' under completely reversed strain control as a paramater of num- ber of repetitions. The cyclic stress-strain curves are shown later in Figs. 4, 9 and A-1.
1-4 Calculation of torque of notched specimen
Using the shearing strain distribution on the cross section of the notched specimen (as assumed in section 1-1) and using the cyclic shearing stress-strain relationship at n-th cycle (monotonic when n-O) of the material (described in section 2-3), we get the approximateshearing stress distribution on the cross sec- tion of the notched specimen at n-th cycles. Therefore, the relation between the amplitude of the torque of the notched specimen at n-th cycles and the amplitude of angle of twist is obtained by the following relationships.
The amplitude of torque at the n-th cycles is:
(Mt)n-2IJ(Tt).r2 dr dq (13)
where:
(Tt)n "= (T). Sin go (14-1)
q = tan"i (l rri 1)
-tan-il"J(.i(;/ll'li2}/C)O,S,:;l"i (,,.,)
(T)n== fn (r) -- f. (Kr (r, q) •e) (14-3)
The subscript n stands for the number of cyc!es.
To obtain the numerical value of the torque amplitude (M,). by digital com- puter, the cross section of the notched specimen was divided into smaller parts as shown in Fig. 1. The infinitesimal torque (AM,). about the originOinduced by the shearing force acting on the small element ABCD is nearly equal to(Tt).r2Ardq, therefore Eq. (13) can be represented approximately as
(Mt)n*Z(AMt)n (15)
s
where IE] means the summation over the area of cross section of notched speci- smen. Equations 9 through 15 are usefull for cyclic plasticity.
1-5 Materials and Specimens
The 99.7 9o copper CuB-1-H and high tension steel "Welten 8oC" were selected as representative cyclic hardening or softening metals respectively. The chemical composition and mechanical properties of "Welten 80C" are shown in Table 1.
Table 1.
Chemical Conposition (%) c
O. 15
si
O.26
Mn
O. 85
P
O. O12
s
O. O06
Cr
O. 9
Mo
O. 47
B TR
Ceq
O. 6
Mechanical Properties (kg/mm2, %) Yield Point
79
Tensile Strength 86
Elongation 22
Heat Treatment
Q & Temper
The pure commercial copper specimens were machined from a circular shaft of 25 mm in diameter. These machined ones were annealed at 6000C for 2 hours and polished up by fine emery paper.
The high tension steel specimens were machined from a plain plate of 29 mm in thickness. And these machined ones were polished up by fine emery papers.
All the smooth specimens are finished at the dimensions shown Fig. 2-(a), the notched specimens are shown in Fig. 2-(b) for the pure copper and in Fig.2-(c) for the high tension steel.
`''
lo""/.lr,v .`. "eOO.. .,,
N .
-.ny)-- .
s2 2s io6o 2s s2 tti4ssOo4IZi!III iiL
Fig. 2-a. Smooth Specimens. Fig. 2-b. Notched Specimens (Copper) R=1,4.5,9mm
R=1,3,6
Fig. 2-c. Notched Specimen (High tension Steel)
' 1-6 Method of test
The static torsion testing machine of horizontal type of 5000 kg-cm capacity was remodeled for fatigue test under strain control, or under constant amplitude of angle of twist.
The fatigue crack initiation and the growth (about O.2 mm in crack length) of pure copper specimens were observed by using a microscope (7Å~40). The ma- chine was controlled by hand or by switching mechanism. The angle of twist of the specimen was measured either by the mirror type angular displacement meter or the capacity change type transducer combined with the amplifier of which the output is connected to an XY-recorder when the amplitude of strain is comparative- ly small, or by a set of circular protractor with a pointer equipped at the gage marks when the amplitude is larger. On the other hand, the twisting moment was determined from the torsion testing machine in combination with the strain- gage type torque-meter which is mechanically connected to specimens in series.
The output of the torque signal is sometimes led to XY-recorder.
1-7 Comparison with experimental results (a) Pure Copper (annealed at 6000C for 2 hours)
As shown in Fig. 3, shearing stress amplitude, under completely reversed strain control, increases remarkably during the first few cycles due to cyclic hardening, and the amplitude is virtually stable after about 15 cycles. The stress was cal- culated from cyclic Mt-e diagram by using modified Prandtle's method.
2s rv-
•-"5
,.-l
l
'-"
L- T---
crack initiation
o
U) o.os g,- '-
ouÅ~ O.OS O-., .Nk8 0.12Z-•- . -' '' '-' '
N 4 o.o39,-.
O.O19.
o Lmhmm-L-L-gm
ation
.
lo-1 114 (Mon o.) 1 2 S IO 2 5 lo2 2 S lo3
N Cycle
Fig. 3. Cyclic hardening of Pure copper CuB-1-H.
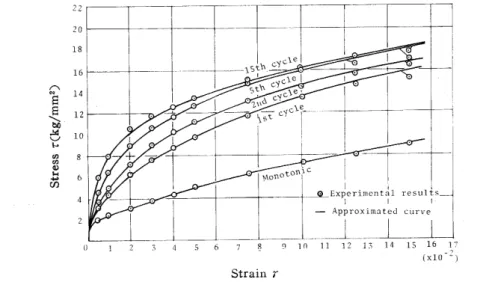
Fig. 4 shows the monotonic and cyclic shearing stress-strain relationships at the n-th cycles (n-=1, 2, 5, 15) which are obtained from the repeated tests of the circular solid specimens under constant amplitude of angle of twist. The small white circular marks shown in this figure are points of experimental results re-
22 20 18
16
A
paE 14
g i2
bo
e ioN
en88
en.: 6 4
2
U ' -nv- '- cYc .. ... - ." :,;I •z"d CY N:- . .. .l
. . t lft
---
isth.syz:cie
. I ii 1
,t.cy?,zil 4![ I
. LF -ig rr" -'"' rm '
--
"lto"oto"; l
1].rGLJExperime l - Approxim ..-. -l"L-.r.
O 1 2 7s 4 5 6 7 8 9 10 ll 12 l3 l4 ]! 16 -1,7--tm (xlO L)
Strain r
Fig. 4. Monotonic and cyclic stress•-strain curves for specific number of cycles. Pure copper CuB-1-H
ported in Table 2, and these experimental results are approximated with curved solid lines, where the curves are mathematically expressed and shown in Table 3.
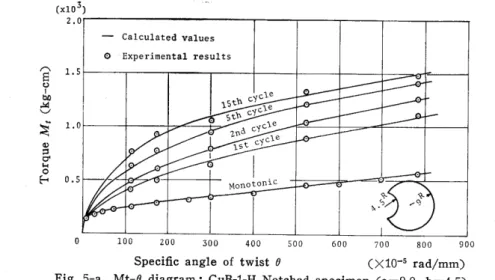
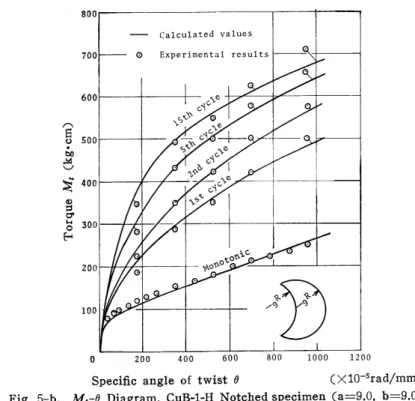
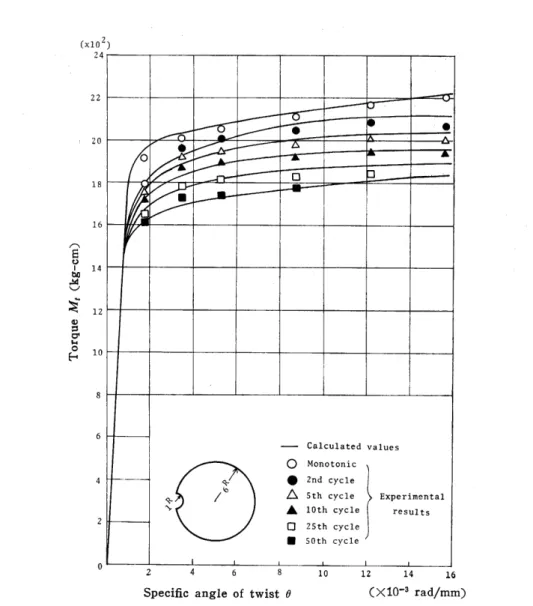
Fig. 5 (a) and(b) show the monotonic and cyclic torque-specific angle of twist
relationships of notched specimens for a=9.0mm, b==4.5mm. and a=9.0mm, b
!=9.0mm, respectively. The solid curved lines shown in these figures are the re- sults calculatedby using the assumption of TSRI. The numerical values are given in Tables 4 (a) and (b). The small white circular marks (o) are the experiment-
Table 2. Monotonic and Cyclic Shearing Stress-Strain Relationship.
(Experimental Results) (CuB-1-H) Strain (10"2)
O. 1 O. 2 O. 3 O. 4 O. 5 O. 75 1.0 2.0 3.0 4.0 5.0
7. 5 10. 0 12. 5 15. 0
Monotonic Stress
e
1. 50 1. 70 1. 80 1. 94 2. 03 2.20 2. 40 3. 05 3. 70 4.30 4.95 6. 20 7. 20 8. 00 8.90
Stress Amplitude (kg/mm2)
lst
1. 60
2.05 2. 40 2. 74 3. 05 3, 72 4.40 6. 25 7. 60 8. 70 9. 70 11.64 13.40 14.56 15. 25
2nd
1. 70 ' 2. 30 2. 90 3. 20 3. 50 4.30 4.95 7. 25 9. 00 10. 20 11. 15 13. 00 14.45 15. 60 16. 30
5th 2. 00 2.85 3. 60 4.20 4.60 5. 50 6. 50 8. 90 10. 30 11.50 12. 50 14.60 16. 10 17. 20 18. 00
15th
3. 70 4.34
5. 40 5. 90 7. 15 8. 05 10. 50 11. 70 12.60 13. 40 14.90 16. 10 17. 10 17. 70
Table 3. Monotonic and Cyclic Shearing Stress-Strain Relationship (Approximated) (CuB-1-H) Monotonic
T==3310r(O-Åq.rÅq3.5Å~ 10-`), T =7. 0rO'25`(3. 5Åqr=Åq1.7x lO'2), T =25. 0rO'533(1. 7x10⁻²Åqr)
lst cycle
T=3310r(O;:{ rÅq3. 5Å~10-`) T=41. 0rO•480(3. sx lO-4.Åq.,. -t•) 2nd cycle
T= 3310r(O:$r.Åq.. 3, 5Å~ 10-`) T= 53. 0rO•5i5(3. 5Å~ 10-`Åqr$4Å~10-2)
T==36. 0rO'39`(4Å~10-2Åqr) 5th cycle
T= 3310r(O-Åq. 3. 5Å~ 10'`) T== 58, OrO'`'9(3.5x lO-`Åqr.Åq=2Å~ 10-2)
T==38. 0rO'37'(2Å~10"2Åqr) 15th cycle
r= 3310r(OÅq.r-Åq. 3.6Å~ 10-`) T== 115. 0rO•578(3.6Å~ 10-4r .Åq.=9 Å~ lo-3) T =32. IrO'296(9 Å~ 10-3Åqr)
al results of repeated tests under constant amplitude of angle of twist of notch- ed specimens, the numerical values are given in Tables 5-(a) and (b).
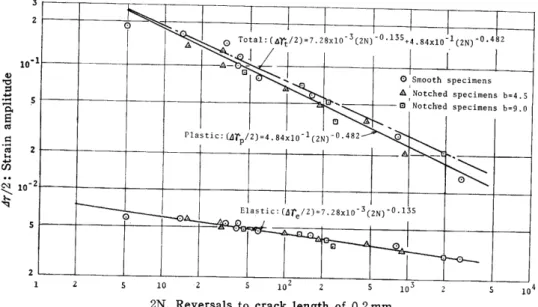
Fig. 6 shows the relation between shearing strain amplitude and number of reversals to crack initiation or to crack length of O.2mm. The results were ob- tained from the low cycle fatigue test under completely reversed strain control.
In these figures the ordinate !Yt is shearing strain amplitude identified with a tilltL for circular solid specimen of which radius is a mm, and with (2a-b) ilttfor notch- ed specimen with notch radius b, where !lieL is the amplitude of specific angle of twist. And the abscissa 2N is number of reversals, where N is the number
of cycles.
(xlo3)
2.0
a i.5
&,
6
S i.o
g
6 E- o.s
-Calculatedvalues eExperirnentalresults
.i ihhcCyYcie
cle
cycle
'
I.
.
cycle
'z"a
lst
l
'
.
. .
Monotonic
'
.
".9
O 100 200 300 400 500 600 700 800 900
Specific angle of twiste (Å~10'5 rad/mm)
Fig. 5-a Mt-e diagram: CuB-1-H Notched specimen (a=9.0, b=:4.5)
800
700
600
Afi
o soo
Mtn'
-.
N 4oo 8
cr
"o 30o
e
200
100
Calculatedvalues Experimentalresults
'
o
-
.
eNe
je.eS.
LA"
NS 's-t"
.
eS
eS eNe
,pt"5
L
.
oNe eS AsLsL.
Lttrt... p
-
pte"ot.o"le.. --
.8g"
o 2oo 4oe 6oo soo looo 12oo
Specific angle of twist e (Å~10-5rad/mm)
Fig. 5-b. Mt-e Diagram, CuB-1-H Notchedspecimen (a=9.0, b=9.0)
Table 4-(a) Torque-Specific Angle of Twist Relationship of Notched Specimen (a=9.0mm, b =4.5mm) (Calculated values) (CuB-1-H)
TorqueMt(kg.cm)
Specific
AngleofTwist
(rad/mm) Mono. lst 2nd 5th 15th
25Å~10-5 50 75 100 200 250 300 350 400 450 500 600 700
183 210 232 253 297 318 344 365 386 411 445 480 525
208 287 352 404 566 627 686 740 784 832 875 955 1030
218 310 384 445 636 715 785 845 910 967 1020 1110 1195
298 416 505 579 802 890 971 1040 1093 1140 1184 1270 1340
308 460 590 700 950 1042 1090 1150 1203 1240 1280 1359 1435
Table 4-(b) Torque-Specific Angle of Twist Relationship of Notched Specimen (atÅ}9.0 mm, b==9.0 mm) (Calculated values) (CuB-1--H)
Angle of Twist Specific (rad/mm)
10XIO-5 30 50 75 100 150 200 250 300 350 400 500 600 700 800 900 1000
Torque Mt (kg. cm) Mono.
48 68 75 86 95 107, 117 127 135 145 153 173 192 211 229
F
l
lst
l•
247 l 465
1
256 • 493
58 88 118 142 164 196 229 t 254 273 295
320 351 388 419 446
2nd 63 97 126 156 179 223 256 289 320 343 366 412 453 484 520 557 588
5th 70 132 169 205 236 287 328 367 403 432 454 493 532 564 591 619 640
15th 122
183 230 273 345 407 430 463 492 518 552 584 613 634 660 680
Table 5-(a) Torque-Specific Angle of Twist Relationship of Notched Specimen (a=9.0 mm, b=4.5 mm) (Experimental results) (CuB-1-H)
TorqueMt(kg.cm)
Specific
AngleofTwist
(rad/mm) Mono. lstl2nd 5th 15th
116Å~10-5 175 300 523 785 1134
254 292 340 462 563
650 1
410 500 652 890 1109 1265
495 635
612 • 775
789 953
1043 1212 1262 1410 1433 1570
765 930 1062 1328 1480 1615
Table 5-(b) Torque-Specific Angle of Twist Relationship of Notched Specimen (a=9.0mm, b =9.0 rnm) (Experimental results) (CuB-1--H)
Specific Angle of Twist (rad/mm)
175Å~10-5 349 524 698 960
Torque Mt (kg. cm) MonoN
114 151 173 210 350
lst
185 286 350 420 500
2nd 223 348 422 500 576
5th 280 430 499 578 656
1
i
15th 345 490 549 624 711
10
s
vo5
.-.P 2
-A E es lo'1
sco
't
Ct) 5
ouÅ~
NK 2
-2
l
ee
l
L
:6rrxo.A )Ssxr Xe l eA)lr#x..ÅqAo e e
T o Å~.".e
O e smooth specimens A A Notched specimens (b=4.5) O e Notched specimens (b;9.0)
t
I
,
iA.O A
i• l o•-xl ex
-t- ---
i
Crack lnltlatlon
11 r
1
l
1
1 i
E
AÅrsi}i,oii.illillEi :`Å~ -
101 2 s lo 2 s lo2 2 s lo3 2 s lo4
' 2N Reversals
Fig. 6. Strain amplitude-life diagram.
'
Further, the fatigue life versus stable values of plastic, elastic and total strain
relationships are plotted in the manner. shown by Manson and his co-workers (Figs.7 & 8). From these figures the following experimental equations were ob- tained. The total strain vs. Iife relationships are:
s
2
-1 10o
vs
.--
-5qEN
•tsq
Sz
en ny N& lo--2
s
2
e '.
.A Total:Art!2=7.2xio'3
e:Smoothspgcimens A:Notchedspecimensb=4.5 e:Netchedspecimensh=9.0
-O.124-1-O.431(2N)+3.6xlO(2N)
.ON
4-
-1-O.431Plastic;AYp12=3.6xlOC2N)
.-h.
-- N.
. .N
e
mastic:aTVre
'
o .. /- --
.. 'IJ
m•
2N Reversals' to'crack initiation
Fig. 7. Life (crack initiation) as a Function of Elastic, Plastic and Total strain of annealed Pure Copper.
vos
- AE N
.s
•:
co --
Å~NK
3
2 o '
-A Tota1:(A"rrt12)=7.28x1O -3C2N)-O.135+4
.84xlo-.1(2N)-O.482
. 'l
10-1 A-•-g
. N . o
1Smooth specimens
AlNotched .speclmens b=4.S
S 'N e Notch'ed speclmens b=9.0.
o
Plastic:(Arp!2)=4.s4xlo-1(2N)TO•482 Ne
2 A
.
.lrxs.
--z o
10
o Elastic: (Ar.l2)=7.28xlo -3 (2N)'O. 13S
S .
' .
-, m o.
2
1 5
10Z 5 1022 51032 5 10
2N, Reversals to crack length of O.2mm
Fig. 8. Life (crack length of O.2mm) as a function of elastic, plastic and total strain. Annealed Pure Copper.
( d2rt) =7.2Å~lo-3 (2N) -O•i24+3.6Å~lo-i (2N) -e•43i (16) for crack initiation, and
( d2rt) =7.28Å~10-3 (2N) -O•i35+4.84Å~10-i (2N) -O•482 (17)
when crack length becomes O.2 mm. The numerical values are given in Table 6.
(b) High Tension Steel "Welten 80C"
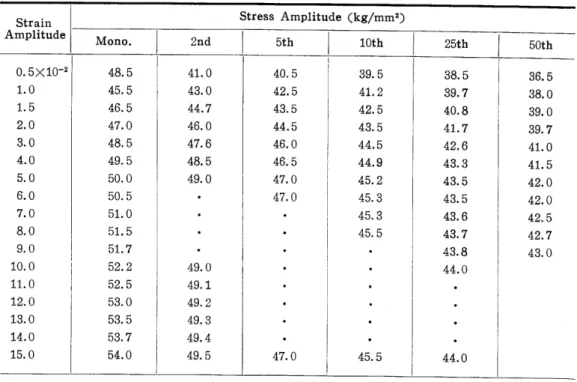
The shearing stress amplitude of this material under completely reversed strain control gradually decreases due to cyclic softening. The cyclic shearing stress- strain relationships at n-th cycles (n-2, 5, 10, 25, 50) obtained by using modified Prandtle's method from Mt-e diagram of repeated torsion tests of circular plain specimens are shown in Fig.9. The cyclic softening property is expressed mathe- matically using the data shown in Tables 7a and 7-b.
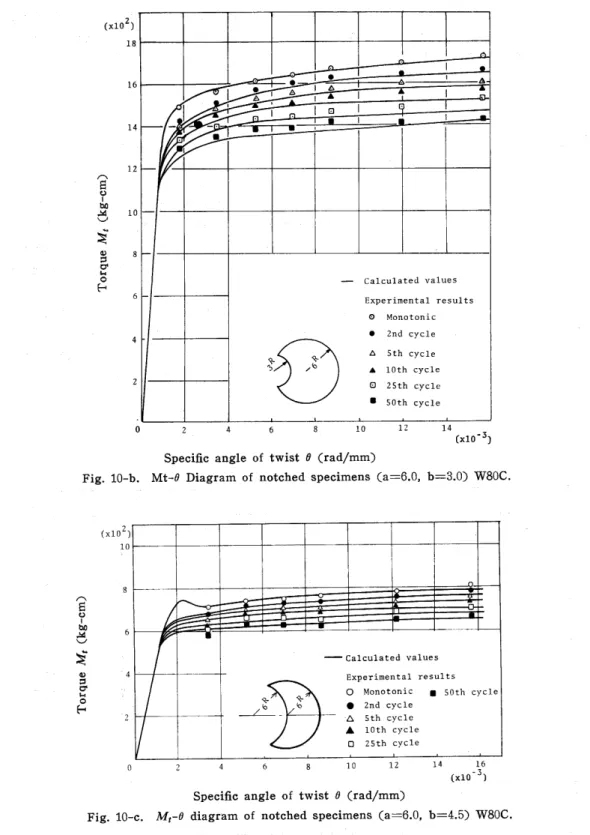
Fig. 10 (a), (b) and (c) show the monotonic and cyclic torquevs. specific angle of twist relationships of notched specimens for (a=:6,O mm, b--6.0 mm), (a==6.0 mm, b-3.0 mm) and (a==6.0 mm, b===1.0 mm) respectively. The solid curved lines shown in these figures are the results calculated by using the assumption on the strain distribution TSRI. The numerical values are given in Tables 8 a) b) c).
The .various marks are the experimental results of repeated torsion tests of the notched specimens under constant amplitude of angle of twist. The numerical values obtained by experiment are given in Table 9 (a) through (c).
The calculated value shows the cyclic softening of notched specirnens which is
Table 6. Fatigue Data Annealed pure copper Specimen
No.
MaximumTotal
Strain Amplitude
Elastic Strain Amplitude
AP.titpariSa,t,tin.Cd,1 it..el/c,Oe.rrtS,O,."fk.iS No.of
Reversalsto CrackLength
ofO.2mm
ASII AS20 AS09 AS21 AS16 AS12 AS07 ASIO AS13
20. 91Å~10-2 18. 27 15, 63
112. 55
10. 44 8. 33 6. 21 3. 13 1. 57
l
]
- XIO-2 - Å~10-2 O. 57 i 17. 70
O. 53 15. 10 O. 53 12. 02 , o.4g I g.gs l
'O. 46 i 7. 87
1o. 43 I s. 7s f
O. 35 O. 29
l i
2. 78 1. 28
5 12 16 28
AV06 AV09 AV03 AV05 AV04 AVOI AV07
15. 31 14.18 10. 64 7. 07 5. 32 4.12 2. 36
O. 57 O. 53 O. 50 O, 44 O. 41 O. 38
I
14.74 13. 65 10. 14 6. 63 4.91 3. 74
1
O. 33 l 2. 03
'
AWOI AW03 AW04 AW05 AW02
9. 42 7. 46 5. 49 3. 93 2. 36
b ;
O. 48 i 8. 94
O. 44 7. 02 O. 39 5. 10
dO. 35 l 3. 58
1
O. 29 2. 07
1
60
144 800 3800
10 28 64 84 80
120 320 1600 5400 20
32
120 248 480 1688
32 60 60
200 380 920 1840
64
144 200 400 1968
'
'
"
a
92
264 440 500 3880 AS ... Smooth Specimen (Circular Solid)
AV ... Notched Specimen (a=9, O, b=4.5) AW ... Notched Specimen (a==9, O, b=9. 0)
ofi
e Å~bO 30
MvN
enco 20 o"
-
co 60
50
40
30
20
Approximatedcurves
-Monotonzc
oe2ndcycle A5thcycle A10thcycle
o25th-cycle eSOthcycle
Experimental results 10
o 2 4 6 8 iO i2 l4 (.lo.126 )
Strain r
Fig. 9. Monotonic and cyclic stress-strain curves for specific numbers of cycles. (W80C)
CXIOZ) 24
22
i 20
18
16
Ag i4
g
S i2
05cr
"
8 io
8
6
4
2
o
2 4 6 8 10 IZ 14 16
Specific angle of twiste (Å~10-3 rad/mm)
Fig. 10-a. Mt-e diagram of notched specimens (a==6.0, b==1.0) W80C.
e e
o e
o e
-Calculatedvalues OMonotonic e2ndcycle Asthcycle A10thcycle O2Sthcycle 150thcycle
Experimental results
due to the softening properties of the material which is determined by circular speclmens.
1-8 Discussion
For the pure copper CuB-1-H (cyclic hardening material) and for the high tension steel W80C (cyclic softening material), considerable agreement between the experimental results and the calculated values were noted in the monotonic and cyclic relationships of torque-specific angle of twist notched specimen as shown in Fig. 5 through Fig. 10. This shows that the assumption TSRI may be used for engineering purposes.
If notable discrepancies exist between the assumed shearing strain distribu- tion and the actual one, considerable discrepancies between the experimental results
(xlo2)
18
16
14
12
Ag
?
M 10bo V.' :$l
08
5cr
"
eo 6
4
z
-
•le .e
. --
.a
lx,. iA IA
iIol•'l1
--
.t
--e
,
.
5"-&
-Calculatedvalues Experimentalresults
OMonotonic e2ndcycle A5thcycle A10thcycle O25thcycle esothcycle
O 2 4 6 8 10 12 14
(xlo'5) Specific angle of twist e (rad/mrn)
Fig. 10-b. Mt--e Diagram of notched specimens (a=6.0, b==3.0) W80C.
(xlo2) 10
8
AE
?
Mbe 6 vs
O' 4
g
s 20
9-.Lbl--
b
-Calculatedvalues Experimentalresults
-OMonotonicesOthcycle
" e2ndcycle 'A5thcycle A10thcycle
O2Sth•cycle
o 2 4 6 s 10 IZ l4 .136
(xlO ) Specific angle of twist e (rad/mm)
Fig. 10-c. Mt-e diagram of notched specimens (a==6.0, b= 4.5) W80C.
'
and the result of integration must be noted. The following example illustrates this. In Fig. 11, the broken lines were obtained by assuming that the shearing strain distribution over the cross section is the same as that of the circular solid
specimen. The range of integration is the section of notched specimens. The values obtained are greatly different from both the experimental results and the calculated values determined by the method of this paper in the monotonic torque specific angle of twist relationship of aluminum alloy A3B4-T4. This shows the merit of the assumption TSRI.
The low cycle fatigue problem has become simple and plain by establishing these assumptions. Namely, the strain amplitude at the notch root is immediate- ly calculated if the elastic solution is known, Accordingly the fatigue life of
notched specimen can be approximately predicted by using the shearing strain amplitude versus life relationship obtained from the fatigue test of smooth specimens under constant strain amp!itude.
In case of the repeated torsion under constant torque amplitude, the hysteresis loop, generally, becomes stable after the cycling of one-tenth of the cycles to failure. Therefore the fatigue life can be approxinately predicted by using the amplitude of angle of twist (corresponded to the torque amplitude) obtained from the stable cyclic torque vs. angle of twist relationship.
Table 7-a Monotonic and Cyclic Shearing Stress-Strain Relationship (Experimental Results) (W80C)
Strain Amplitude
O. 5Å~10-2 1.0 1.5
2. 0 3. 0
4.0
5. 0 6. 0 7. 0 8. 0 9. 0 10. 0 11. 0 12. 0 13. 0
14.0 15. 0
Stress Amplitude (kg/mm2) Mono.
48. 5 45. 5 46. 5 47. 0 48, 5 49. 5 50. 0 50. 5 51. 0 51.5 51.7
i 52.2
52. 5 53. 0 53. 5 53.7 54.0
2nd
41. 0 43. 0 44.7 46. 0 47. 6 48. 5 49. 0
e
.
.
.
49. 0 49. 1 49. 2 49. 3 49. 4 49. 5
5th 40. 5 42.5
10th 25th
1
39. 5 41. 2
l
43.5 i 42.5
44.5 46. 0 46. 5 47. 0 47. 0
.
E
f
l
• l 45.5
I I
.
.
.
.
47. 0
/
43. 5 44.5 44.9 45. 2 45. 3 45. 3
.
.
.
.
45. 5
38. 5 39. 7 40. 8 41.7 42. 6 43. 3 43. 5 43. 5 43. 6 43. 7 43.8 44.0
.
.
.
. 44.0
50th 36. 5 38. 0 39. 0 39. 7 41. 0 41. 5 42. 0 42.0 42.5 42.7 43.0
Table 7-b Mathematical Expression of Monotonic and Cyclic Shearing Stress-Strain Relationship (W80C)
T=ArB (Cf{:rKD)
A
Monotonic 9705 27. 527 52. 865 60. 601 60. 873 2nd cycle 9705 54.452 63.214 50. 714 5th cycle 9705 57. 251 48. 086 10th cycle 9705 62. 415 56. 900 47. 718 45. 942 25th cycle 9705 52. 745 50. 739 44.657 50th cycle 9705 53. 123 47. 934 49. 564
B
1 -O. 10799 O. 030549 O. 063067 O. 065016
1 O. 053553 O, 084051 O. O13001
1 O. 065362 O. O071271
1 O. 089066 O. 069903 O. O19722 O. O03243
1 O. 060387 O. 051153 O. O085332
1 O. 07144 O. 049121 O. 058182
c
o 5. 0Å~10-3 9. 0Å~10-3 1.5Å~10-2 1.0Å~10-i
o 4.0Å~10-3 7. 5x10⁻³ 4.5Å~10-2
o 4.0Å~10-3 5. 0Å~10--2
o 4.0Å~10-3 8. 0Å~10-3 3. 0Å~lo-2 1.0Å~10-i
o
3.65Å~10-3 1.5 Å~10-2 5.0 Å~10-2
o 4.6Å~10-3 1.0Å~10-2 2. 5Å~10-2
D
5. 0XIO-3 9. 0xlO-3 1.5Å~10-2 1.0Å~10-i
4.0Å~10-3 7. 5Å~10-3 4.5Å~10-2 1.6Å~10-i
4.0Å~lo-3 5. 0Å~10-2 1.5Å~10-i
4.0Å~10-3 8. 0Å~10-3 3.0Å~lo-2 1,Ox10-i
3. 65Å~10-3 1.5 Å~10-2 5.0 Å~10-2
4.6Å~10-3 1.0Å~10-2 2. 5Å~10-2
Table 8-(a) Torque-Specific Angel of Twist Relationship of Notched Specimen (a==6.0mm, b=6.0rnm) (Calculated Values) (W80C)
Specific Angle of twist
(rad/mm)
50Å~10-5 100 200 400 800 1200 1600
Torque Mt (kg-cm) Mono.
237 475 733 727 753 770 780
2nd
g 237 484 654 683 727 748 756
5th 237 483 648 672 706 721 728
10th 237 480 627 653 689 697 699
25th 237 482 613 630 658 669 674
50th 237 491 600 604 629 637 645
Table 8-(b) (a=6.0 mm, b==3.0mm) Specific
Angle of twist (rad/mm)
50XIO-5
100 200 400 800 1200 1600
Torque Mt (kg-cm) Mono.
672 1340 1541 1581 1654 1691 1718
2nd
1
F
E
l
1
672 1243 1413 1507 1601 1636 1645
5th 672 1231 1397 1474 1546 1578 1585
10th 672 1197 1358 1438 1502 1516 1523
j E
25th 50th
672 672 1187 1187 1321 l 1264 1
1386 ] 1320
]
1439 i 1372 1461 i 1402
1467 1422 Table 8-(c) (a=6.0 mm, b=1.0mm)
TorqueMt(kg-cm)/
Specific
Angleoftwist
(rad/mm) Mono. 2nd 6th 10th 25th 50th
50Å~10-5 100 200 400 800 1200 1600
937 1991 1981 2043 2126 2185 2227
1
g 937 1624 1827 1951 2066 2110 2125
937 1609 1806 1954 1993 2035 2047
g37 I g37 ls62 I ls4s
1756 1706 1859 1788 1931 1854 1955 1885 1968 1855
j
:
937 1530 1636 1706 1767 1817 1844 Table 9-(a) Torque-Specific Angle of Twist Relationship of Notched Specimen
(a= 6.0 mm, b =6.0 mm) (Experimental results) (W80C) Specific
Angle of twist (rad/mm)
174. 4Å~10-5 349 523 698 872 1220 1570
Torque Mt (kg-cm) Mono.
617 710 730 740 757 780 803
2nd 570
t 670
715 725 735
I 755
776
5th 545 650 704 706 705 732 755
i
10th 25th
1535 [ 512 630 i• 610
1
690 i
660 660695
650682 ,710 680
730 i 715
50th 485 585 630 634 625 650 660 Table 9-(b) Torque-Specific Angle of Twist Relationship of Notched Specimen
(a=6.0 mm, b=3.00 mm) (Experimental results) (W80C) Specific
Angle of Twist (rad/mm)
174.4Å~10-5 349 523 698 872 1220 1570
Torque Mt (kg-cm) Mono.
1484 1551 1600 1639 1660 1690 1718
2nd 1420 1500 1560 1594 1621 1640 1656
5th 1396 1475 1525 1542 1570 1590
i
10th i 25th
I
1600 i 1563
1368 1446 1483 1495 1526 1550
1325 1389 1424 1435 1459 1475 1517
50th 1286 1339 1372 1379 1410
/ /
Table 9-(c) (a==6.0mm, b=1.0mm) Specific
Angle of Twist (rad/mm)
174.4Å~lo-5 349 523 872 1220 1570
Torque Mt (kg-cm) Mono.
1914 2004 2053 2110 2164 2200
i
2nd i 5th
1788 1960 2002 2045 2082 2060
r
l
1750 1920 1950 1976 2005 2000
10th
E 1718
1872 1895 1917 1952 1938
25th 1648 1778 1811 1825 1838
/
50th 1610 1726 1740 1770
/ /
Ag
?
.t'O
-"
x
8
Vi,,
o (xlo3)
3.0 rr
l Mt-O:A3B4-T4 •
2.0
e 1.o
1 1 / I t t l
l.1 l!
l/.t t
- -
- n
! -- t '
-
ll-
I L
ti I e
1 ••, l•
-r rnv
l
7t ',
v 7
'`"
-t .-
' .x
.--- -
o
elastic limit (notch root)
l
-. p-- --.
-• -K -'--
a=9.0,b;1.0
- ..
.. .-.
'
---
--.. --
a=9.0,b=4.5
-- -- ---- ...----'"-
a=9.0,b=9,O
---
----
.-. -..
-.- --
e experimental results calculation by strain distribution ratio adopted
--- calculation by strain distributi•on ratio of circular s61id
O ] 7. 3 4 s 6 t (x lo 5)
Specific angle of twist e
Fig. 11. Mt-e diagram, A3B4-T4 Alumimum alloy notched specimens.
TORSION OF A SHAFT WITH A CIRCamRENTIAL GROOVE
In this section, the other cases of low cycle fatigue, the torsion of shafts with a circumferential groove of which form was hyperbolic, U or V types were investigated on the same assumptions as the preceding section.
2-1 Elastic-Plastic Strain Distribution
NeuberiO) obtained the elastic of solutiontorsion of a shaft having deep circum- ferential hyperbolic groove. The elastic solution is given as follows: Using Fig.
12, the curvilinear coordinates (u, v, w) are connected with the rectangular co- ordinates (x, y, z) by the following equations,
x == sinh u•cos v
"f'
Fig. 12. Circumferential hyperbolic Notched menber.
y== coshusinvcosw (18)
z == cosh u sin v sin w
The shearing stress distribution is given by the following equations,
ruw--gp(1+2v\ipf()liv411.tf"p)IS)MhV..,h,. (lg)
r., == O, r..=O
where p: nominal shearing stress , h: magnification factor ,
vo: value of v indicating the notch surface,
2a: diameter of the minimum cross section of notched member, p: notch curvature radius ,
and further
h2 == sinh2u+cos2v (20)
tan2v=-!1 (21)
p
sin vo=a. (22)
The shearing stress on the cross section (y-z plane ie. x=u==O plane) is
T-Tuwlu-o-ip
(1+2Vylt+-(;.+)V7;+-"p}-1)tanv (23)
Putting sin v=/y2+i2==r, we have
T=gp(,.,Yi'b.(;.3V(f+,i;--,)/i-,2, (24)