• 検索結果がありません。

Malic enzyme 1 is a potential marker of combined hepatocellular-cholangiocarcinoma, subtypes with stem-cell features, intermediate-cell type.

N/A
N/A
Protected

Academic year: 2021

シェア "Malic enzyme 1 is a potential marker of combined hepatocellular-cholangiocarcinoma, subtypes with stem-cell features, intermediate-cell type. "

Copied!
30
0
0

読み込み中.... (全文を見る)

全文

(1)

1

Title:

Malic enzyme 1 is a potential marker of combined hepatocellular-cholangiocarcinoma, subtypes with stem-cell features, intermediate-cell type.

Running title:

New IHC marker for intermediate cell carcinoma

Authors:

Yutaro Mihara, MD

1

, Jun Akiba, MD, PhD

1,2

, Sachiko Ogasawara, PhD

1

, Reiichiro Kondo, MD, PhD

1

, Hiroto Fukushima, MSc

3

, Hiraku Itadani, PhD

3

, Hitoshi Obara, MPH

4

, Tatsuyuki Kakuma, PhD

4

, Hironori Kusano, MD, PhD

1

, Yoshiki Naito, MD, PhD

1,2

, Koji Okuda, MD, PhD

5

, Osamu Nakashima, MD, PhD

6

, and Hirohisa Yano, MD, PhD

1

.

Institutions:

1

Department of Pathology, Kurume University School of Medicine, Kurume, Japan.

2

Department of Diagnostic Pathology, Kurume University Hospital, Kurume, Japan.

3

Discovery and Preclinical Research Division, Taiho Pharmaceutical Co., Ltd, Tsukuba, Japan.

4

Department of Biostatistics Center, Kurume University, Kurume, Japan.

5

Division of Hepatobiliary and Pancreatic Surgery, Department of Surgery, Kurume University School of Medicine, Kurume, Japan.

6

Department of Clinical Laboratory Medicine, Kurume University Hospital, Kurume, Japan.

Corresponding author: Yutaro Mihara, MD

(2)

2

Department of Pathology, Kurume University School of Medicine, 67 Asahi-machi, Kurume, 830-0011, JAPAN.

Tel: +81-942-31-7546, Fax: +81-942-32-0905, E-mail: [email protected]

Conflict of Interest: No authors have any conflict of interest to disclose in this manuscript.

Financial support: This work was supported in part by JSPS Grant-in-Aid for Scientific

Research(C)(JP18K07032).

(3)

3

Abstract

Aim: Combined hepatocellular-cholangiocarcinoma, subtypes with stem-cell features, intermediate-cell subtype (INT) shows various histological appearances and may be misdiagnosed as intrahepatic cholangiocarcinoma (iCCA). In the present study, we aimed to identify specific histological diagnostic markers of INT.

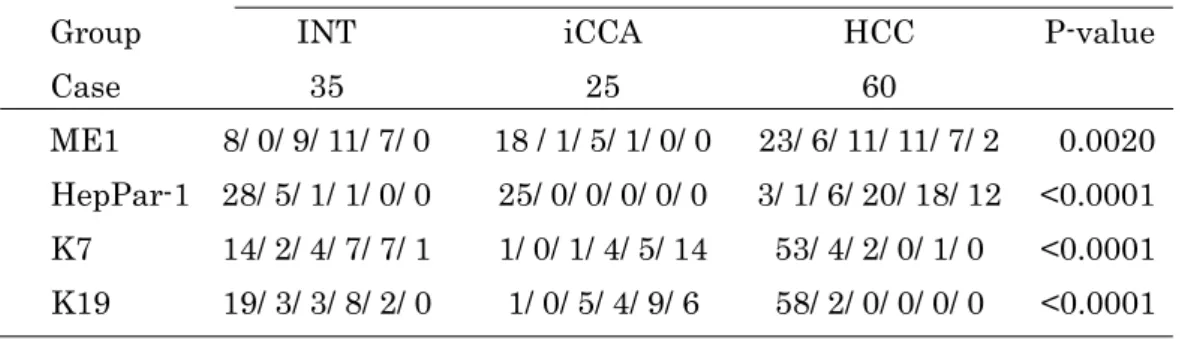
Methods: We extracted RNA from FFPE sections of 6 INT, 5 iCCA, and 5 hepatocellular carcinoma (HCC) cases and compared gene expression between INT, iCCA, and HCC by microarray analysis. We then conducted immunohistochemical (IHC) staining of potential key molecules identified by microarray analysis, the conventional hepatocytic marker, hepatocyte paraffin (HepPar)-1, and the cholangiocytic markers, keratin (K) 7 and K19, on 35 INT, 25 iCCA, and 60 HCC cases.

Results: Microarray analysis suggested that malic enzyme 1 (ME1) was significantly upregulated in INT. IHC analysis revealed that the positive rates of ME1 in INT, iCCA, and HCC were 77.1% (27/35), 28.0% (7/25), and 61.7% (37/60), respectively. Analysis of classification and regression trees based on IHC scores indicated that HepPar-1 could be a good candidate for discriminating HCC from the others with high sensitivity (93.3%) and high specificity (96.7%). A multiple logistic regression model and ROC curve analysis based on the IHC scores of ME1, K7, and K19 generated a composite score that can discriminate between INT and iCCA. Using this composite score, INT could be discriminated from iCCA with high sensitivity (88.6%) and high specificity (88.0%).

Conclusions: We propose that ME1 is a useful diagnostic marker of INT when used in combination with other hepatocytic and cholangiocytic markers.

Key words: combined hepatocellular-cholangiocarcinoma, intermediate cell carcinoma,

stem cell feature, malic enzyme 1, microarray analysis, immunohistochemical analysis

(4)

4

INTRODUCTION

In the 2010 World Health Organization (WHO) classification

1-3

, primary liver carcinoma (PLC) is divided into hepatocellular carcinoma (HCC), intrahepatic cholangiocarcinoma (iCCA), and combined hepatocellular-cholangiocarcinoma (CHC).

CHC is relatively rare, comprising < 1% of all PLCs

2

. Furthermore, CHC is classified into classical type and subtypes with stem-cell features including the typical subtype, intermediate-cell subtype, and cholangiolocellular subtype

2

. However, it is currently known that these “stem-cell” phenotypes may be detected in various forms of PLC, and that there is still room for consideration in the current WHO classification

4,5

. Transitional features from HCC to iCCA and intermediate features between HCC and iCCA are often observed in CHC. These findings suggest that CHCs are derived from hepatic progenitor cells. Previous studies revealed that hepatic progenitor cells and biliary tree stem/progenitor cells do exist in the smallest and most peripheral branches of the biliary tree (e.g., the ductules and canals of Hering) and in the peribiliary glands of normal bile ducts and in mucosal crypts of the gallbladder, respectively

6,7

.

According to the most recent paper regarding the terminology for PLC

8

, the usual CHC subtype with stem-cell features, intermediate-cell subtype was redefined as

“intermediate cell carcinoma (INT)”. The tumor cells of INT may be cuboidal to oval-shaped, with pale pink cytoplasm, and may form various structures such as strands, trabeculae, and solid nests. Elongated, ill-defined gland-like structure may also be present. Usually, mucin production is absent, and marked desmoplastic or acellular hyalinized stroma are observed. Even though immunohistochemical stains provide supplementary evidence, INT cells express both hepatocytic and cholangiocytic markers to various degrees

8,9

. Furthermore, INT may be combined with HCC, iCCA, and other stem-cell feature subtypes

8

.

Previous studies have revealed that stem-cell features are related to poor prognosis

10

,

(5)

5

and INT cells showed high proliferation activity

5

. These findings suggest that accurate identification of the INT component is necessary for its clinical management. Akiba et al previously demonstrated that arginase-1 and keratin (K) 8 are useful for the pathological diagnosis of INT

11

. However, no specific markers of INT have been established yet.

In this study, to identify a specific marker of INT, we examined the gene expression of INT by microarray analysis using formalin-fixed paraffin-embedded (FFPE) samples

12

, and subsequently examined the protein expression of potential key molecules identified in the microarray analysis by immunohistochemistry.

MATERIALS AND METHODS Microarray analysis

For RNA extraction, FFPE blocks from 6 INT cases, 5 iCCA cases, and 5 HCC cases were used. All these tumors consisted only of single histological component, i.e. “pure type”. Two serial sections of 7 µm thickness were obtained from FFPE blocks using a Leica RM2245 microtome (Leica Microsystem K.K., Tokyo, Japan), with an RNase-free water-treated blade. For each sample, one section was stained with hematoxylin and eosin (HE) whereas another section was used for extracting RNA. Referencing the previous mentioned HE-stain section, proper regions of cancerous and non-cancerous tissue were identified and separately scraped using blade treated with RNAase-free water.

For microarray analysis using Affymetrix GeneChip® Human X3P Array (Affymetrix,

Santa Clara, CA, USA), RNA from each sample was isolated, amplified, hybridized and

labeled in accordance with manufacturer’s instructions for Arcturus® Paradise® PLUS

Reagent System (Life Technologies, Grand Island, NY, USA) and GeneChip® 3′ IVT

Express Reagent kit (Affymetrix). The extracted RNA was measured using Nanodrop®

(6)

6

ND 1000 (Thermo Fisher Scientific, Waltham, MA, USA). The CEL files were processed using the affy package of R to obtain signal intensity values by RNA and present/absent calls by MAS5

12

.

Patients

In this study, we evaluated surgically resected liver tissues obtained from patients who underwent hepatectomy for PLC at Kurume University Hospital between 2000 and 2015. Relapse cases and cases with preoperative treatments, including both locoregional therapies (e.g. radiofrequency ablation and transcatheter arterial embolization) and systemic therapies (e.g. chemotherapy and molecular target drugs), were excluded.

Thus, we found 35 INT cases and 25 pure type iCCA cases, including the aforementioned 6 INT cases and 5 iCCA cases that could be evaluated by microarray analysis. However, there were over 800 pure type HCC cases between 2000 and 2015, and we randomly selected 60 cases from this population using a random number table.

Among 25 iCCA cases, 6 and 19 cases were diagnosed as well- and moderately-differentiated, respectively. Among the 60 HCC cases, 7, 50, and 3 cases were diagnosed as well-, moderately-, and poorly-differentiated, respectively.

Histology

Liver specimens were fixed in 10% buffered formalin, followed by paraffin embedding.

We cut consecutive 4-µm-thick sections and stained them with HE.

Pathological diagnosis was performed according to the 2010 WHO classification of tumours of the Digestive System

1-3

, which provides a detailed description of the histological appearance of INT. Representative photomicrographs of INT are shown in Figures 1a-c. According to the recent paper by Brunt et al

8

, PLC purely comprised of

“intermediate cells” referred to as INT. They also described that all PLCs have been

(7)

7

reported to occur alone or in combination with one another. Therefore, we included the INT cases combined other component(s) in this study and defined these cases as

“combined type”. Although 13 INT cases were combined type (11 cases with HCC, 1 case with iCCA and HCC, another 1 case with CHC stem-cell features, typical subtype), the INT components were predominant (>50%) in these cases.

The degree of fibrosis in the noncancerous liver tissue was assessed as follows: F0, no fibrosis; F1, fibrous portal expansion; F2, bridging fibrosis; F3, bridging fibrosis with lobular distortion (pre-cirrhosis); and F4, liver cirrhosis, according to the New Inuyama classification

14

.

Immunohistochemical analysis

We performed immunohistochemical (IHC) analysis on paraffin-embedded sections of the aforementioned INT, iCCA, and HCC cases using the following antibodies: Malic enzyme 1 (ME1) monoclonal antibody (316, dilution 1:2000, Thermo Fisher Scientific, Rockford, USA), hepatocyte paraffin (HepPar)-1 monoclonal antibody (OCH1E5, 1:100, Dako, Glostrup, Denmark), K7 monoclonal antibody (OV-TL 12/30, 1:100, Dako), and K19 monoclonal antibody (RCK108, 1:50, Dako). IHC was performed using the Ventana Benchmark system (Ventana Automated Systems Tucson, Arizona, USA).

In ME1 staining, the sinusoidal Kupffer cells and macrophages were strongly stained but other inflammatory cells were not. In addition, periportal and perivenular non-cancerous hepatocytes and portal cholangioles showed weak to moderate staining.

Therefore, we used sinusoidal Kupffer cells and macrophages as the internal positive controls (Figure 1d). Positive controls of other antibodies were defined as follows:

HepPar-1, normal hepatocytes; K7 and K19, normal biliary epithelial cells. The

expression of these molecules was mainly observed in the cytoplasm. We defined cells

with the same intensity as the positive control as “positive cells”.

(8)

8

The percentage of positive cells in tumors was scored as follows: score 0, no positive cell; score 1, positive cells < 1%; score 2, 1 ≤ positive cells < 10%; score 3, 10 ≤ positive cells < 33.3%; score 4, 33.3 ≤ positive cells < 66.7%; and score 5, 66.7% ≤ positive cells. In cases of combined type INT as described above, we only evaluated the INT component.

The histological diagnoses of each tumor were made by three pathologist (YM, JA, and HY) thorough careful conference. IHC analyses were evaluated by two pathologists (YM and RK) independently, and IHC scores were almost accorded between them. In the cases with discordance, the scores were decided thorough discussion.

Statistical analysis

The microarray analysis results were subjected to statistical analyses using R packages

15

, and p < 0.01 was regarded as statistically significant. In addition, the correlation between gene expression obtained from microarray analysis and immunohistochemical score was examined using polyserial correlation.

The association between clinicopathological parameters and histological diagnosis was examined by ANOVA, Fisher’s exact test, and Log rank test depending on the type of data.

Specific ability of ME1, HepPar-1, K7, and K19 to discriminate three groups was examined by following statistical procedures. Because of asymmetrical associations between disease groups and four biomarkers, classification and regression trees (CART)

16

were used to partition disease groups. Based on the results of CART, logistic

regression was employed to further identify specific associations between biomarkers

and disease groups by constructing composite score of biomarkers. ROC curve analyses

were also conducted to estimate accuracy of discriminative abilities based on sensitivity

and specificity of composite score of biomarkers. JMP Pro 13.2.0 and Stata 15 were used

to evaluate the clinicopathological parameters and IHC results, respectively, and the

(9)

9

differences were considered statistically significant at p < 0.05.

In principle, p-values obtained from multiple comparisons amongst three groups are shown. However, in cases where further comparison between two groups was performed, this has been specifically mentioned.

Ethical statement

This study was approved by the ethical committee of Kurume University (approved No.

370) and conformed to the 1964 Declaration of Helsinki and its later amendments or comparable ethical standards. Clinical samples were collected from patients after written informed consent was obtained.

RESULTS

Microarray analysis

The expression of 47,000 genes was examined by microarray analysis. We evaluated the genes showing significant differences in expression (enhanced or decreased expressed) between cancerous tissues and non-cancerous liver tissues in each group.

Comparison of the 3 groups of these genes revealed that 91 genes showed significantly and specifically different expression in INT compared to in iCCA and HCC (Figure 2, Table 1). Of the 91 genes, we focused on ME1 , which showed the highest expression in INT compared to in iCCA and HCC.

Clinicopathological findings

The clinicopathological findings of each group are summarized in Table 2. The ratio of

patients infected with hepatitis virus (HCV and/or HBV) was significantly lower in INT

than in HCC. In the context of fibrosis of the non-cancerous liver tissue, the frequency of

F4 and F3 was significantly higher in INT than in iCCA (INT 51.4% (18/35), iCCA 4.0%

(10)

10

(1/25), and HCC 35.0% (21/60); p<0.0001, overall; p<0.0001, INT vs iCCA). Although vascular invasion was more frequently observed in INT and iCCA than in HCC, there were no significant differences among the three groups. Five-year-survival rates of INT, iCCA, and HCC were 49.5% (SE9.5), 37.9% (SE11.0), and 74.8% (SE6.8), respectively.

INT showed significantly worse prognosis than HCC (Figure 3).

Immunohistochemical analysis

The expression of ME1, HepPar-1, K7, and K19 was observed in the cytoplasm of tumor cells. The summary of IHC scores is shown in Table 3. Representative histological and IHC findings of each group are shown in Figure 4.

Although statistical significance was not reached in cases used for microarray analysis (6 cases for INT, 5 cases for HCC, 5 cases for iCCA), ME1 gene expression and IHC score for ME1 tended to show a positive correlation (correlation coefficient 0.57, p-value 0.069, polyserial correlation).

Amongst the INT group, combined type INT (n=13) had a significantly higher ME1 score compared to the pure type (n=22) (mean score: combined type 2.92 (SD1.1) vs pure type 1.86 (SD1.5), p=0.027, Wilcoxon rank-sum test), whereas no significant differences were noted in the score of other markers.

In the present study, there was no statistical difference between ME1 scores and prognosis in each group. However, the analysis of INT subgroups (combined / pure type) demonstrated a tendency for a poor prognosis for the combined type compared to the pure type; 5-year-survival rate: combined type 33.3% (SE1.5), pure type 58.5% (SE1.1), no significant difference.

Analysis using classification and regression trees based on IHC scores revealed that

when the cut-off value of the HepPar-1 score was set to 2, HCC and the other two groups

(INT and iCCA) could be discriminated at a sensitivity of 93.3% (95% C.I. 83.80–98.15)

(11)

11

and specificity of 96.7% (95% C.I. 88.47–99.59). Next, multiple logistic regression models and ROC curve analyses were performed using ME1, K7, and K19 scores to differentiate INT and iCCA, and a simplified composite score : 1 × (ME1 score) – 1 × (K7 score) – 1 × (K19 score) was derived. Using this composite score, when the cut-off value was set to –4, patients with a score ≥ –4 were diagnosed with INT with a sensitivity of 88.6% (95% C.I. 73.26–96.80) and specificity of 88.0% (95% C.I. 68.78–97.45).

DISCUSSION

A detailed morphological observation is strongly recommended during the pathological diagnosis of CHC. Both scirrhous type HCC and K-7- or K19-positive HCC can be differential diagnosis of INT, however, these tumors mainly have typical HCC cell forms and can be differentiated with careful morphological observation.

3,17-19

On the other hand, due to wide structural diversities, such as strands and gland-like structures and marked desmoplastic stroma, INT may be misdiagnosed as iCCA

8

. In the pathological diagnosis in CHC, IHC staining is helpful, but not essential. However, well-established diagnostic markers would be useful.

In this study we probed a specific marker of INT using microarray analysis and identified ME1. Moreover, we confirmed that ME1 could be a useful marker in the pathological diagnosis of INT.

Previous reports demonstrated that CHC with stem-cell features including INT showed more malignant potential (i.e. worse prognosis and high proliferative activity) compared with HCC

5,10

, and these findings are similar to the present study. Therefore, accurate diagnosis of INT is essential for clinical management.

Malic enzymes are the tricarboxylic acid cycle-associated metabolic enzymes that

catalyze the oxidative decarboxylation of malate to generate pyruvate and either NADH

or NADPH, and are associated with glutamine metabolism and lipogenesis

20-22

. In

(12)

12

mammalian cells, three isoforms have been identified to date: ME1, cytoplasmic NADP

+

-dependent isoform; ME2, mitochondrial NADP

+

-dependent isoform, and ME3, mitochondrial NADP

+

-dependent isoform. ME1 and ME2 are the main isoforms in human cells

22

. In accordance with these findings, ME1 staining was observed in cytoplasm in this study. ME1 contributes to maintain the cellular redox balance by producing NADPH, which acts as a key factor for both reductive and antioxidative systems

23-25

. In addition, Yao et al revealed that ME1 enhances pentose phosphate pathway, which is another major route for generating cellular NADPH, through direct binding and activating 6-phosphogluconate dehydrogenase

26

. Recent studies have revealed that various human cancers, including HCC, express ME1

27-34

. Through these metabolic systems, ME1 may contribute to protect cancer cells from reactive oxygen species (ROS) which induce cellular damage and may play an important role in the survival of cancer cells and treatment-resistance

27-34

. Furthermore, it is thought that ME1 participate in migratory ability of cancer cells by promoting epithelial mesenchymal transition (EMT)

27,28,34

. Through these processes, ME1 enhances the proliferative activity and invasive ability of tumor cells and correlates with poor prognosis. Thus, ME1 seems to be a marker for aggressive biological features.

In the present study, more than 1% of tumor cells (i.e. score ≥ 2) were positive for ME1 in 77.1% (27/35) of INTs, whereas in only 24.0% (6/25) of iCCAs. Our scoring formula using ME1, K7, and K19 can discriminate between INT and iCCA with a sensitivity and specificity of 88.6% and 88.0%, respectively. This finding suggested that ME1 is a useful marker for discriminating INT and iCCA in combination with K7 and K19.

However, more than 1% of the tumor cells were positive for ME1 also in 51.7% (31/60)

of HCCs. Wen et al reported that all 65 cases of HCCs examined, expressed ME1 and

53.8% (35/65) of these cases demonstrated high expression of ME1

28

. Furthermore, high

expression of ME1 was associated with poor prognosis in HCC. These results of IHC

(13)

13

analysis were similar to our study, however, there was no statistical difference between ME1 expression scores and prognosis in any histological type in our study. While the exact reason for the differences observed between the studies are not known, technical issues and/or differences in assessment could have caused the differences in the results.

In our study, only 20.0% (7/35) of INTs showed HepPar-1 positive cells (i.e. score ≥ 1).

Moreover, there was no case with a HepPar-1 score ≥ 4 in INT. Similarly, in a study of Akiba et al, which did not take into account the expression intensity of immunostaining, as few as 28.1% of INTs were HepPar-1 positive

11

and there are arguably not many cases where INTs displayed strong expression of HepPar-1. Our result demonstrated that a case with a HepPar-1 score ≥ 2 may be diagnosed as HCC with high sensitivity (93.3%) and high specificity (96.7%). Therefore, it is important to evaluate the presence of cells showing strong HepPar-1 staining to discriminate between HCC and others (INT and iCCA). Consequently, we advocate the diagnostic algorithm of detecting INT (Figure 5).

Recent studies reported that ME1 metabolism is regulated by a mutation of major oncogenes or antioncogenes, such as KRAS , myc , or TP53

24,29,31,32,35

. Liu et al reported that TP53 , RYR3 , FBN2 , CTNNB1 , and ARID1A were mutated in CHC

36

; however, the subtype of CHC was not mentioned. Sasaki et al also reported that CHC including INT showed mutation in KRAS , IDH1/2 , ARID1A , TERT , and TP53

37

. These studies suggested that INT upregulates ME1 possibly by mutation of oncogenes, such as KRAS and TP53 . Further studies of the correlation between oncogenic mutations and ME1 expression, mutations in the ME1 gene itself, and other factors are needed.

As a previous report demonstrated

33

, it is difficult to evaluate ME1 staining because of

marked heterogeneities in both the proportion and intensity of the stain. Therefore, it is

important to define the internal control, as has been done here. In this study, we did not

evaluate the proportion of cells stained weakly and moderately by each antibody.

(14)

14

In recent years, in addition to conventional poor prognostic factors (tumor diameter, portal invasion, clinical stage, etc.), molecular biological prognostic factors have been explored in HCC. Egawa et al found that Forkhead box M1 (FoxM1) is an independent poor prognostic factor and showed its possible application as a treatment target

38

. Likewise, several past studies

27-34

indicated the possible applications of ME1 for HCC as poor prognostic factor or a treatment target. In our study, however, in terms of both HCC and INT, as no associations were found in immunohistochemical scores between ME1 and prognosis, this will require further study.

This study has some limitations. First, this study included only a small number of INT samples due to its rarity. Studies using a large cohort should be performed to clarify the pathological and molecular characteristics of INT. Second, we included 13 cases of INT combined with other component(s); however, in all cases, INT component was predominant (>50%). At this moment, there is no clear definition of INT in terms of the percentage of INT component in the WHO classification

2

. Well-established diagnostic criteria are needed. Furthermore, we did not investigate other subtypes of CHC stem cell features (i.e. the typical subtype and the cholangiolocellular subtype). It is not known if ME1 can help distinguishing these subtypes, and the diagnostic challenge still remains. Hence, in future studies, we intend to determine the similarities and/or differences between INT and these subtypes. Moreover, other candidate genes, such as CPD and DNMT1 , detected by microarray analysis are our next research targets.

In conclusion We propose that ME1 is a potential diagnostic marker of INT in combination with other hepatocytic and cholangiocytic markers (HepPar-1, K7, and K19).

Acknowledgments

This work was supported in part by JSPS Grant-in-Aid for Scientific

(15)

15

Research(C)(JP18K07032). The authors thank Yoshihisa Nozawa, Shinji Oie, Akiko

Tanaka, and Sachiyo Maeda for their assistance in our experiments.

(16)

16

REFERENCES

1. Bosman FT, Carneiro F, Hruban RH, Theise ND. WHO Classification of Tumours of the Digestive System . Lyon: IARC Press, 2010.

2. Theise ND, Nakashima O, Park YN, Nakanuma Y. Combined hepatocellular-cholangiocarcinoma. In: Bosman FT, Carneiro F, Hruban RH, Theise ND, editors. WHO Classification of Tumours of the Digestive System . Lyon: IARC Press, 2010; 225-7.

3. Theise ND, Curado MP, Franceschi S, et al. Hepatocellular carcinoma. In: Bosman FT, Carneiro F, Hruban RH, Theise ND, editors. WHO Classification of Tumours of the Digestive System . Lyon: IARC Press, 2010; 205-16.

4. Akiba J, Nakashima O, Hattori S, et al. Clinicopathologic analysis of combined hepatocellular-cholangiocarcinoma according to the latest WHO Classification. Am J Surg Pathol. 2013; 37: 496-505.

5. Sasaki M, Sato H, Kakuda Y, Saito Y, Nakanuma Y. Clinicopathological significance of ‘subtypes with stem-cell feature’ in combined hepatocellular-cholangiocarcinoma.

Liver Int. 2015; 35: 1024-35.

6. Roskams TA, Theise, ND, Balabaud C, et al. Nomenclature of the finer branches of the biliary tree: canals, ductules, and ductular reactions in human livers. Hepatology.

2004; 39: 1739-45.

7. Maraldi T, Guida M, Beretti F, et al. Human biliary tree stem/progenitor cells immunomodulation: Role of hepatocyte growth factor. Hepatol Res. 2017; 47: 465-479.

8. Brunt E, Aishima S, Clavien PA, et al. cHCC-CCA: Consensus terminology for primary liver carcinomas with both hepatocytic and cholangiocytic differentation.

Hepatology. 2018; 68: 113-26.

9. Kim H, Park C, Han KH, et al. Primary liver carcinoma of intermediate

(hepatocyte-cholangiocyte) phenotype. J Hepatol. 2004; 40: 298-304.

(17)

17

10. Ikeda H, Harada K, Sato Y, et al. Clinicopathologic significance of combined hepatocellular-cholangiocarcinoma with stem cell subtype component with reference to the expression of putative stem cell markers. Am J Clin Pathol. 2013; 140: 329-40.

11. Akiba J, Nakashima O, Hattori S, et al. The expression of arginase-1, keratin (K) 8 and K18 in combined hepatocellular-cholangiocarcinoma, subtypes with stem-cell features, intermediate-cell type. J Clin Pathol. 2016; 69: 846-51.

12. Nakamura K, Akiba J, Ogasawara S, et al. SUOX is negatively associated with multistep carcinogenesis and proliferation in oral squamous cell carcinoma. Med Mol Morphol. 2018; 51: 102-10.

13. Gautier L, Cope L, Bolstad BM, Irizarry RA. affy—analysis of Affymetrix GeneChip data at the probe level. Bioinformatics. 2004; 20: 307-15.

14. Ichida F, Tsuji T, Omata M, et al. New Inuyama classification; new criteria for histological assessment of chronic hepatitis. Int J Comm. 1996; 6: 112-9.

15. R Core team (2018). R: A language and environment for statistical computing. R Foundation for Statistical Computing. Vienna, Austria, https://www.R-project.org/.

16. Zhang H, Singer B. Recursive Partitioning in the health sciences . Statistic for Biology and Health. Springer; 1999.

17. Kurogi M, Nakashima O, Miyaaki H, Fujimoto M, Kojiro M. Clinicopathological study of scirrhous hepatocellular carcinoma. J. Gastroenterol. Hepatol. 2006; 21:

1470-77.

18. Kim YJ, Rhee H, Yoo JE, et al. Tumour epithelial and stromal characteristics of hepatocellular carcinomas with abundant fibrosis stroma: fibrolamellar versus scirrhous hepatocellular carcinoma. Histopathology. 2017; 71: 217-26.

19. Kim H, Choi GH, Na DC, et al. Human hepatocellular carcinomas with

“stemness”-related marker expression: keratin 19 expression and poor prognosis.

Hepatology. 2011; 54: 1707-17.

(18)

18

20. Chang GG, Tong L. Structure and function of malic enzymes, a new class of oxidative decarboxylases. Biochemistry. 2003; 42: 12721-33.

21. Heart E, Cline GW, Collis LP, Pongratz RL, Gray JP, Smith PJ. Role for malic enzyme, pyruvate carboxylation, and mitochondrial malate import in glucose-stimulated insulin secretion. Am J Physiol Endocrinol Metab. 2009; 296:

1354-62.

22. Pongratz RL, Kibbey RG, Shulman GI, Cline GW. Cytosolic and mitochondrial malic enzyme isoforms differentially control insulin secretion. J Biol Chem. 2007; 282: 200-7.

23. Vander Heiden MG, Cantley LC, Thompson CB. Understanding the Warburg effect:

the metabolic requirements of cell proliferation. Science. 2009; 324: 1029-33.

24. Son J, Lyssiotis CA, Ting H, et al. Glutamine supports pancreatic cancer growth through a KRAS-regulated metabolic pathway. Nature. 2013; 496: 101-5.

25. Altman BJ, Stine ZE, Dang CV. From Krebs to clinic: glutamine metabolism to cancer therapy. Nat Rev Cancer. 2016; 16: 619-34.

26. Yao P, Sun H, Xu C, et al. Evidence for direct cross-talk between malic enzyme and the pentose phosphate pathway via structural interactions. J Biol Chem. 2017;292(41):

17113-20.

27. Zheng FJ, Ye HB, Wu MS, Lian YF, Qian CN, Zeng YX. Repressing malic enzyme 1 redirects glucose metabolism, unbalances the redox state, and attenuates migratory and invasive abilities in nasopharyngeal carcinoma cell lines. Chin J Cancer. 2012; 31:

519-31.

28. Wen D, Liu D, Tang J, et al. Malic enzyme 1 induces epithelial-mesenchymal transition and indicates poor prognosis in hepatocellular carcinoma. Tumor Biol. 2015;

36: 6211-21.

29. Chakrabarti G. Mutant KRAS associated malic enzyme 1 expression is a predictive

marker for radiation therapy response in non-small cell lung cancer. Radiat Oncol.

(19)

19

2015; 10: 145.

30. Woo SH, Yang LP, Chuang CH, et al. Down-regulation of malic enzyme 1 and 2:

Sensitizing head and neck squamous cell carcinoma cells to therapy-induced senescence.

Head Neck. 2016; 38 Suppl 1: E934-40.

31. Shen H, Xing C, Cui K, et al. MicroRNA-30a attenuates mutant KRAS-driven colorectal tumorigenesis via direct suppression of ME1. Cell Death Differ. 2017; 24:

1253-62.

32. Murai S, Ando A, Ebara S, Hirayama M, Satomi Y, Hara T. Inhibition of malic enzyme 1 disrupts cellular metabolism and leads to vulnerability in cancer cells in glucose-restricted conditions. Oncogenesis. 2017; 6: e329.

33. Nakashima C, Yamamoto K, Fujiwara-Tani R, et al. Expression of cytosolic malic enzyme (ME1) is associated with disease progression in human oral squamous cell carcinoma. Cancer Sci. 2018; 109: 2036-45.

34. Liu M, Chen Y, Huang B, et al. Tumor-suppressing effects of microRNA-612 in bladder cancer cells by targeting malic enzyme 1 expression. Int J Oncol. 2018; 52:

1923-33.

35. Jiang P, Du W, Mancuso A, Wellen KE, Yang X. Reciprocal regulation of p53 and malic enzymes modulates metabolism and senescence. Nature. 2013; 493: 689-93.

36. Liu ZH, Lian BF, Dong QZ, et al. Whole-exome mutational and transcriptional landscapes of combined hepatocellular cholangiocarcinoma and intrahepatic cholangiocarcinoma reveal molecular diversity. Biochim Biophys Acta. 2018; 1864:

2360-68.

37. Sasaki M, Sato Y, Nakanuma Y. Mutational landscape of combined hepatocellular carcinoma and cholangiocarcinoma, and its clinicopathological significance.

Histopathology. 2017; 70: 423-34.

38. Egawa M, Yoshida Y, Ogura S, et al. Increased expression of Forkhead box M1

(20)

20

transcription factor is associated with clinicopathological features and confers a poor prognosis in human hepatocellular carcinoma. Hepatol Res. 2017; 47: 1196-205.

Figure legends

Figure 1. Histological appearance of INT and positive internal controls of ME1 staining.

(a-c) Typical structures of INT (HE); cord-like and small solid nests (a. scale bar = 50µm), trabeculae, strands and gland-like structures (b. scale bar = 50µm), with marked desmoplastic or acellular hyalinizes stroma. The tumor cells are cuboidal to oval-shaped, with pale or pink cytoplasm (c. scale bar = 20µm).

(d) Sinusoidal Kupffer cells (arrows) are strongly stained by ME1 (d. scale bar = 20µm).

Figure 2. Heat map based on microarray analysis.

First, we evaluated the genes that showed different expression patterns compared with the non-cancerous liver tissue in each group (INT, iCCA, and HCC). Subsequently, we detected 91 genes that specifically showed a change in expression in INT compared with iCCA and HCC.

Figure 3. Overall survival of INT, iCCA, and HCC (Kaplan-Meier analysis).

Five-year-survival rates were 49.5% (SE9.5), 37.9% (SE11.0), and 74.8% (SE6.8) in INT, iCCA, and HCC, respectively. INT shows significantly worse prognosis compared with HCC.

Figure 4. Representative IHC findings of INT, iCCA, and HCC (HE and IHC. scale bar = 50µm).

INT case showing (a) strong-positive staining of ME1 (d), weakly stained HepPar-1 (g),

moderately stained K7 (j) and K19 (m). iCCA case showing (b) strong-positive staining

(21)

21

of K7 (k) and K19 (n), but negative for ME1 (e) and HepPar-1 (h). HCC case showing (c) strong-positive staining of HepPar-1 (i) and heterogenous staining of ME1 (f), but negative for K7 (l) and K19 (o).

Figure 5. Proposed algorithm of pathological diagnosis for INT. Composite score can

discriminate between INT and iCCA with high sensitivity and specificity. *Composite

score = 1 × (ME1 score) – 1 × (K7 score) – 1 × (K19 score).

(22)

Figure.1

(23)

Figure.2

(24)

Figure.3

(25)

Figure.4

(26)

Figure.5

(27)

Table 1:

Representative significantly different genes in INT compared with iCCA and HCC

Average log2 ratio to the matched non-tumor sample

INT iCCA HCC P-value

Upregulate

ME1 3.21 0.46 0.55 0.0019

CPD 2.52 0.40 0.17 0.0016

DNMT1 2.18 0.30 0.37 0.0019

FAM122B 1.84 0.58 0.01 0.0077

ARNT2 1.69 0.23 0.21 0.0021

PHF12 1.62 0.43 0.37 0.0028

RACGAP1 1.54 0.47 0.11 0.0038

E2F3 1.52 0.41 0.34 0.0017

Downregulate

MTND2P28///ND2 -1.37 -0.54 0.30 0.0050

COX3 -1.34 -0.46 0.39 0.0030

CCDC69 -1.29 -0.16 -0.03 0.0023

CD52 -1.29 -0.53 -0.21 0.0012

Representative genes that were significantly upregulated or downregulated in INT

compared with iCCA and HCC are listed in order of magnitude of average log2 ratio to

the matched non-tumor sample. The p-value indicates differences among all three

groups obtained by multiple comparisons.

Abbreviations: ME1 , malic enzyme 1; CPD , carboxypeptidase D; DNMT1 , DNA

(cytosine-5-)-methyltransferase 1; FAM122B , family with sequence similarity 122B;

ARNT2 , aryl-hydrocarbon receptor nuclear translocator 2; PHF12 , PHD finger protein

12; RACGAP1 , Rac GTPase activating protein 1; E2F3 , E2F transcription factor 3;

(28)

MTND2P28///ND2 , MT-ND2 pseudogene 28 /// MTND2; COX3 , cytochrome c oxidase III;

CCDC69 , coiled-coil domain containing 69; CD52 , cluster of differentiation 52.

(29)

Table 2: Summary of clinicopathological findings

INT iCCA HCC P-value

Case 35 25 60

Age, average ± SD 67.2 ±11.5 63.2 ±12.0 68.5 ±10.7 0.1461 Male : female 28 : 7 15 : 10 43 : 17 0.2378 Virus infection 17 (48.6%) 10 (40.0%) 43 (71.7%) 0.0094

INT vs HCC

0.0293

INT vs iCCA

0.6024

Tumor size, average 40.4 ± 23.2 47.1 ± 19.6 34.9 ± 24.9 0.0895 (mm ± SD)

Vascular invasion 25 (71.4%) 19 (76.0%) 34 (56.7%) 0.1461 Intrahepatic metastasis 6 (17.1%) 6 (24.0%) 10 (16.7%) 0.7236 Liver fibrosis (F0/F1,2/F3,4) 2/15/18 12/12/1 1/38/21 <0.0001

INT vs HCC

0.1027

INT vs iCCA

<0.0001

Abbreviations: SD, standard deviation; INT, intermediate cell carcinoma; HCC,

hepatocellular carcinoma; iCCA, intrahepatic cholangiocarcinoma. “Virus infection”

means infection of hepatitis C virus and/or hepatitis B virus.

The p-value indicates differences among all three groups obtained by multiple

comparisons, except for ( † ), wherein the p-value was obtained from a comparison

between two groups.

(30)

Table 3: Summary of immunohistochemistry analysis.

Distribution of positive cells (score: 0/1/2/3/4/5)

Group INT iCCA HCC P-value

Case 35 25 60

ME1 8/ 0/ 9/ 11/ 7/ 0 18 / 1/ 5/ 1/ 0/ 0 23/ 6/ 11/ 11/ 7/ 2 0.0020 HepPar-1 28/ 5/ 1/ 1/ 0/ 0 25/ 0/ 0/ 0/ 0/ 0 3/ 1/ 6/ 20/ 18/ 12 <0.0001 K7 14/ 2/ 4/ 7/ 7/ 1 1/ 0/ 1/ 4/ 5/ 14 53/ 4/ 2/ 0/ 1/ 0 <0.0001 K19 19/ 3/ 3/ 8/ 2/ 0 1/ 0/ 5/ 4/ 9/ 6 58/ 2/ 0/ 0/ 0/ 0 <0.0001

Abbreviations: INT, intermediate cell carcinoma; iCCA, intrahepatic

cholangiocarcinoma; HCC, hepatocellular carcinoma; ME1, malic enzyme 1; HepPar-1,

hepatocyte paraffin-1; K, keratin

The p-value indicates differences among all three groups obtained by multiple

comparisons.

Table 2: Summary of clinicopathological findings
Table 3: Summary of immunohistochemistry analysis.

参照

関連したドキュメント

(24) Similarly, T26 inhibited both Pim-3 kinase activity in a cell-free system and in vitro cell proliferation of human pancreatic cancer cell lines at micromo- lar

NELL1 (a) and NELL2 (b) mRNA expression levels in renal cell carcinoma cell lines OS-RC-2, VMRC-RCW, and TUHR14TKB and control HEK293T cells were analyzed using quantitative

Although mouse NS was included in the leukaemia stem cell gene signature, NS expression levels were not significantly different among AML patient clusters in our study (data

Since our previous trial of preemptive therapy with foscarnet sodium (PFA) failed to prevent HHV-6 encephalitis, we conducted a prospective study to examine the safety of

After the cell divisions of the immediate sister cell and its daughter cells (figure 1a, the green cells), the gametophore apical stem cell divided again to produce a new

If the latter interpretation is the case, the observed rate of NAD incorporation in tissue sections may represent the varying maximal capacity of the cells to

Histologic appearance varies markedly from area to area in the same case, varying from vascular granulation tissue heavily in filtrated with both plasma cells and lymphocytes to

 In conclusion, IFN-α alternation therapy is one treatment option for mRCC patients in whom first- line IFN-α treatment failed if the patient has only lung or