Study of the Triplet and Singlet States of Ir(ppy)
3by the Excitation Spectra for Photoluminescence
Taiju TSUBOI
Research Institute of Advanced Technology, Kyoto Sangyo University, Kyoto 603-8555, Japan
Abstract
Photoluminescence of phosphorescent molecule tris(2-phenylpyridine) iridium (Ir(ppy)3) has been studied in the neat film and film of Ir(ppy)3 doped in CBP. Weak absorption bands at 485, 451 and 406 nm are attributed to the metal-ligand charge transfer triplet state (3MLCT) from the excitation spectra for the green emission. Additional emission band with a peak at 396 nm and a broad sideband at about 423 nm are observed in the neat film. The 396 nm emission is much weaker than the green emission. Its intensity in- creases with decreasing temperature from 300 K to about 100 K, and becomes constant at 100-10 K. This emission is attributed to the emission from the singlet state 1MLCT which gives rise to absorption band at 386 nm. The conversion of the intersystem crossing from the singlet state to the triplet state is estimated to be 98.7%. From difference of excitation spectra between the films doped and non-doped in CBP, we suggest energy transfer from the n = 1 vibrational state of Ir(ppy)3 dopant to the n = 0 vibrational state of CBP host.
Discussion is given on the vibronic structure observed in the emission and excitation spec- tra by comparing with the observed Raman spectrum.
1. Introduction
Displays based on organic light emitting diodes (OLEDs) are the best candidate for creating flexible, full-color, thin flat-panel displays, because they are more functional than the current liquid-crystal displays (LCDs). The most peculiar advantage is the possibility of roll-up or conformal display on the curved surfaces. The OLED displays are considered as a future display with high performance including high brightness, low manufacturing cost, fast response and low voltage operation. The OLED display can emit bright light without the pronounced directionality inherent in LCD viewing, with high efficiencies. It is expected that portable and lightweight roll-up OLED displays will replace the bulky and power-consuming cathode ray tube that has been the television standard for half century.
To realize the OLEDs that can emit highly bright light and keep long operational lifetime, we have to find organic materials good for OLED devices. For this purpose we have to under stand the optical processes of the light-emitting materials.
Phosphorescent organic materials are interested as the emitting materials for OLEDs.
Because, the ratio between fluorescent singlet and phosphorescent triplet states is 1 : 3,
therefore the harvesting of triplets is expected to increase the electroluminescence (EL) quantum efficiency
1,2). Several transition metal complexes like fac tris(2-phenylpyridine) iridium (Ir(ppy)
3) certainly show a relatively high quantum efficiency. Optical process in the EL and photoluminescence (PL) should be clarified to find highly efficient phosphores- cent materials. A considerable amount of study has been made for the optical properties of Ir(ppy)
3experimentally. However, there are several unclear properties and electronic states, e.g. emission from the singlet state, difference of emission spectra between the spin- coating and evaporated films, and absorption bands due to the triplet states.
Two weak absorption bands are observed at about 485 and 451 nm at the low energy of the intense singlet absorption bands at 386 nm in
fac tris(2-phenylpyridine) iridium(Ir(ppy)
3) neat film
3). The same bands also observed in Ir(ppy)
3doped in 4,4’-N,N’-dicarba- zole-biphenyl (CBP), polystyrene, toluene, chloroform (CHCl
3), dichloromethane (CH
2Cl
2) and tetrahydrofuran
4-6). These 485 and 451 nm bands are attributed to the triplet states.
Another band is observed at about 406 nm at the low energy of the 386 nm band. It has not been established yet whether the 406 nm band is attributed to the singlet state or the triplet state. Hay calculated the energy levels of Ir(ppy)
3using time-dependent density functional theory (TDDFT)
7). The calculated triplet energy levels locate between 2.59 eV (about 479 nm) and 3.10 eV (400 nm). The calculated singlet levels locate between 2.80 eV (about 443 nm) and 3.39 eV (366 nm). It is necessary to clarify the origins of absorp- tion bands at 485, 451 and 406 nm. In Ir(ppy)
3doped in CBP, energy transfer has been suggested to occur from the CBP host to the Ir(ppy)
3dopant, because the triplet state of Ir(ppy)
3is at 0.13 eV below the triplet state of CBP
8). It is interesting to clarify whether the back energy transfer from the Ir(ppy)
3dopant to the host occurs. The present work was undertaken to investigate these points.
2. Experimental procedure
Two OLEDs were used for the optical measurements. One (Ir#0) is composed of a single layer (emitting layer) sandwiched between the two electrodes of Al and ITO. The emit- ting layer consists of only the 100% Ir(ppy)
3(i.e. without doping in host). The other (Ir#1) is multi-layer type, where the emitting layer is formed by 2.9wt% Ir(ppy)
3doped in CBP.
The Ir#1 consists of ITO anode, hole-transport layer of N,N’-bis(1-naphtyl)-N,N’-diphenyl- 1,1’-biphenyl-4,4’-diamine (α-NPD or called NPB), emitting layer of Ir(ppy)
3-doped in CBP, hole-blocking layer of 2,9-dimethyl-4,7-diphenyl-1,10-phenanthroline (BCP), electron transport layer of aluminum tris 8-hydroxyquinoline (Alq
3), and Al cathode. The struc- tures are
Ir#0: ITO/Ir(ppy)
3(50 nm)/LiF/Al
Ir#1: ITO/α-NPD (25 nm)/2.9wt%Ir(ppy)
3:CBP (35 nm)/BCP (10 nm)/Alq
3(40 nm)/Al (100 nm),
where layer thickness is indicated. These OLEDs were fabricated in thermal evaporation
method. In addition to these OLEDs, a 50 nm thick Ir(ppy)
3film (without doping in host material) evaporated on a quartz plate is also used for the measurement.
Optical absorption spectra were measured with a Cary 5E spectrophotometer in a spec- tral range of 190–3100 nm. Photoluminescence spectra were measured at various temper- atures between 10 K and 300 K with a Spex Fluorolog-3 fluorophotometer. The excitation source was a 450 W Xe-lamp. Corrections were made for the luminescence spectrum wave- length sensitivity. Filters were used to avoid the half and second harmonics of the exciting light. Emission spectra and excitation spectra were recorded. The emission and excitation spectra were observed through the glass plate of the Ir#0 and Ir#1 OLEDs, thus the spec- tra shorter wavelength than about 340 nm are not reliable because of strong absorption by the glass.
Raman scattering was measured with a Jobin Yvon LabRam HR-800 Raman spectrom- eter at room temperature. A 6 mW He-Ne laser was used for the excitation. The Raman spectrum was measured for a 50 nm thin film of Ir(ppy)
3which is evaporated on a quartz plate.
3. Experimental results
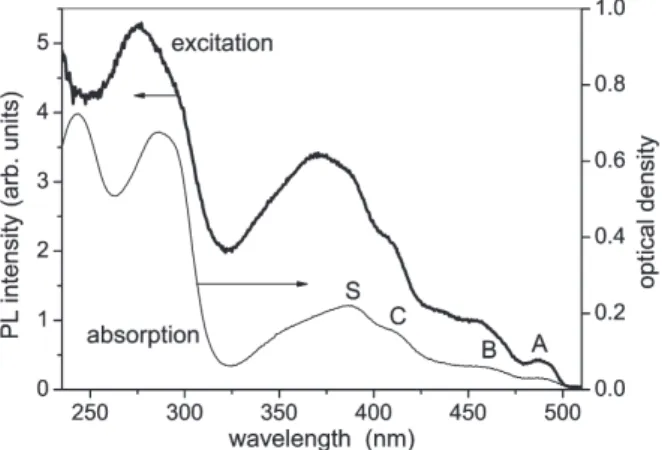
Figure 1 shows the absorption spectrum of a 50 nm thick film of Ir(ppy)
3at 15 K. Ab- sorption bands are observed at about 486, 456, 406, 386, 354, 284, 242 nm, where the first four bands are called A, B, C and S, respectively hereafter. The spectrum at 285 K is almost the same as the spectrum at 15 K although the resolution among the A, B and C bands is a little higher in the latter spectrum than in the former one. In Fig. 1 is also shown the excitation spectrum for 540 nm emission at 15 K. The excitation spectrum al- most corresponds to the absorption spectrum, i.e. the excitation bands are observed at the same wavelengths as the absorption bands, except two intense excitation bands at 369
Fig. 1. Absorption and excitation spectra of a 50 nm thick film of Ir(ppy)3 at 15 K. The excitation spectrum was obtained for 540 nm emission in the green emission band due to Ir(ppy)3.
and 274 nm. The observation of the 369 and 274 nm bands indicates the presence of these absorption bands which are hidden under the intense 386 and 284 nm absorption bands, respectively. The reason why, unlike the case of absorption spectrum, the 369 nm band appears more intensely in the excitation spectrum than the 386 nm band is unclear at this moment.
Ir(ppy)
3is known to show a broad emission band with a peak at about 515 nm and a shoulder at about 540 nm. Figure 2 shows the excitation spectra for the green emission in Ir#0 and Ir#1. Curve 1 of Fig. 2 (Ir#0) consists of four excitation bands which corresponds to the absorption bands of Ir(ppy)
3(regarding the excitation spectra, see Appendix). Curve 2 of Ir#1 in Fig. 2 has intense excitation bands with peaks at about 390 and 345 nm and very weak band at 486 nm. Alq
3and CBP materials are contained in Ir#1 device. Alq
3has a broad absorption band at about 390 nm and a broad emission band with a peak at about 525 nm
9). Therefore the excitation band at 390 nm is attributed to Alq
3. CBP has an absorption band at about 345 nm with a tail extended to 365 nm
4)and an fluorescence band with a peak at about 390 nm
10,11). Therefore it is suggested that the intense peak at 345 nm of Curve 2 is attributed to CBP host present in the emitting layer of Ir#1. Appear- ance of the 345 nm excitation band indicates that energy transfer occurs from CBP host excited optically to the Ir(ppy)
3dopant. Such an energy transfer is possible because of strong spectral overlap between the 390 nm emission band of CBP and absorption band of Ir(ppy)
3.
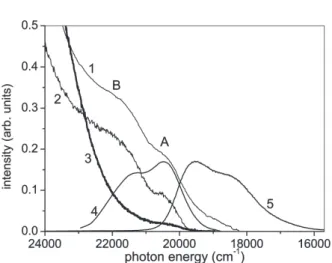
Figure 3 shows the emission and excitation spectra in a range between 416.7 nm (about 24000 cm
–1) and 645.2 nm (about 15500 cm
–1) at 285 K, together with absorption spectrum at 285 K (curve 1). It is noted that Ir#0 shows the excitation bands at the A, B and C bands, while Ir#1 shows an excitation band at the A band but at neither the B band nor the C band (see also Fig. 2). We tried to find the excitation band at the B band position in
Fig. 2. Semi-log plotted excitation spectra for 540 nm emission in Ir#0 (curve 1) and Ir#1 (curve 2) at 285 K.
Ir#1 several times, but we could not observe it.
The A and B absorption bands are superimposed on the low energy tail of the intense S band due to the singlet state. To derive the A and B absorption band shapes we subtract- ed the background due to the C and S bands. Curve 4 is the spectrum subtracted by the background. Intense peak is obtained at about 20450 cm
–1(488.8 nm) with a shoulder at about 21430 cm
–1(about 466 nm). The peak corresponds to the A band, while the shoulder to the B band. The separation is about 980 cm
–1. Curve 5 of Fig. 3 shows the EL spectrum of Ir#1 obtained under applied voltage of 10 V. The EL spectrum is the same as the PL spectrum of Ir(ppy)
3excited with e.g. 350 nm light in Ir#1. The emission band has a peak at 512 nm (about 19528 cm
–1) and a shoulder at 540 nm (about 18518 cm
–1), which are at- tributed to the 0
→ 0 and 0 → 1 transitions, respectively. The separation is about 1010cm
–1. The Huang-Rhys factor S is estimated about 0.80 from the intensity ratio of these bands. We found that a mirror image holds between the absorption and emission bands.
From this mirror image it is suggested that the A and B absorption bands are attributed to the 0 → 0 and 0 → 1 transitions from the singlet ground state to the triplet state, respec- tively. It is not negligible that the B band is also due to the higher-energy metal-ligand charge transfer triplet state (
3MLCT) at 2.79 eV (about 443 nm) calculated by TDDFT
7)be- cause its state locates close to the B band position.
Figure 4 shows the emission spectrum of a 50 nm thick Ir(ppy)
3film evaporated on a
quartz plate which was excited with 300 nm light at 10 K. Besides the well-known phos-
phorescence band of Ir(ppy)
3with a peak at 515 nm, a very weak emission band is observed
at the high energy side of the 515 nm band. This band consists of a sharp line with a peak
at 396 nm and a broad sideband with peaks at about 411 and 424 nm. This emission band
Fig. 3. Absorption spectrum (curve 1) of a 50 nm thick film of Ir(ppy)3 at room temperature (285 K) and enlarged excitation spectra of Fig. 2 in Ir#0 (curve 2) and Ir#1 (curve 3) at 285 K in a spectral re- gion of 24000–15500 cm-1 (about 416–645 nm). Curve 4 is the triplet absorption spectrum subtracted by the background. Curve 5 is electroluminescence spectrum of Ir#1 obtained under applied voltage of 10 V. Curves 4 and 5 are normalized at their peak heights.is called the blue emission band hereafter. The intensity ratio of the blue emission band to the 515 nm emission band (green emission band) is 0.013. The emission intensities were obtained from the spectrum of Fig. 4 by plotting it against energy (cm
–1) and integrat- ing over the bands. Figure 5 plots the intensities (integrated band areas of the emission bands) of the blue and green bands against temperature. It is observed when temperature is increased from 10 K that the intensity of the blue emission band is almost constant in a range from 10 K to 100 K but decreases above about 100 K. On the other hand, the 515 nm band decreases with increasing temperature from 10 K. The temperature dependence
Fig. 4. Semi-log plotted emission spectrum of a 50 nm thick Ir(ppy)3 film evaporated on a quartz plate which was excited with 300 nm light at 10 K. Singlet emission band due to singlet state peak at 396 nm and broad band with a peak at 423 nm, peak at 515 nm, 548 nm shoulder at 548 nm.Fig. 5. Temperature dependence of the intensities (integrated band areas) of the green emission bands (closed and open circles) in a film of Ir(ppy)3 excited with 300 and 460 nm lights, together with the intensity of the blue emission band (closed triangle) excited with 300 nm light. The 396 nm band intensity is enlarged by 20 times.
does not depend on the excitation wavelength. Figure 6 shows the excitation spectrum for the blue emission band at 15 K. One finds that the blue emission band is generated by absorption of light with wavelength shorter than 393 nm and the excitation band peak appears at 365 nm.
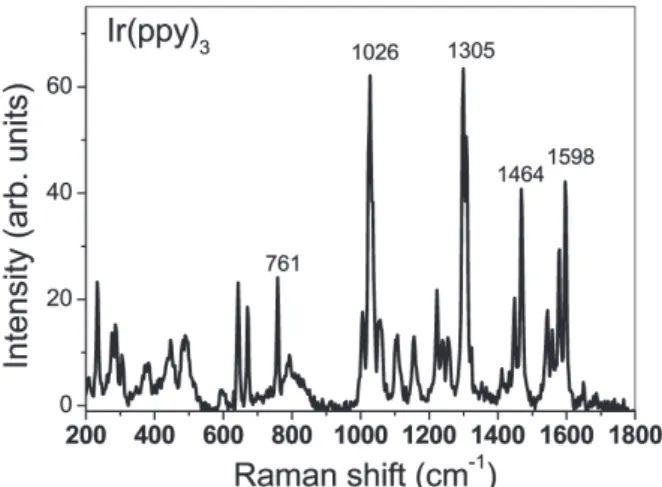
Figure 7 shows the Raman spectrum of a 50 nm thick Ir(ppy)
3film evaporated on a quartz plate at room temperature. Several sharp Raman signal was observed at 200–
1650 cm
–1of the measured range of 200–3000 cm
–1. Considerably intense Raman peaks are at 1026, 1305, 1464 and 1598 cm
–1. Strekas and Diamandopoulos measured Raman spectra of 2-phenylpyridine, i.e. ppy
12). They observed intense Raman peaks at 1001, 1295 and 1603 cm
–1by excitation with 514.5 nm Ar laser at room temperature. These lines are close to the Raman peaks at 1026, 1305 and 1598 cm
–1observed using Ir(ppy)
3film in the
Fig. 6. Excitation spectrum for the blue emission band in a film of Ir(ppy)3 at 15 K.
Fig. 7. Raman spectrum of a 50 nm thick Ir(ppy)3 film evaporated on a quartz plate. The spectrum was measured with He-Ne laser excitation at room temperature.
present study. Sarkar and Charkavorti observed the vibrational structure in the absorp- tion spectrum of 2-phenylpyridine (2PhPy) dissolved in solvent methylcyclohexane (MCH) at 300 K
13). The structure was analysed and they obtained that the ground state of ppy molecule has vibrational energy 1295 cm
–1. This 1295 cm
–1energy is close to the 1305 cm
–1Raman line. Therefore it is suggested that the observed 1026, 1305 and 1598 cm
–1Raman lines are due to ppy ligand in Ir(ppy)
3.
4. Discussion
Of the absorption bands observed in Ir(ppy)
3at 486, 456, 406, 386, 354, 284 and 242 nm, the intense 284 and 242 nm bands are attributed to the ligand-centered singlet (
1LC) state
6,7,14). This assignment is consistent with the observation that ppy molecule has ab- sorption bands at about 278 and 250 nm
13). On the other hand, the 386 and 354 nm bands are attributed to the
1MLCT, while the weak 486 and 456 nm bands to the
3MLCT
3,14,15). Regarding the 406 nm band, it is assigned to either
1MLCT or
3MLCT.
We observed the blue emission band in the undoped Ir(ppy)
3film by 300 nm excitation in addition to the green emission band (Fig. 4). The 300 nm light gives rise to the excitation into the singlet state of Ir(ppy)
3. The blue emission band is close to the 386 nm absorp- tion band (S band) due to the singlet state. The Stokes shift is about 650 cm
–1. This shift is comparable to the Stokes shift of about 920 cm
–1in the case of the green emission band.
Therefore it is suggested that the blue emission band is attributable to the emission due to the transition from the singlet state to the ground state, i.e. fluorescence. This suggestion is consistent with the observation that the blue emission band intensity decreases with increasing temperature. The rate constant k
STfor intersystem crossing from the singlet state to the triplet state is expressed as
k
ST=k
ST0+A exp(-E/kT) (1),
where k
ST0, A and E are temperature-independent
16). Equation (1) indicates that the rate constant is temperature independent below a certain temperature (called T
C) and increases with increasing temperature from T
C, i.e. the singlet emission is temperature independent below T
Cand decreases above T
C. This agrees with the temperature dependence observed for the blue emission band.
It was observed that the blue emission band consists of three components at 396, 411 and 424 nm although the last two components are not well resolved. The separation of the first two components is about 921 cm
–1, while that of the last two components is about 802 cm
–1. The separation of 921 cm
–1is close to the separation 1010 cm
–1of the zero- and one- phonon lines in the green emission band, i.e. almost the same vibrational energy is respon- sible for the two emission bands. This indicates that the blue emission is caused by the electronic transition to the same ground state as the case of the green emission.
From the observation of the 396 nm singlet emission band of Ir(ppy)
3, we cannot attri-
bute the absorption band at 406 nm to the lowest-energy singlet state because the 396 nm
band energy is higher than the 406 nm absorption band energy. Therefore, taking into
account that the 406 nm band (i.e. the C band) intensity is almost the same as the A band intensity (the intensities were obtained by plotting the absorption spectrum against energy eV and by subtracting the back ground due to the intense and broad S band), we have to attribute the C band to the triplet state, i.e.
3MLCT.
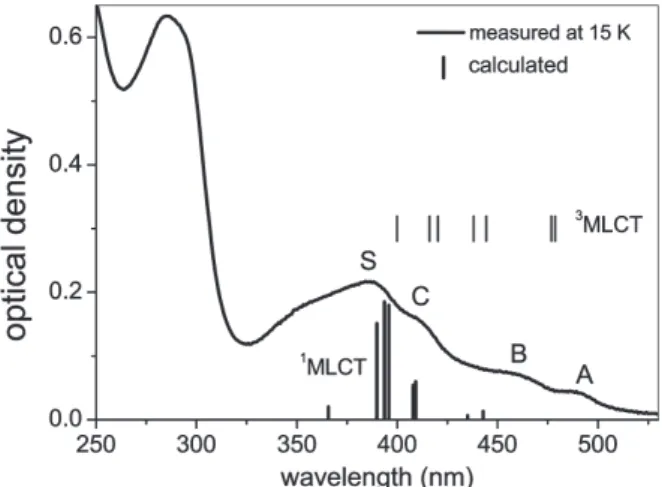
Hay calculated the excitation energies of the singlet states of Ir(ppy)
3and the oscillator strength by the TDDFT
7). The calculated results are shown in Fig. 8, which are compared with observed absorption spectrum. One might suggest from the comparison with the ab- sorption bands that the C band is attributed to the singlet state. The calculation was done without spin-orbit coupling effects. The spin-orbit coupling gives rise to shift the calculat- ed triplet states by about 0.2–0.3 eV (1600–2400 cm
–1) to low energy and the singlet states to higher energy
7). From these shifts, it is confirmed that the C band can be attributed to the triplet state, while the S band to the singlet state.
The 0 → 0 band wavelength of emission is not the same as the 0 → 0 band wavelength of absorption. The separation is about 1048 cm
–1. This deviation is understood using the configurational coordinate model in the harmonic approximation
17)as follows. The triplet state equilibrium position Q
bis shifted from the ground state equilibrium position Q
g, giv- ing a value of Huang-Rhys factor in the absorption band due to the triplet state. The elec- trons of Ir(ppy)
3are excited from the ground state to the triplet state (which is shown by triplet state “before relaxation” in Fig. 9) by the Franck-Condon transition optically, then immediately relaxation occurs in the triplet state by the vibronic interaction, resulting in moving from the equilibrium position Q
bto the relaxed excited state with new equilibrium position Q
a(which is shown by triplet state “after relaxation” in Fig. 6). The thermal equi- librium coordinate of the relaxed triplet state Q
ashifts a little from that of the triplet state before relaxation Q
b. As a result the 0 → 0 band wavelength of emission shifts to low en-
Fig. 8. Absorption spectrum of a 50 nm thick film of Ir(ppy)3 at 15 K. The upper vertical lines show the energies of the triplet states 3MLCT and the lower vertical lines show the relative oscillator strengths due to the transition from the singlet states 1MLCT to the ground state, which were calcu- lated by Hay7).
ergy from the 0 → 0 band wavelength of absorption as shown in Fig. 9.
The separation of the 0- and 1-phonon emission bands is about 1020 cm
–1, which means the phonon energy of molecular vibration associated with the ground state. The presence of such a vibration is confirmed by the Raman spectrum of Ir(ppy)
3as shown in Fig. 7.
Strekas and Diamandopoulos observed intense Raman peak at 1001 cm
–1in 2-phenyl pyridine, i.e. ppy
12). This peak is close to the Raman line at 1026 cm
–1observed in Ir(ppy)
3film.
From these results, one can conclude that vibronic structure in the PL spectra of Ir(ppy)
3is caused by ppy ligand in Ir(ppy)
3molecule.
Different excitation spectra were obtained for the Ir(ppy)
3emission between the Ir#0 and Ir#1 as mentioned above (Fig. 2), i.e. Ir#0 shows the excitation bands at both the A and B bands, while Ir#1 does not show the excitation band at the B band. This is understood as follows.
The triplet state, exactly speaking the triplet state before relaxation, has vibrational
levels (n=0, 1, 2, 3, n: vibrational quantum number). The vibrational frequency is esti-
mated to be about 980 cm
–1from the curve 4 of Fig. 2, i.e. the n = 1 level locates at 980
cm
–1above the n=0 level. The lowest triplet state of CBP has energy of 2.56 eV
18)or 2.55
eV
8), while that of Ir(ppy)
3has energy of 2.42 eV
8,18). These energies were estimated from
the highest peaks of the phosphorescence bands. This means that the n = 0 vibrational
level of CBP locates at about 1130 cm
–1or 1049 cm
–1above the n = 0 level of the lowest
triplet state of Ir(ppy)
3. Absorption spectra due to the triplet state has been measured for
Ir(ppy)
3(see Fig. 1) but not for CBP. The lowest triplet state Ir(ppy)
3is estimated to be at
20450 cm
–1(488.8 nm) from the A band. It is expected that the separation of the lowest
triplet states between Ir(ppy)
3and CBP before relaxation into their emitting states is al-
most the same as that after the relaxation. Therefore we suggest that the n = 0 vibration-
al level of CBP locates quite close to the n = 1 level of Ir(ppy) before relaxation. Therefore
Fig. 9. Optical processes of absorption and emission in Ir(ppy)3 involving the vibrational transitions, together with energy transfer from the n=1 vibrational level of Ir(ppy)3 to the n-0 vibrational level of neighboring CBP (see text). n and m means the vibrational quantum number.it is expected that the Ir(ppy)
3excited into the n = 1 level (i.e. the B band excitation) gives rise to energy transfer to the host of CBP molecules which locate at the nearest neighbors of the Ir(ppy)
3dopant as shown in Fig. 9. As a result no emission from Ir(ppy)
3by the B band excitation. In the case of the A band excitation (i.e. the excitation into the n = 0 level of Ir(ppy)
3), emission occurs because energy transfer to the n = 0 level of CBP is impossible energetically. Since Ir#0 contains no CBP host, such an energy transfer does not occur, giving rise to the emission by excitation of not only the A band but also the B band. In this way we can understand the obtained experimental results.
A nearly 100% conversion of the intersystem crossing has been suggested for Ir(ppy)
3from high internal quantum efficiency of nearly 100% for the green emission
18,19). This in- dicates no appearance or a considerably weak intensity of the singlet emission. In fact the singlet emission has not been observed in the OLED devices with Ir(ppy)
3doped in CBP (see e.g.
1,3)). As seen in Figs. 4 and 5, the singlet emission (i.e. blue emission) is much weaker than the triplet emission (green emission). From our observation that the intensity ratio of the blue emission to the green emission is 0.013, which indicates about 98.7% conver- sion of the intersystem crossing. In this way we confirm the conversion is nearly 100% in Ir(ppy)
3, together with high non-radiative intersystem crossing rate from the singlet state to the triplet state because of strong spin orbit interaction.
Acknowledgements
We thank Mr. H. Murayama and Horiba Ltd., Tokyo, Japan for help in the measure- ments of photoluminescence and Raman spectra, respectively. The present work was partly supported by the Grant-in-Aid for the Scientific Research from the Japan Society for Science Promotion (Project No. 15550165).
Appendix
Recently Suzuka et al reported observation of fine structure in Ir(ppy)
3doped in tet-
raphenyl at a region of 445–480 nm at 6 K, and assigned the fine structure to vibronic
band
20,21). Their spectrum is reproduced in curve 2 of Fig. 10. We also observed the same
fine structure in a 50 nm thick film of Ir(ppy)
3as shown in curve 4 of Fig. 10. The fine
structure was observed at not only low temperature but also at room temperature. When
the excitation spectra were corrected by the spectral distribution of Xe lamp used as exci-
tation source, the fine structure disappeared as shown in curve 3. Therefore, taking into
account the spectral distribution of the Xe lamp (curve 1), it is concluded that the fine
structure is caused by not vibronic structure of Ir(ppy)
3but emission lines of Xe.
References
1) M. A. Baldo, M. E. Thompson and S. R. Forrest, Pure Appl. Chem. 71 (1999) 2095.
2) H. Yersin, W. Humbs and J. Strasser, Topics in Current Chemistry, Vol. 191, ed. H. Yersin (Springer-Verlag, Berlin, 1997) p. 154.
3) T. Tsuboi and M. Tanigawa, Thin Solid Films 438–439 (2003) 301.
4) W. Holzer, A. Penzkofer and T. Tsuboi, Chem. Phys. 308 (2005) 93.
5) K. A. King, P. J. Spellane and R. J. Watts, J. Am. Chem. Soc. 107 (1985) 1431.
6) M. G. Colombo, T. C. Brunold, T. Riedener, H. U. Guedel, M. Foertsch and H. B. Buergi, Inorg.
Chem. 33 (1994) 545.
7) P. J. Hay, J. Phys. Chem. A 106 (2002) 1634.
8) I. Tanaka, Y. Tabata and S. Tokito, Jpn. J. Appl. Phys. 43 (2004) L1601.
9) G. Baldacchini, S. Gagliardi, R. M. Montereali, A. Pace, and R. B. Pode, Philos. Mag. B 82 (2002) 669.
10) L. Zou, V. Savvateev, J. Booher and J. Shinar, Appl. Phys. Lett. 79 (2001) 2283.
11) P. P. Sun, J. P. Duan, H. T. Shih and C. H. Cheng, Appl. Phys. Lett. 81 (2002) 792.
12) T. C. Strekas and P. S. Diamandopoulos, J. Phys. Chem. 94 (1990) 1986.
13) A. Sarkar and S. Charkavorti, J. Lumin. 65 (1995) 163.
14) W. J. Finkenzeller, P. Stossel and H. Yersin, Chem. Phys. Lett. 397 (2004) 289.
15) W. J. Finkenzeller and H. Yersin, Chem. Phys. Lett. 377 (2003) 299.
16) N. J. Turro, Modern Molecular Photochemistry (Benjamin/Cummings Publ. Co., Menlo Park, 1978) p. 187.
17) B. Henderson and G. F. Imbusch, Optical Spectroscopy of Inorganic Solids (Clarendon Press, Oxford, 1989) p. 197.
18) K. Goushi, R. Kwong, J. J. Brown, H. Sasabe and C. Adachi, J. Appl. Phys. 95 (2004) 7798.
19) K. Goushi, Y. Kawamura, H. Sasabe and C. Adachi, Jap. J. Appl. Phys. 43 (2004) L937.
20) I. Suzuka, S. Kodate, R. Yoshida and H. Kido, Proceedings, 12th International Workshop on In- organic and Organic Electroluminescence & 2004 International Conference on the Science and Fig. 10. Excitation spectra (curves 4 and 3) for 540 nm emission of a 50 nm thick Ir(ppy)3 film evaporated on quartz plate at 10 K, which were obtained before and after correction by the spectral distribution of Xe lamp used as excitation source, respectively. Curve 2 shows the excitation spectrum reported in Refs. [20, 21]). Curve 1 shows the spectral distribution of the Xe lamp.
Technology of Emissive Displays and Lighting (EL2004), (Toronto, Sep., 2004) p. 290.
21) S. Kodate and S I. Suzuka, The 52nd Spring Meeting of the Japan Society of Applied Physics and Related Societies, (Saitama, 2005) Extended abstracts, 31p-YG-6, p. 1485.