the Perspective of Internet Usage Patterns: A Case Study of Nanjing
著者 Enyu Chang, Feng Zhen, Yang Cao journal or
publication title
International Review for Spatial Planning and Sustainable Development
volume 4
number 1
page range 49‑63
year 2016‑01‑15
URL http://hdl.handle.net/2297/45045
doi: 10.14246/irspsd.4.1_49
49
Copyright@SPSD Press from 2010, SPSD Press, Kanazawa
Empirical Analysis of the Digital Divide from the Perspective of Internet Usage Patterns: A Case Study of Nanjing
Enyu Chang
1*, Feng Zhen
1, Yang Cao
11 School of Architecture and Urban Planning, Nanjing University
* Corresponding Author, Email: [email protected] Received 25 April, 2015; Accepted 21 June, 2015
Key words: Digital divide, Internet usage, Online activities
Abstract: There is a well-known ‘‘digital divide” in the tendency to connect to the Internet, but whether there is similar differentiation among Internet usage is still worthy of further exploration. Studies on the geography of the digital divide are more concentrated on the national and regional scale, with a lack of research on the micro-scale. This paper builds up an index system, uses the factors, clustering and regression to analyse the Internet usage level on spatial distribution and attributes characteristic influence factors, based on 2012 survey questionnaires about personal information usage. The result shows that there is a weak distinction in comprehensive Internet usage among Internet users from different social-economic groups, but differences in online activities are relatively significant and individual social-economic attributes and properties of location and housing of residents have a significant impact of different usage patterns.
1. INTRODUCTION
Numerous studies on sustainability have shown that the essence of
sustainable urban development is the coordination of different dimensions
and sustainable development is a multidimensional process that integrates
environmental, social and economic aspects (Tiyao SUI-QUI and Hong
LENG (2015)). With the improving of urbanization and economic
development, China is experiencing increasing disparities in wealth and
other aspects. Urban researchers are more focused on the social aspects of
sustainable development such as residential segregation and social
differentiation (Zhigang Li, Fulong Wu (2008)). In the background of the
information society, focusing on the aspect of the impact of information and
communication technology (ICT), the digital divide is proposed as a sub-
area of social inequality. As an important issue in the field of ICT and its
social impact studies, the digital divide has received much academic
attention ever since the information revolution. In the second half of the
1990s, attention on the subject of unequal access to and use of the new
media started to focus on the concept of the so-called digital divide (Van
Dijk (2006)). The main research of scholars focuses on how differentiated
levels of the digital divide may contribute to social inequality. Castells
(2001) argues that “in a society where most things that matter are dependent
on Internet based networks, to be switched off is to be sentenced to marginality”. Graham (2002) and Crang and Crosbie et al. (2006) noted that the digital reflects the socio-spatial stratification phenomenon to some degree. Fong (2001) and his colleagues pointed that the digital divide reflects the huge differences in the level of information among different social groups. Traditional research by scholars always measures the digital divide via access to the Internet or indicators of the quality and quantity of digital resources (see Bessey (2003), Chang, Bakken, et al. (2004), De Haan (2004), Ortiz (2008), President (2005), Robinson, Dimaggio, et al. (2003), O'Hara K., Stevens (2006), Salinas (2008), Smoot (2007), Warschauer (2003)). Mack (2001) defined the digital divide as the ability to pay for or have access to computer software, hardware and information channels of new information media. O'Hara and other researchers noted that the digital divide is segmentation between information rich groups and information deficient groups, which is an either-or concept (O'Hara K., Stevens (2006)).
Mingfeng Wang (2005) defined the digital divide as the differences between the Internet users and non-Internet users. But the differences represented by the "divide" are not just caused by the uneven level of Internet access from devices, but it is caused by the inequality of a series of information, knowledge and services that comes with Internet access. This implied “value divide” of the Internet is derived from the diversity of Internet usage patterns and cannot be easily bridged through equalizing Internet access. Internet technology access only is not sufficient to prove the productive use of the Internet. In contrast, the Internet usage of different users can be used as a research object. Therefore, at the second level, research on the digital divide also went deep into the differences in the use of the Internet, as well as differences in terms of information and knowledge. Van Dijk (2003) and other researchers noted that the digital divide is a very complex phenomenon because of the existence of information inequality as an intermediary in the communication process in the use of digital technology or computers, including the ICT usage skills and usage patterns. Cooper and Weaver (2003) expanded the connotation of the digital divide from the access to technology to the use of technology skills and training. Attewell (2001) considered that the digital divide has transcended the first-generation stage to the social differences of computer usage among different households and schools. Lai (2000) pointed out that the digital divide is not only the gap between development and application of information technology, but it is the gap between information and knowledge acquisition and utilization capacity.
Between different individuals there exist differences between user skills
and experience of the Internet. As the Internet permeates daily life, Internet
usage differences and its social impact will become more apparent. On the
basis of an online activity survey data, starting from two perspectives, we
measure comprehensive internet usage levels, and compare specific online
activity patterns of different individuals who already have internet access
and usage conditions, then we explore its influencing factors combined with
social and spatial properties of individuals, to empirically research on the
digital divide from the perspective of diverse Internet using patterns. This
empirical study in Nanjing may also add to the literature on the social
implications of the Internet, which has been largely developed from studies
in the western context.
2. DATA AND METHOD
2.1 Data
The data for this study come from a detailed survey of a 2012 Nanjing residents’ behaviour questionnaire in the information age. As a deputy central city of China's Yangtze River Delta economic zone, Nanjing occupies the front rank among the nation's level of economic development, as well as an advanced information level. Therefore, Nanjing was chosen as a study region. The survey is carried out to focus on daily behaviour of urban residents in the information age, including Internet adoption details, Internet usage of e-office, e-entertainment, e-shopping and e-travelling areas, and a number of demographic variables. Samples were distributed in 11 administrative districts in Nanjing and we conducted household surveys in a number of communities with different characteristics within each area. 1038 copies of questionnaires were distributed, 980 valid questionnaires were recovered. Excluding some samples which did not have network access conditions and those with more than half missing values, a total of 885 samples are used for the following analysis.
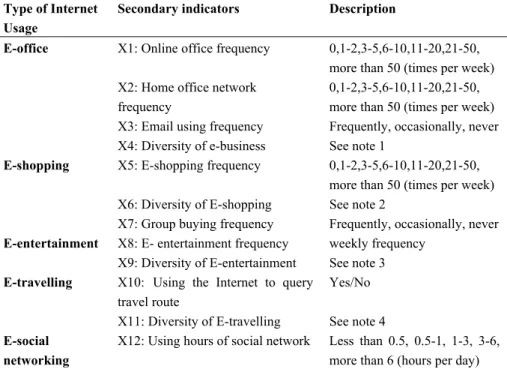
2.2 Evaluation Index System
Currently, the majority research related to the "Internet usage" tends to focus on the general description of differences in the intensity of use. To measure the Internet usage level, in this paper, we build an evaluation index system starting from two aspects of intensity and diversity to objectively measure the comprehensive level of internet usage. We generalize five principal types of online activities and then select 13 secondary indicators, considering the intensity and diversity of Internet usage. Using a factor analysis method, we aim to obtain an objective and comprehensive evaluation of the Internet usage level.
Table 1. Internet usage level evaluation index system
Type of Internet Usage
Secondary indicators Description
E-office X1: Online office frequency 0,1-2,3-5,6-10,11-20,21-50, more than 50 (times per week) X2: Home office network
frequency
0,1-2,3-5,6-10,11-20,21-50, more than 50 (times per week) X3: Email using frequency Frequently, occasionally, never X4: Diversity of e-business See note 1
E-shopping X5: E-shopping frequency 0,1-2,3-5,6-10,11-20,21-50, more than 50 (times per week) X6: Diversity of E-shopping See note 2
X7: Group buying frequency Frequently, occasionally, never E-entertainment X8: E- entertainment frequency weekly frequency
X9: Diversity of E-entertainment See note 3 E-travelling X10: Using the Internet to query
travel route
Yes/No X11: Diversity of E-travelling See note 4 E-social
networking
X12: Using hours of social network Less than 0.5, 0.5-1, 1-3, 3-6, more than 6 (hours per day)
X13: Diversity of E-social networking
See note 5
Note 1: Diversity index of e-business=∑X4i, i=1,2,...5, includes online office, contacting and communicating with customers, browsing news, searching destination information, checking traffic information and purchasing tickets.
Note 2: Diversity of E-shopping =∑X6i, i=1,2,...10, includes virtual goods, clothing shoes, bags, digital products, home appliances, beauty and hair care, baby products, home building materials, food specialty, merchandise, books.
Note 3: Diversity of E-entertainment =∑X9i,i=1,2,...4, includes online music, online games, online literature, online movies.
Note 4: Diversity of E-travelling =∑X11i,i=1,2,...5, includes transport routes, traffic conditions, weather conditions, destination information, transportation.
Note 5: Diversity of E-social networking =∑X13i, includes QQ (or MSN), Weibo, Feixin, Baidu BBS, Tianya BBS, Renren, Kaixin, Douban, Dazhongdianping and other social networking sites.
2.3 Research Method
This study is composed of two main parts. In the first part, to analyse the usage patterns and distinction of Nanjing residents, we evaluate the comprehensive Internet usage level on the basis of the index system using a factor analysis method and then observe the general Internet usage patterns among different groups. After using an orthogonal rotation method of principal component analysis for 13 indicators, screening out two main factors, we adopt a KMO (Kaiser-Meyer-Olkin) and Bartlett test. The KMO value is 0.714, which suggests that the original variables are suitable for factor analysis and total variance explained reaches 59.23%. Then we analyse their social and spatial distribution of different social groups according to the Internet usage level.
To analyse the usage patterns of different social groups, we divide residents into different social class groups. After selecting some of the residents’ socio-economic indicators and calculating the final level score by equally weighting and summing together, we divide individuals into three clusters of high, medium and low level according to the final level score.
Combined with comprehensive Internet usage level and five sub-index score statistics of the residents, we analyse the usage pattern and distinction among different social groups.
In the second part, we explore factors that may be related to the difference of Internet usage by using a multiple regression model, combined with the socio-economic characteristics of the residents of the properties. We create dummy variables for whether people engage in certain activities on the web and use these as the outcome measures.
3. ANALYSIS OF INTERNET USAGE DISTINCTION 3.1 Comprehensive evaluation of the Internet usage
In this study we use a factor analysis method to evaluate the
comprehensive Internet usage level of Nanjing residents based on the
principal component composite scores calculated. As the final score has both
a positive and negative value, we normalize the evaluation index values in
order to facilitate subsequent statistical analysis, then we compare and
analyze the Internet usage patterns based on the individual attributes of age,
education level, housing type and residential location.
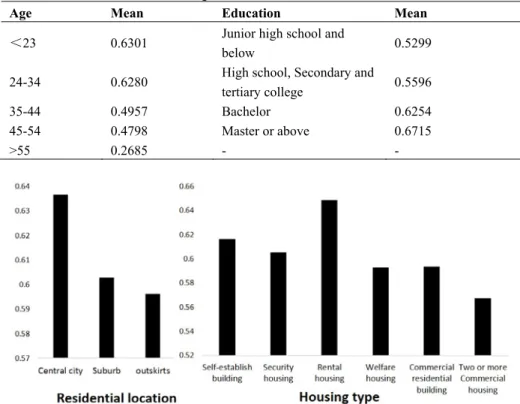
From the evaluation results (see Table 2), we find that there are significant differences in comprehensive level of Internet usage among different age groups and people of different educational levels. With the increase of age and the decrease of educational level, Internet usage levels are significantly decreasing, residents from the age group younger than 34 are at the highest level of Internet usage, followed by residents of 35-54 age group, residents older than 55 are at the lowest Internet usage level. From the aspect of education level, residents from Masters or above education level are at the highest level of Internet usage, followed by residents from bachelor education level, and residents from junior high school and below, high school, secondary and tertiary college are at the lowest level. As for residential location, Internet usage levels are gradually decreasing from the inner city to the outskirts. Internet usage level of the inner city residents is significantly higher than those from suburbs and the outskirts. It is evident that the widespread use of the Internet has not compensated for the lack of spatial accessibility, in contrast, Internet usage reduces as the accessibility weakens. In addition, there are slight differences among residents from different housing types. Residents from rental housing groups are at the highest level of Internet usage, we believe the reason is that residents living in rental houses are mostly young white-collars who have just graduated from college. In both the work requirements and the acceptance and use of new technology, they are much higher than other groups, and thus occupy a higher level of the Internet usage.
Table 2. Mean value of Internet usage
Age Mean Education Mean
<23 0.6301 Junior high school and
below 0.5299
24-34 0.6280 High school, Secondary and
tertiary college 0.5596
35-44 0.4957 Bachelor 0.6254
45-54 0.4798 Master or above 0.6715
>55 0.2685 - -
Figure 1. Mean value of Internet usage in different residential locations and housing types
3.2 Analysis of the usage of the Internet among different social classes
To further explore the distinctions in Internet usage among different
social classes, we select residents’ social and economic attributes including
education level, income and housing type, and calculate the final level score by equally weighting and summing together. According to the final score, we divide the samples into three categories: cluster 1, cluster 2 and cluster 3, respectively representing high, medium and low social class.
Firstly, according to the Internet usage level score of the three clusters separately, as shown in the second column of Table 3, it is evident that there was no significant difference in residents’ comprehensive internet usage among the three clusters (standard deviation is 0.0432), and compared to the lower and the higher class level clusters, the middle class residents show a certain degree of superiority among the three groups.
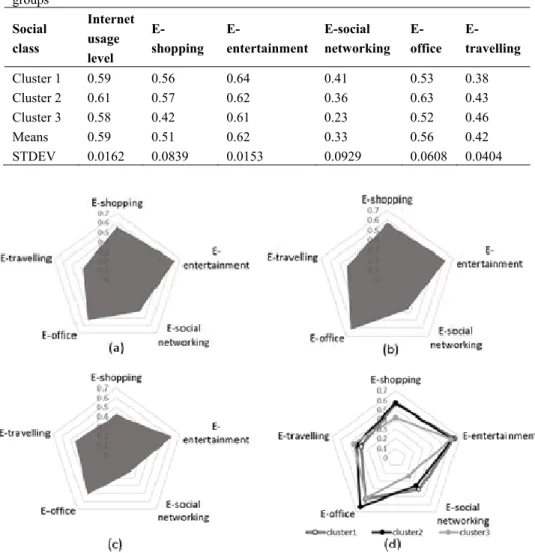
Table 3. Mean value and standard deviation in different online activities of three social class groups
Social class
Internet usage level
E- shopping
E-
entertainment
E-social networking
E- office
E- travelling
Cluster 1 0.59 0.56 0.64 0.41 0.53 0.38
Cluster 2 0.61 0.57 0.62 0.36 0.63 0.43
Cluster 3 0.58 0.42 0.61 0.23 0.52 0.46
Means 0.59 0.51 0.62 0.33 0.56 0.42
STDEV 0.0162 0.0839 0.0153 0.0929 0.0608 0.0404
Figure 2. Internet usage patterns of three social class clusters: (a) cluster 1; (b) cluster 2; (c) cluster 3. (d) Three clusters’ overlaid
Secondly, we further explore the distribution of the different patterns of the residents’ online activities. Through the statistical descriptions and analyses of five categories of online activities of different social class groups, we find that although there is no significant difference in the Internet usage level among the three clusters, there is still differentiation in the choice of online activities among them to some degree (see Figure 2).
Overall, the online activities’ distribution patterns of the different social
class clusters approximately converge. In all three classes, the total mean
values of the E-entertainment are the highest, followed by E-office and E-
shopping, the E-social networking and E-travelling are the lowest. The
distribution indicates that compared to travel behaviour and social networking, the Internet plays a more important role in entertainment, office and shopping aspects in people's daily life among the three social class clusters.
Then, through the comparison of different distribution patterns of online activities among different social class clusters, we can see that in the E- entertainment area, the differences of Internet usage levels among the three social class clusters are the smallest (the standard deviation is 0.0153), followed by the E-office and E-travelling area (the standard deviations are 0.0404 and 0.0608, respectively). Relevant research indicates that socioeconomic status makes a significant difference on peoples’ travel behaviours (Xihe Jiao, Ying Jin et al. (2015)). Through our study, there are also some class-reliance phenomena in the E-travelling behaviour. E- travelling level rises with the increasing of class status, which corresponds with their travel ability. Moreover, middle class groups are the highest in E- office value, which indicates that middle class groups have the highest information level in the business and office area. In addition, there is a relatively significant difference in areas of online shopping and social networking level among the residents of the three social classes (the standard deviations are 0.0839 and 0.0929, respectively). In the E-shopping and E- social networking areas, higher social class groups are significantly lower than those from lower class groups, which indicates that among all the online activities, E-shopping and E-social networking are more attractive to lower social class groups. Thus, from the distribution of online activities, we can conclude that in the virtual Internet world, there is also some "stratification"
phenomena. Residents from different socio-economic backgrounds are at some degree differentiated in online activities. Higher social class groups’
online activities focus on capital-enhancing activities, which verify the existence of a "second gap" in the ICT divide.
Possible reasons are due to the higher levels of education and income,
higher access opportunity to diverse information technology equipment, as
well as more advantages in learning and mastering new technologies; middle
social class residents’ Internet usage levels are higher than that of lower
classes. While, although the higher social class residents are higher at the
education level and income level than middle class groups, due to
differences in the amount of leisure time, differences in the opportunity cost
of leisure time and differences in the utility of online activities, which
together determine the choice of Internet usage, they tend to choose higher
beneficial online activities and capital enhancing activities. We conclude the
following inference, unlike Internet access and equipment, the threshold for
the use of Internet is relatively low and there is no significant difference
among different social class. Even without the trendy, high-end Internet
equipment, residents of lower classes can also carry out various and plentiful
online activities, fully enjoying the convenience of the Internet.
4. INFLUENCING FACTORS OF INTERNET USAGE
4.1 Model and Variables
On the basis of the survey data, after the evaluation of the Internet usage level of Nanjing residents, we explore and analyse the influencing factors of residents’ Internet usage level from the aspects of individual social- economic attributes, housing types and residential location using a multiple regression model (for detailed samples see Table 4). The models are as follows:
ln (comprehensive level of Internet usage) = f (gender, age, education level, income, housing type, residential location and other social-economic attributes)
(1) In our study, we pay more attention to residents’ social and spatial factors on the influence of the Internet usage level, so the model introduces various socio-economic factors and location factors. Taking the residents’
occupation and income into account may be quite relevant, we only introduce an income variable into the model, without a consideration of the impact of the occupation factor.
(2) As for the housing type aspect, we select six variables including self- established building, security housing, rental housing, welfare housing, commercial residential building, two or more commercial housing, meanwhile the self-built house is set to be the reference group. Considering the current situation of urban development in China, combined with detailed analysis of the samples, we find that most self-built houses are located in the suburban fringe residential districts such as Jiangning, Pukou, Liuhe and outskirts residential fringe districts such as Yuhuatai, Jianye District. To some degree, the self-built housing samples can reflect characteristics of residents’ surrounding urban building environment, accessibility and situation of living and service facilities.
(3) The above analysis results show that there is a certain degree of spatial differentiation in the comprehensive level of the residents’ Internet usage, so we choose the residential location in the location variables to examine the factors that influence the level of the residents’ Internet usage.
Residential locations include central city, suburb and outskirts, altogether to analyse the relationship between the Internet usage and location factors.
Table 4. Statistical description of the samples and variables in the regression model
Variable Quantity Percentage% Variable Quantity Percentage%
Gender 2000-3000 176 19.9
Male 441 49.8 3000-5000 295 33.3
Female 444 50.2 5000-8000 121 13.7
Age ≥8000 66 7.5
<23 243 27.5 Housing type
24-34 508 57.4 self-established
building
22 2.5
35-44 103 11.6 security housing 42 4.7
45-54 23 2.6 rental housing 200 22.6
>55 8 0.9 welfare housing 110 12.4
Education level
commercial residential
475 53.7
building, Junior
high school and below
26 2.9 two or more
commercial housing
36 4.0
High school, Secondary and tertiary college
301 34.0 Residential
location
Bachelor 433 48.9 Central city 256 28.9
Master or above
125 14.1 Suburb 344 38.9
Monthly income
Outskirts 275 31.1
Less than 2000 yuan
227 25.6
4.2 Results
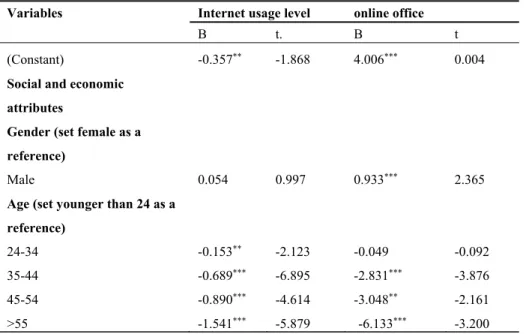
After selecting the influencing factors affecting the dependent variables, we construct models for the Internet usage level and Internet office, Internet entertainment, Internet social networking level of Nanjing residents - three main focus indicators, and then conduct a multiple regression analysis using SPSS Statistics 19.0, the results are shown in Table 5.
(1) Social and economic attributes of individual residents have a significant influence on the level of Internet usage. Overall, the variable of the age level has the most significant impacts on the individual Internet usage, concretely embodying the maximum absolute value of the regression coefficient of the Internet usage, Internet entertainment and Internet social network models. In each model, the level of Internet usage in all fields demonstrates a significant decline with the increasing of age, which indicates that young people below 34 are the most active users of the Internet, and groups who were born in the 1980s and 1990s always have an advantage in terms of accepting and mastering new things. The variable followed is the education level. In the Internet business model, the variable of the education type has the most significant influence. In all four models, the usage of Internet shows a significant increase with education's increase. In contrast, the impact of gender factors is much smaller, apart from the Internet office model. Gender factor plays an important role in the E-office area. The level of online office of the male group is significantly higher than for females (regression coefficient is 0.933). In other areas, gender difference in Internet usage is not significant. As for income levels, comparing the monthly income of less than 2,000 yuan group residents, residents' Internet usage level and online office level showed a rising trend with the increase of the overall level of income. In the Internet e-entertainment area, residents from the 2000-3000 yuan group are at the highest influencing level, indicating that low-income residents spent more time in the online entertainment activities.
(2) Different types of housing have a significant impact on online
entertainment activities of the residents, compared with the Self-established
building housing type residents, security housing, rental housing, welfare
housing, commercial residential building, two or more commercial housing
factors all showed a significant but weak negative correlation, indicating that
compared to the central city residents, whose surrounding is an urban building environment, where the accessibility and situation of living and service facilities are more complete, online entertainment activities of urban fringe residents whose surrounding circumstances and facilities are poor, occupy an important proportion of all online activities. In the field of Internet usage and online social networking, different housing types for Internet usage does not significantly affect the extent of usage and has a weak impact on it. But the comparison with the regression coefficients shows that as the housing level upgrades, there is a negative trend and a positive middle correlation which shows as an inverted "U" shaped trend.
Combined with the presence of China's housing market, housing types have a close relationship with the residents' social status, which confirms the above inference. To a certain extent, Internet usage level differs little between different classes; middle class usage levels are slightly higher than lower and higher classes.
(3) The Internet usage of residents from different residential locations is different. There is a decreasing tendency in the comprehensive level of Internet usage from the inner city to the outskirts. Compared to residents in the suburban areas of the city, residents from central city areas show a more significant positive correlation with the level of Internet usage (the regression coefficient is 0.202), while suburban residents’ level of Internet usage shows an insignificant and weak negative correlation. As for the influence of online office, the central city residents were also significantly higher in number than that of the outsider city resident users. In the field of online entertainment, there is a significant but weak negative correlation between the suburbia residents and outskirt residents, which is not in contradiction with the residents of housing types regression results. Because of the rough geographical division, the results could only reflect the rough trend, it tends to conceal more specific factors such as the individual surrounding urban environment, accessibility and the surrounding facilities and so on. In the area of social networking, compared to residents in suburban areas of the city, the central city residents present a significant positive correlation, and the suburban residents showed a significant negative correlation, indicating that the influence of social networking on the outskirt residents is weaker than on inner city residents.
Table 5. Regression result of determinants of Internet usage level
Variables Internet usage level online office
B t. B t
(Constant) -0.357** -1.868 4.006*** 0.004
Social and economic attributes
Gender (set female as a reference)
Male 0.054 0.997 0.933*** 2.365
Age (set younger than 24 as a reference)
24-34 -0.153** -2.123 -0.049 -0.092
35-44 -0.689*** -6.895 -2.831*** -3.876
45-54 -0.890*** -4.614 -3.048** -2.161
>55 -1.541*** -5.879 -6.133*** -3.200
Education level (set Junior high school and below as a reference)
High school, Secondary and
tertiary college 0.298** 1.848 4.420*** 3.754
Bachelor 0.487*** 3.029 6.052*** 5.147
Master or above 0.650*** 3.776 6.825*** 5.419
Monthly income (set Less than 2000 yuan as a reference)
2000-3000 0.122* 1.450 1.671*** 2.712
3000-5000 0.179*** 2.224 2.317*** 3.934
5000-8000 0.015 0.157 2.311*** 3.199
>8000 0.263** 2.196 4.785*** 5.458
Housing type (set Self- Established building as a reference)
Security housing -0.094 -0.763 0.845 0.935
Rental housing 0.017 0.154 1.145 1.386
Welfare housing 0.053 0.370 1.077 1.030
Commercial residential building -0.043 -0.389 1.367* 1.695 Two or more commercial
residential building
-0.082 -0.523 1.212 1.060
Residential location (set suburb as a reference)
Central city 0.202*** 3.399 1.188*** 2.730
Outskirt -0.001 -0.019 0.280 0.552
R2 0.205 0.211
Adjustment R2 0.181 0.188
Sig. 0.000 0.000
Variables Online entertainment Online social network
B t B t
(Constant) 0.632*** 13.965 14.171*** 10.716
Social and economic attributes
Gender (set female as a reference)
Male 0.007 0.564 -0.020 -0.054
Age(set younger than 24 as a reference)
24-34 -0.044*** -2.579 -1.144*** -2.290
35-44 -0.141*** -5.854 -5.077*** -7.354
45-54 -0.154*** -2.879 -5.960*** -4.471
>55 -0.261*** -3.008 -9.378*** -5.177
Education level(set Junior high school and below as a reference)
High school, Secondary and
tertiary college 0.083** 2.213 1.351 1.214
Bachelor 0.113*** 3.051 2.431** 2.187
Master or above 0.125*** 3.172 4.032*** 3.386
Monthly income(set Less than 2000 yuan as a reference)
2000-3000 0.038** 1.906 0.391 0.672
3000-5000 0.027* 1.415 0.332 0.596
5000-8000 -0.015 -0.632 -0.773 -1.133
>8000 0.001 0.048 0.649 0.783
Housing type(set Self- establish building as a reference)
security housing -0.077*** -2.525 -0.494 -0.578
rental housing -0.065*** -2.336 -0.843 -1.080
welfare housing -0.073** -2.064 0.369 0.373
commercial residential
building -0.066*** -2.423 -0.911 -1.195
Two or more commercial residential building
-0.041 -1.057 -1.633* -1.510
Residential location(set suburb as a reference)
Central city 0.009 0.603 0.642* 1.561
Outskirt -0.041*** -2.487 -0.939** -1.959
R2 0.147 0.190
Adjustment R2 0.118 0.166
Sig. 0.000 0.000
Note: 1. Dependent variables: the level of Internet use level, Internet office level, Internet entertainment level, Internet social networking level; 2. *** corresponds to a significance level of 0.01, ** corresponds to a significant level of 0.05, *corresponds to a significant level of 0.1.
5. DISCUSSION AND CONCLUSION
Based on 2012 Nanjing online activity survey data, in this paper we give an Internet usage evaluation by building an evaluation index system using factor analysis, and compare and analyse different online activity patterns and distribution patterns of different individuals who already have Internet access and usage conditions, then we explore its influencing factors combined with social and spatial properties of individuals. We conclude that:
(1) The comprehensive level of Internet usage among the different
social classes did not present a significant "divide" and there is an overall
distribution trend that the middle class is slightly higher than that of lower and higher class groups. The distribution indicates that diverse Internet applications and services have penetrated into the daily life of the residents;
meanwhile the middle class residents have the highest ability in the use of ICT. There's a slight difference between Internet users from different residential locations and different housing types, indicating that the level of physical location and facilities and service status also affect residents’ online activities to some degree. (2) Types of online activities have a certain degree of difference among people from different socio-economic backgrounds.
Residents of higher levels tend to choose capital-enhancing and utility efficient online activities, while lower-middle class people tend to take options toward more recreational and social networking online activities, which determine some "stratification" phenomenon in Internet usage. (3) Among all factors, age and education level have the most significant impact on residents' comprehensive level of Internet usage, youth groups and the highly educated population have the highest level of Internet usage.
Moreover, the main factors that impact different types of online activities may vary, in addition to two major factors of age and education level, other variables such as gender, income and residential location are also important factors influencing the office network. Male, high-income groups and inner city residents have a high online office level. Entertainment usage is significantly affected by housing type, more marginalized housing type groups choose more online entertainment activities.
Users’ social and economic attributes have a significant impact on the type of Internet usage and online activities, the differences in distribution suggest that online activities of users from a higher socio-economic status are just an extension of offline activities. While, for users from lower socio- economic backgrounds, online activities and offline activities are complementary to some degree. But similarly, the type and effectiveness of online activities and offline activities are closely associated with their socio- economic background.
In the field of research on the digital divide, there is not much controversy in the existence and specific meaning of the first level of the access divide, but the presence and meaning of a second or even the third gap is still worthy of further exploration. Generally, the individual personal usage of the Internet is based on the needs of real life, as purely internal activities. There are many uncertain factors that lead to the difficulty of measuring and analyses. On the basis of analysis and demonstration of this study, we contend that this deeper level of digital divide can be understood from two perspectives. The first perspective is the comprehensive level of Internet usage. Overall, from the view of intensity and diversity of the level of Internet usage in daily life, the slight difference among users from different social and economic background suggests that there is not a significant divide in the digital usage. Residents from every social status could fully enjoy the convenience and service brought by the Internet. The other perspective is the beneficial utility of concrete online activities.
Internet usage demands are different among Internet users from different
socio-economic backgrounds, so the specific network activities they choose
are diverse. This "stratification" phenomenon of the online activities leads to
different levels of efficiency in the use of the Internet, resulting in a certain
social impact. We cannot simplify this complicated level of the digital divide
problem for any one aspect, but divide into two objective views. With the
decreasing of the differences in Internet devices and online technical ability
among different social class groups, there are still differences of this
persistent and insurmountable divide in the use of the Internet. On one hand there is a weak class differentiation, on the other hand it is fixing the class stratification.
In this study, there are the following deficiencies: because of the insufficient sample sizes, with most samples being from the middle-aged groups and people living in the main city, part of the data accuracy and regression significance is not high. Following studies should focus on the theory and methods of sociology, informatics and other related subjects on the basis of making up for these deficiencies. In addition, research should pay attention to the analysis of mechanisms and their deeper impacts besides just the identification of phenomenon.
REFERENCES
Attewell, P. (2001). “The first and second digital divides”, Sociology of education, 74(3), 252- 259.
Bessey, D. L. (2003). The digital divide: Achieving integration, Doctoral dissertation, Royal Roads University, Victoria.
Castells, M. (2001). The Internet Galaxy, Oxford University Press, Oxford.
Chang B. L., Bakken S., et al. (2004). “Bridging the digital divide: Reaching vulnerable populations”, Journal of the American Medical Informatics Association, 11(6), 448-457.
Crang, M., Crosbie, T., Graham, S. (2006). “Variable geometries of connection: urban digital divides and the uses of information technology”, Urban Studies, 43(13), 2551–2570.
Graham, S. (2002). “Bridging urban digital divides? Urban polarisation and information and communications technologies (ICTs)”, Urban Studies, 39(1), 33–56.
Cooper, J., Weaver, K. D. (2003). Gender and computers: Understanding the digital divide, Psychology Press, London.
De Haan, J. (2004). “A multifaceted dynamic model of the digital divide”, IT & Society, 1(7), 66–88.
Fong, E., Wellman, B., et al. (2001). “Correlates of the digital divide: Individual, household and spatial variation”, Office of Learning Technologies, Human Resources Development Canada, Ottawa, Canada.
Mack, R. L. (2001). The digital divide: Standing at the intersection of race and technology, Carolina Academic Press, Durham, N.C.
Lai, M. S. (2000). “Informatization and digital gap”, Modern information technology, 12, 84- 86.
Li, Z., Wu, F. (2008). “Tenure-based residential segregation in post-reform Chinese cities: a case study of Shanghai”, Transactions of the Institute of British Geographers, 33(3), 404–
419.
Wang, M. F. (2005). “Internet use and urbanization in China: A spatial perspective of digital divide”, Sociological Research, (6), 112-135.
Ortiz, J. A. (2008). The perceived impact of municipal wireless broadband networks on the digital divide: A tale of five cities, Doctoral dissertation, The Pennsylvania State University, Pennsylvania.
O'Hara, K., Stevens, D. (2006). Inequality. com: Power, poverty and the digital divide, Oneworld Publications, Oxford.
President, T. (2005). A study of a community technology centre in Brooklyn: An exploration of the contemporary digital divide, Doctoral dissertation, Columbia University Teachers College, New York.
Robinson, J. P., Dimaggio, P., et al. (2003). “New social survey perspectives on the digital divide”, IT & Society, 1(5),1– 22.
Salinas, R. (2008). The digital divide goes to college: Latino undergraduates and barriers to digital information, Doctoral dissertation, University of California, Los Angeles.
Servon, L. J. (2002). Bridging the digital divide: Technology, community and public policy, Blackwell Publishers, Inc., Cambridge, MA, USA.
Smoot, D. M. (2007). Bridging the digital divide: A qualitative study of two educators narrowing the gap, Doctoral dissertation, Saint Louis University, Saint Louis, MO. SUI-QUI, T., LENG, H. (2015), “Review on the development of a sustainability indicator
system in agenda 21 for tourism in Mexico”, International review for spatial planning and sustainable development, 3(2), 4-21.
Van Dijk, J., Hacker, K. (2003). “The digital divide as a complex and dynamic phenomenon”.
The Information Society, 19(4), 315-326.
Van Dijk, J. (2006). “Digital divide research, achievements and shortcomings”, Poetics, 34(4- 5), 221–235.
Warschauer, M. (2003). Technology and social inclusion: Rethinking the digital divide, The MIT Press, Cambridge.
Xihe, J., Ying, J., et al. (2015). “Modelling spatial distribution of outdoor recreation trips of urban residents, an in-depth study in Salford, UK”, International Review for Spatial Planning and Sustainable Development, 3(3), 36-49.