Abstract—Pulsed streamer discharge plasmas, one of the non-thermal plasma have been used to treat exhaust gases. Since a pulse width of applied voltage has a strong influence on the energy efficiency of the removal of pollutants, the development of a short pulse generator is of paramount importance for practical applications. In this work, nano seconds (ns) pulse generator which has 5ns of pulse duration in output pulsed voltage is developed and NO removal experiments using ns pulsed discharge were conducted. The experimental results of the NO removal showed 100 % of NO removal ratio at 7 pps of pulse repetition rate and the extremely high energy efficiency, 0.43 mol/kWh (12.9 g-NO/kWh) for NO removal (initial NO concentration = 200 ppm, gas flow = 2.0 L/min). The result of deriving energy efficiency for NO removal indicated that the ns pulsed discharge has great advantage in energy efficiency for NO removal to the conventional discharge methods. By this research, the utility of the ns pulse plasma process was proven and the influence of shorter pulse duration on NO removal energy efficiency was confirmed.
Index Terms—Pulsed power, plasma, exhaust gas treatment, ns pulsed discharge
I. INTRODUCTION
ITROGEN oxides (NOx), including nitric oxide (NO) and nitric dioxide (NO2) are exhausted from fuel combustion and industrial processes. The emission of NOx into the atmosphere is one of the responsible factors for acid rains and atmospheric photochemical smog. The conventional methods such as SCR method and Lime-gypsum method could not remove exhaust gases efficiently. In addition, the both methods require strict operation conditions such as reaction temperature and gas compositions. Furthermore, the energy efficiency and the cost of the conventional way are still in negative situation as practical use.
In recent years, the pollution control techniques using electric discharge plasmas which gather attention as the low
Manuscript received September 30, 2009.
T. Matsumoto is with Graduate School of Science and Technology, Kumamoto University, 2-39-1 Kurokami, Kumamoto 860-8555, JAPAN.
D. Wang is with Priority organization for Innovation and Excellence, Kumamoto University, 2-39-1 Kurokami, Kumamoto 860-8555, JAPAN.
*T. Namihira is with the Bioelectrics Research Center, Kumamoto University, 2-39-1 Kurokami, Kumamoto 860-8555, JAPAN. (e-mail:
H. Akiyama is with Graduate School of Science and Technology, Kumamoto University, 2-39-1 Kurokami, Kumamoto 860-8555, JAPAN.
cost and
high energy efficient exhaust gas treatment method, is widely studied [1]-[16]. Among them, some researchers reported that a shorter duration pulsed power gives an improvement of an energy efficiency of pollutant gas treatment [17][18]. Therefore, the development of a nano-seconds (ns) pulsed generator is paramount important. In the present work, Exhaust gas treatment was developed using a pulse generator which has 5 ns of pulsed duration as a substitute for past several hundred ns of pulse generator.
II. EXPERIMENTALSETUP
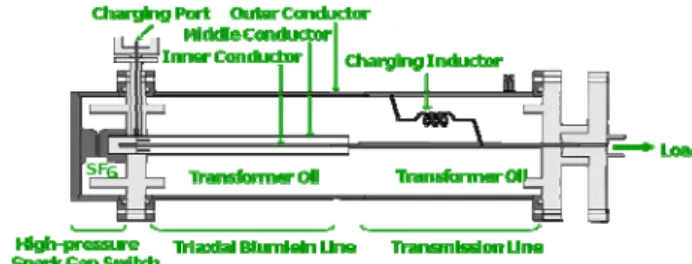
Fig.1 shows the schematic diagram (a) and the appearance (b) of the ns pulse generator used in the work. The ns pulse generator consists of a high-pressure spark gap switch as a low inductance self-closing switch, a triaxial Blumlein line as pulse-forming line, and a voltage transmission line from the Blumlein line to load. The spark gap switch was filled with SF6
gas, and the output voltage of ns pulse generator was regulated by varying the pressure of the SF6. The triaxial Blumlein line consists of an inner rod conductor, a middle cylinder conductor, and an outer cylinder conductor. All the conductors were placed concentrically and were made of brass. The outer conductor was grounded. The inner conductor and the outer conductor were connected through a charging inductor. The
Energy Efficiency Improvement of Nitric Oxide Treatment using Nano-seconds Pulsed Discharge
Takao Matsumoto, Douyan Wang, Member, IEEE, Takao Namihira, Senior Member, IEEE, H. Akiyama, Fellow, IEEE
N
(a) Cross section of Nano-seconds pulse generator
(b) Photograph
Fig. 1. Nano-seconds pulse generator.
Blumlein line and the transmission
line were filled
with silicone oil (KF-96,
Shin-Etsu Chemical, Japan) as insulation and dielectric medium. The calculated unit inductance and unit capacitance of the triaxial Blumlein line were 140 nH/m and 216 pF/m, respectively, which define a characteristic impedance of 50 Ω.
The length of the Blumlein line was 500 mm. The calculated pulse duration of the triaxial Blumlein line was 5 ns.
Fig.2 shows a schematic diagram for NOx removal experiment. The coaxial cylindrical electrodes having central tungsten wire, 0.5 mm in diameter, placed concentrically in a brass cylinder having 76 mm in internal diameter and a length of 200, 500 and 1,000 mm were employed as pulsed streamer discharge reactor. Pressurized gas cylinders of standard N2 and
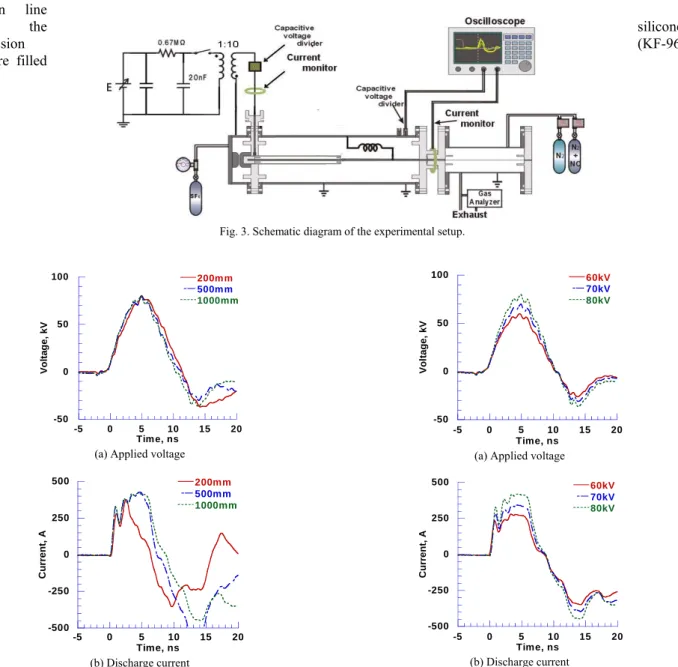
N2 mixed with 1,000 ppm of NO were used to simulate exhaust gas. The positive applied voltage to the central wire electrode from the ns pulsed generator was measured by a capacitive voltage divider. The discharge current through the coaxial electrode was measured using a Rogowski coil (MODEL CT-F1.0, Bergoz Instrumentation, USA). A digital oscilloscope (DPO7254, Tektronix, USA) with a maximum bandwidth of 2.5 GHz and a maximum sample rate of 40 G samples/sec recorded the voltage and current signals.
In the experiment, the applied voltage to the reactor was kept at 60, 70, and 80 kV by regulating the gas pressure of SF6 in the ns pulse generator. The NO concentration of and the flow rate
Fig. 3. Schematic diagram of the experimental setup.
-50 0 50 100
-5 0 5 10 15 20
200m m 500m m 1000mm
Voltage, kV
Time, ns (a) Applied voltage
-500 -250 0 250 500
-5 0 5 10 15 20
200mm 500mm 1000mm
Current, A
Time, ns (b) Discharge current
Fig. 4. Typical output waveforms from ns pulse generator in different reactor length at the 80 kV peak of applied voltage.
-50 0 50 100
-5 0 5 10 15 20
60kV 70kV 80kV
Voltage, kV
Time, ns (a) Applied voltage
-500 -250 0 250 500
-5 0 5 10 15 20
60kV 70kV 80kV
Current, A
Time, ns (b) Discharge current
Fig. 5. Typical output waveforms from ns pulse generator in different reactor of applied voltage in 1,000 mm reactor length.
of the simulated gas were fixed at 200 ppm and 2.0 L/min by mass flow controllers (SEC-E40, STEC, Japan), respectively.
The concentrations of NO and NO2 were measured using a
FTIR (MODEL IG-1000, Otsuka electronics, Japan), which was located at the gas outlet of the reactor, after a steady state at
each pulse repetition rate.
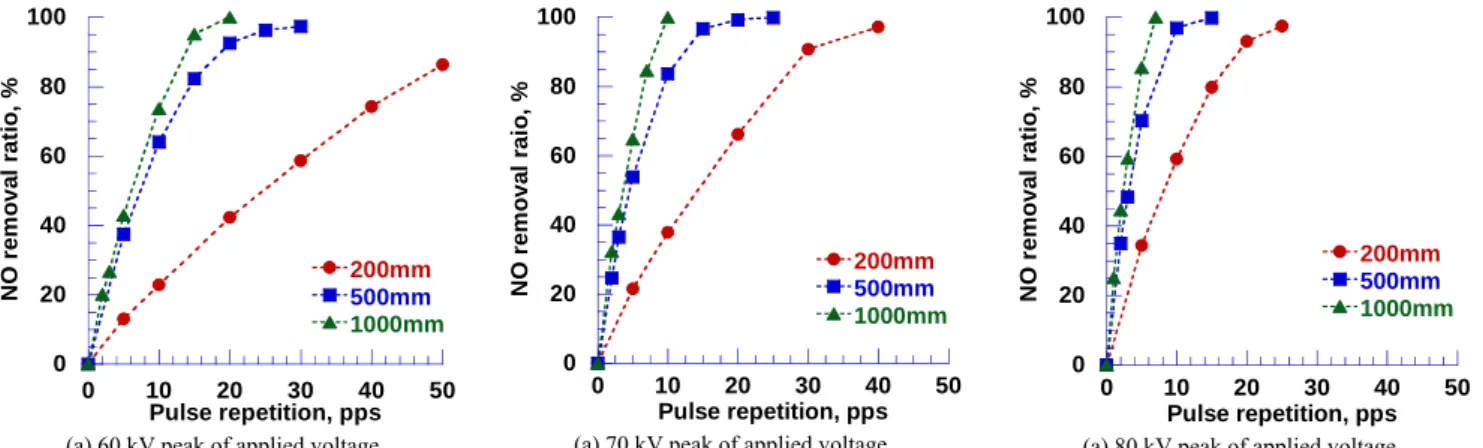
Fig. 6. Dependence of NO removal ratio on the pulse repetition rate.
Fig. 7. NO removal efficiency for input energy into the discharge electrode.
III. EXPERIMENTALRESULTS
A. Applied voltage to and discharge current through coaxial reactor
Fig.4 shows typical output waveforms of the applied voltage (a) and the discharge current (b) from ns pulse generator in different reactor length at 80 kV of peak applied voltage. From Fig.4, we can see that 2 ns of rise and fall times and 5 ns of pulse duration were obtained. Additionally, the duration of the current pulse became longer with longer reactor. Fig.5 shows typical output waveforms of the applied voltage (a) and the discharge current (b) from ns pulse generator in 1,000 mm long reactor at the different peak of applied voltage. As you can see from Fig.5 that the same rise, fall and duration times of the voltage waveform were obtained for the different peak of the applied voltage and the peak of the discharge current increased with the peak of the applied voltage.
B. NO removal ratio
Fig.6 shows the dependence of the NO removal ratio on the
pulse repetition rate in different reactor length. In these figures, horizontal axis is pulse repetition rate and vertical axis is NO removal ratio. From Figures, at the constant pulse repetition rate, the NO removal ratio increased with increasing the discharge reactor length for the different applied voltage. This is because the gas residence time in the reactor increased with the reactor length. In addition, the NO removal ratio increased with increasing the peak of applied voltage for the different reactor length. This is because that the volumes of formed plasma and input energy into the discharge electrode increased with applied peak voltage. Finally, under the experimental condition at 80 kV of peak of applied voltage and with the 1,000 mm of reactor length, 100 % of NO was removed completely at 7 pps of pulse repetition rate.
C. NO removal efficiency
NO removal energy efficiency was calculated by using formula (1) and, therefore, it based on the input energy to the discharge electrode per pulse. {NOE: NO removal efficiency [mol/kWh], G: Gas flow rate [L/min], NOR: NO removal quantity [ppm], f: Pulse repetition rate [pps], E: Input energy
0 20 40 60 80 100
0 10 20 30 40 50
200mm 500mm 1000mm
NO removal ratio, %
Pulse repetition, pps (a) 60 kV peak of applied voltage.
0 20 40 60 80 100
0 10 20 30 40 50
200mm 500mm 1000mm
NO removal raio, %
Pulse repetition, pps (a) 70 kV peak of applied voltage.
0 20 40 60 80 100
0 10 20 30 40 50
200mm 500mm 1000mm
NO removal ratio, %
Pulse repetition, pps (a) 80 kV peak of applied voltage.
0.2 0.3 0.4 0.5 0.6 0.7 0.8
0 20 40 60 80 100
200mm 500mm 1000mm
NO removal efficiency, mol/kWh
NO removal ratio, % (a) 60 kV peak of applied voltage.
0.2 0.3 0.4 0.5 0.6 0.7 0.8
0 20 40 60 80 100
200mm 500mm 1000mm
NO removal efficiency, mol/kWh
NO removal ratio, % (a) 70 kV peak of applied voltage.
0.2 0.3 0.4 0.5 0.6 0.7 0.8
0 20 40 60 80 100
200mm 500mm 1000mm
NO removal efficiency, mol/kWh
NO removal ratio, % (a) 80 kV peak of applied voltage.
into discharge electrode per pulse [J/pulse]} Fig.7 shows NO removal energy efficiency as a function of the NO removal ratio. As you can see, the NO removal energy efficiencies for all cases decreased with increasing the NO removal ratio. For example, in the case of using the 80 kV peak of applied voltage and 1,000 mm reactor length, the value of NOE at 70 % of NO removal ratio was 0.56 mol/kWh (16.8 g-NO/kWh), while the value of NOE at 25 % of NO removal ratio was 0.77 mol/kWh (23.1 g-NO/kWh). This is because the removal target decreased with increasing the NO removal ratio. It is also clear that the NO removal efficiency increased with increasing the discharge reactor length and peak of applied voltage. These are because the gas residence time in discharge reactor and volume of formed plasma increased. On the basis of these results, we considered that the higher peak of applied voltage and the longer reactor length have positive effects on efficient NOx removal.
D. Comparison ns pulsed discharge with conventional discharge ways
Fig. 8 shows NO removal characterization map for different discharge methods [19] (comparison NS pulsed discharge, Dielectric Barrier Discharge with Pulsed Corona Discharge) under the same condition of 200 ppm of initial NO concentration. In this figure, horizontal axis is NO removal ratio and vertical axis is removal energy efficiency. This characterization map is based on input energy to discharge
electrode. In figure, it is superior method so as to go to upper right corner. As you can see, Nano-seconds pulsed discharge developed in this work has better efficiency than other discharge methods.
E. By-products
In this NO removal experiment using nano-seconds pulsed discharge, very few amount of by-products such as NO2 and N2O are generated. The concentration of generated NO2 was 0 to 10 ppm and the concentration of generated N2O was 0 to 2 ppm. The concentration of by-products increased with increasing the pulse repetition rate.
IV. SUMMERY
Exhaust gas treatment using the ns pulse streamer discharge were experimentally investigated. The following conclusions have been deduced.
9 The higher peak of applied voltage and the longer reactor length brought in positive effects on efficient NOx removal.
9 The energy efficiency of NOx removal by Nano-seconds pulsed discharge was extremely higher than other discharge methods.
9 In NO removal using Nano-seconds pulsed discharge, By-products such as NO2 and N2O are slightly generated.
9 Nano-seconds pulsed streamer discharge can be one of the promising processes for pollution control.
REFERENCES
[1] L. Huang and H. Matsuda, "Removal of NO by a pulsed-corona reactor combined with in situ absorption", AIChE Journal, Vol.50, pp2676-2681, 2004
[2] F. Daou, A. Vincent, and J. Amouroux, "Point and multipoint to plane barrier discharge process for removal of NOx from engine exhaust gases:
understanding of the reactional mechanism by isotopic labeling", Plasma Chemistry and Plasma Processing, Vol.23, No.2, pp309-325, 2002 [3] G J J Winands, Z. Liu, A J M Pemen, E J M van Heesch, K. Yan and EM
van Veldhuizen, "Temporal development and chemical efficiency of positive streamers in a large scale wire-plate reactor as a function of voltage waveform parameters", Journal of Physics D: Applied Physics, Vol.39, pp3010-3017, 2006
[4] K. Takaki and T. Kujiwara, “Munuscript barrier discharge process for removal of NOx from diesel engine exhaust”, IEEE Trans. Plasma Sci., Vol.29, No.2, pp.268-272, 1998.
[5] T. Oda, T. Kato, T. Takahashi, and K. Shimizu, “Reduction of NOx from combustion flue gases by superimposed barrier discharge plasma reactor”, IEEE Trans, Industr. Applic, Vol.33, No.4, pp.879-886(1997)
[6] R. Hackam and H. Akiyama, “Air pollution control by electrical discharge”, IEEE Trans. Dielect. Elect. Insulation, Vol7, No.5, pp.654-683, 2000
[7] S. Daito, F. Tochikubo and T. Watanabe, "NOx removal process in pulsed corona discharge combined with TiO2 photocatalyst", The Japan Society of Applied Physics, Vol.40, pp2475-2479, 2001
[8] T. Namhira, H. Hori, D. Wang, S. Tsukamoto, S. Katsuki, H. Akiyama, M.
Shimizu, and K. Yokoyama, “Effect of NH3 on NOx Removal Using Pulsed Power”, T. IEE Japan, Vol.121-A, No.9, pp.834-840, 2001 [9] V. Puchkarev and M. Gundersen, "Energy efficient plasma processing of
gaseous emission using a short pulse discharge", Applied Physics Letters, Vol.71, pp3364-3366, 1997
[10] R. Ono and T. Oda, "Formation and structure of primary and secondary streamers in positive pulsed corona discharge-effect of oxygen concentration and applied voltage", Journal of Physics D: Applied Physics, Vol.36, pp1952-1958, 2003
[11] K. Urashima, J.-S. Chang, J.-Y. Park, D.-C. Lee, A. Chakrabarti, and T.
Ito, “Reduction of NO from natural gas combustion flue gases by corona
[
/]
(1)103 E f
] [min/
60 ]
/ 4[ 22 G 1
NOE mol kWhK
R h NO l mol .
×
×
×
×
×
=
0 0.2 0.4 0.6 0.8
0 20 40 60 80 100
NO removal eficiency, mol/kWh
NO removal raio, % NS Pulsed Discharge
Pulse Corona Discharge DBD
Fig. 8. NO removal characterization map of different discharge methods.
discharge radical injection techniques,” IEEE Trans. Indust. Appl., vol. 34, pp. 934–939, 1998.
[12] B. M. Penetrante, “Pollution control applications of pulsed power technology,” in 9th IEEE Int. Pulsed Power Conf., Albuquerque, NM, 1993, pp. 1–5.
[13] I. Gallimberti, “Impulse corona simulation for flue gas treatment,” Pure Appl. Chem., vol. 60, pp. 663–674, 1988.[18] K. Urashima, J.-S. Chang, and T. Ito, “Reduction of NO from combustion flue gases by superimposed barrier discharge plasma reactors,” IEEE Trans. Indust.
Appl., vol. 33, pp. 879–886, 1997.
[14] D. Bhasavanich, S. Ashby, C. Deeney, and L. Schlitt, “Flue gas irradiation using pulsed corona and pulsed electron beam technology,” in Proc. 9th IEEE Int. Pulsed Power Conf., Albuquerque, NM, 1993, pp. 441–444.
[15] J.-S. Chang, P. C. Looy, K. Nagai, T. Yoshioka, S. Aoki, and A. Maezawa,
“Preliminary pilot plant tests of a corona discharge-electron beam hybrid combustion flue gas cleaning system,” IEEE Trans. Indust. Appl., vol. 32, pp. 131–137, 1996.
[16] Ryo Ono and Tetsuji Oda, “Nitrogen oxide γ-band emission from primary and secondary streamers in pulsed positive corona discharge”, Journal of Applied Physics 97, 2005
[17] T. Namihira, S. Tsukamoto, D. Wang, S. Katsuki, R. Hackam, H.
Akiyama, Y. Uchida and M. Koike: “Improvement of NOX removal efficiency using short width pulsed power”, IEEE Transactions on Plasma Science, Vol.28, 2000
[18] T. Namihira, D. Wang, T. Matsumoto, S. Okada, H. Akiyama,
“Introduction of nano-seconds pulsed discharge plasma and its applications”, IEEJ Transactions on Fundamentals and Materials, Vol.129, pp7-14, 2009
[19] Y. Kim, ”Experimental and Numerical Analysis of Streamers in Pulsed Corona and Dielectric Barrier Discharges”, IEEE Transitions on plasma science, Vol.32, No. 1, 2004
Takao Matsumoto (M’09) was born in Fukuoka, Japan, on September 21, 1984. He received the B.S.
and M.S. degrees from Kumamoto University, Kumamoto, Japan, in 2009 and 2010, respectively.
Since 2010, He will be perusing Ph.D degree studies in Kumamoto University, as a JSPS Research Fellow.
Douyan Wang (M'04) was born in Beijing, China, on May 18, 1975. She received the B.S., M.S. and Ph.D. degrees from Kumamoto University, Kumamoto, Japan, in 1998, 2000, and 2005 respectively.
From 2000 to 2002, she was with Hitachi, Ltd., Ibaraki, Japan. From November 2003 to March 2004, she was on sabbatical leave at the Center for Pulsed Power and Power Electronics, Texas Tech University, Lubbock. She was a JSPS Research Fellow during 2003 to 2005. During 2005 to 2007, she was a Research Associate with the 21st Century Center of Excellence (COE) Program, Kumamoto University. Since 2007, she has been an Assistant Professor of Priority Organization for Innovation and Excellence, Kumamoto University.
Dr. Wang was the recipient of the Excellent Student Award of the IEEE Fukuoka Section in 2005.
Takao Namihira (M’00-SM’05) was born in Shizuoka, Japan, on January 23, 1975. He received the B.S., M.S., and Ph.D. degrees from Kumamoto University, Kumamoto, Japan, in 1997, 1999, and 2003 respectively.
From 1999 to 2006, he was a Research Associate at Kumamoto University, where he is currently as Associate Professor. During 2003-2004, he was on sabbatical leave at the Center for Pulsed Power and Power Electronics, Texas Tech University, Lubbock.
Hidenori Akiyama (M’87–SM’99–F’00) received Ph.D. degree from Nagoya University, Nagoya, Japan, in 1979.
From 1979 to 1985, he was a Research Associate at Nagoya University. In 1985, he joined the faculty at Kumamoto University, Kumamoto, Japan, where he is currently a Professor.
He received the IEEE Major Education Innovation Award in 2000 and the IEEE Peter Haas Award in 2003.
![Fig. 8 shows NO removal characterization map for different discharge methods [19] (comparison NS pulsed discharge, Dielectric Barrier Discharge with Pulsed Corona Discharge) under the same condition of 200 ppm of initial NO concentration](https://thumb-ap.123doks.com/thumbv2/123deta/5661434.2007381/4.892.83.418.714.1001/characterization-different-discharge-comparison-dielectric-discharge-discharge-concentration.webp)
