Factors associated with tuberculosis cases in Semarang District, Indonesia: case‑control study performed in the area where case
detection rate was extremely low
著者 スリ ラトナ ラハユ
著者別表示 Sri Ratna Rahayu journal or
publication title
博士論文本文Full 学位授与番号 13301甲第4292号
学位名 博士(医学)
学位授与年月日 2015‑09‑28
URL http://hdl.handle.net/2297/44647
doi: 10.1007/s12199-015-0443-9
Creative Commons : 表示 ‑ 非営利 ‑ 改変禁止 http://creativecommons.org/licenses/by‑nc‑nd/3.0/deed.ja
1 Factors associated with tuberculosis cases in Semarang District Indonesia; case-control 1
study performed in the area where Case Detection Rate was extremely low 2
3
Sri Ratna Rahayu1, Hironobu Katsuyama2, Masashi Demura1, Midori Katsuyama1, Yoko Ota1, 4
Hideji Tanii1, Tomomi Higashi1, Ngakan Putu Djaja Semadi3 and Kiyofumi Saijoh1. 5
1Kanazawa University School of Medicine, Kanazawa 9208640 Japan, 6
2Department of Public Health, Kawasaki Medical University, Kurashiki 7011092, Japan 7
3Health Department Semarang District, MT Haryono 29 Ungaran, Semarang District, 8
Indonesia.
9
10
Correspondence:
11
Kiyofumi Saijoh, MD, PhD 12
Professor and chairperson 13
Department of Hygiene 14
Kanazawa University School of Medicine 15
13-1 Takaramachi, 16
Kanazawa 9208640, Japan 17
2 Email: [email protected]
18
Keywords 19
Tuberculosis, Case Detection Rate, Risk factors, Indonesia, DOTS.
20
3 Abstract
21
Objectives Indonesia is ranked to be the 4th as a contributor to the Tuberculosis (TB) in the 22
world. Semarang District in Central Java displays extremely low Case Detection Rate (CDR), 23
possibly contributing to the local prevalence of TB.
24
Methods Case-control study was performed to explore the factors cause of such low CDR.
25
We recruited 129 TB cases and 83 controls that visited the same centers and were not 26
diagnosed as TB.
27
Results The cases had 7.5 ± 2.3 symptoms/person in average, indicating the delay of 28
diagnosis because the controls only displayed 1.0 ± 1.7. The multiple logistic regression 29
analysis comparing the cases/controls extracted following factors as a risk to have TB; farmer, 30
close contact with TB patients, ignorance of whether Bacillus Calmette-Guérin (BCG) was 31
accepted or no, smoking, low income, a lot of people living in the same room, irregular hand 32
wash before meals, not wash hands after blow, soil floor, and no sunlight and no ventilation in 33
the house.
34
Conclusions Neither the cases nor the controls always knew the symptoms and how to avoid 35
TB infection probably causes the delay of diagnosis. It is difficult to change the current living 36
condition. Thus, the amendment of the community based education program of TB seems to 37
4 be required.
38
Abbreviations 39
BCG : Bacillus calmette-guérin 40
CDR : Case detection rate 41
CI : Confidence Interval 42
DOTS : Directly observed treatment short-course 43
HIV : Human immunodeficiency virus 44
MA : Monovariate analysis 45
MDR : Multidrug resistant 46
MLR : Multiple logistic regression analysis 47
TB : Tuberculosis 48
5 1. Introduction
49
Tuberculosis (TB) is one of the biggest problems throughout the world and a leading cause of 50
death and major public health problem [1]. Many people with TB remain poor in diagnosis or 51
are diagnosed only after long delays. The high burden of undiagnosed TB causes much 52
suffering economic hardship and sustained transmission [2-4].
53
According to Global Tuberculosis Report 2012 [5], Indonesia is ranked to the 4th 54
(0.4 million-0.5 million) as a contributor to the TB world after India (2.0 million-2.5 million), 55
China (0.9 million-1.1 million), and South Africa (0.4 million-0.6 million). Since 2000, 22 56
high burden countries account for 82 % of all estimated incident cases [5].
57
The discovery of TB in Indonesia in 2011 is 807 per 100,000 populations and that in 58
Central Java is 637 per 100,000 populations [6]. The TB Case Detection Rate (CDR) of 59
Central Java Province is estimated to be 56.93 % [7], but among its local districts, Semarang 60
District displays extremely low CDR being 19.21 % [8]. National targets for TB control 61
strategy Indonesia, the strategic plan of the Ministry of Health from 2010-2014, is to reduce 62
the TB prevalence to 224 per 100,000 populations. Output targets are (1) to increase the CDR 63
of new cases of smear-positive pulmonary TB from 73 % to 90 %, (2) to reach the percentage 64
of successful treatment of new cases of smear positive pulmonary TB to 88 %, (3) to increase 65
6
“the percentage of province with CDR above 70 %” to reach 50 %, and (4) to increase “the 66
percentage of the province with treatment success rate being above 85%”, from 80 % to 88 % 67
[9].
68
To achieve the national targets controlling TB, some strategies seem to be very 69
important; empowerment in the community; early detection and registration of TB patients;
70
improvement of the quality Directly Observed Treatment short-course (DOTS) services;
71
facing the challenges of TB/HIV, Multidrug Resistant (MDR-TB) and childhood TB; to meet 72
the demands of society poor and other vulnerable groups [9]. Domain knowledge is very 73
important in the formation of action. In several developing countries, TB patients are 74
perceived to seek late care or avoid care, due to misunderstanding to popular TB etiologies 75
like sharing utensils, heavy labor, smoking, bewitchment and hereditary transmission 76
[10-12]. Thus, it seems very important to know the basic knowledge, attitude, and behavior of 77
the people in such a low CDR region to complete the TB programs.
78
In the present study, differences in the basic knowledge, attitude, and behavior were 79
compared among the TB cases registered in 2012 at the health centers in Semarang District 80
and the controls that visited the same health centers and diagnosed differently.
81
82
7 2. Methods
83
This study was designed to be Case-Control study [13] during 2012, January until 2013, 84
October. The TB cases (129) were recruited among the cases registered with TB diagnosis at 85
the health centers in Semarang District, and 50 % were female. The controls (83) were 86
recruited among those who visited the same health centers and were diagnosed differently, 87
and 52 % were female. Average age of the cases and controls (Mean ± SD) was 41.2 ± 15.3 88
and 35.7 ± 11.7, respectively. This research was approved by the ethical comities of 89
Kanazawa University School of Medicine, Japan and Diponegoro University School of 90
Medicine, Dr Kariadi Hospital Semarang, Indonesia and Semarang State University, 91
Indonesia. All participants approved this research by written informed consent.
92
TB information of the cases 93
TB cases were sent to the Health Center from clinics and diagnosed to have TB using 94
physical examination, microscopic examination by Ziehl Neelsen staining, X-ray, etc.
95
Way of diagnosis, symptoms they had, and way of treatment were examined. All of them 96
were treated with DOTS properly regardless of having side effects or not.
97
Characteristics of the cases and controls 98
Demographic characteristics like gender, age, occupation, origin, BCG experience, close 99
8 contact with TB patients, smoking habit, having pets, and income was examined. Source of 100
TB information (multiple answers) was also examined. Thereafter, differences in living 101
condition and attitudes in daily life were examined.
102
Knowledge and opinion about TB 103
Symptoms of TB (multiple answers) and the way to avoid TB (multiple answers) that the 104
participants thought were questioned. Differences in the opinion and attitude against TB 105
between the cases and controls were examined.
106
Statistical analysis 107
The difference in the age and numbers of complaint of the cases and controls was estimated 108
using Student’s t-test. The differences in the frequency of answers between the cases and the 109
controls were estimated by Chi-square (χ²) test (monovariate analysis, MA). Multiple logistic 110
regression analysis (MLR) with the cases/the controls as the dependent valuable was utilized 111
with the independent variables using groups classified by characteristics of the cases and 112
controls. All analyses were performed with SPSS ver. 19 (SAS Institute Inc., Cary, NY). In 113
all analyses, ρ < 0.05 was taken to indicate statistical significance.
114
115
3. Results 116
9 The 129 cases included 65 male and 64 female, respectively, and the average age was 41.2 ± 117
15.3 (Table 1). Although all the cases were registered at the health centers, around 20 % were 118
diagnosed at the different medical facilities (Table 2). Sputum smear was the first choice for 119
diagnosis [1, 14], but 20 cases were diagnosed without any clinical examination. Chest X-ray 120
was utilized for the diagnosis of more than half of the cases. Long lasting cough with sputum 121
was the most common symptom that was followed by chest pain, malaise, anorexia, and 122
weight loss. Around two third displayed hemoptysis, dyspnea, sweat at night, and long lasting 123
sub fever at night. The cases had many symptoms being 7.5 ± 2.3 complaints/person in 124
average. These cases were registered, hence all of them underwent to treatment, whether they 125
knew it was under DOTS or not (Table 3). Nine had no supervisors and at least one fourth had 126
to pay treatment fee, suggesting that they were not under DOTS. More than 85 % of the cases 127
quit taking medicine at 6 months, regardless of frequency of medication in first 2 months.
128
Treatment with 4 drugs was the most common, but that with 2 drugs was also observed in 129
around 15 % of the cases. Sputum smear was the most common examinations during 130
treatment followed by chest X-ray.
131
The controls were selected from people visited the same health center and 132
diagnosed not having TB. We tried to obtain age-gender-matched control. We could achieve 133
10 gender-matched, but their age was slightly younger than the cases (Table 1). Around 80 % of 134
the cases were farmers and around 30 % of them graduated from elementary school alone.
135
More than half of the controls received BCG whereas more than half of the cases did not 136
know whether they received BCG or not. Nine percent of the cases experienced close contact 137
with TB patients but none of the controls did. Income of the cases was significantly lower 138
than that of the controls, and three fourth of them got less than 100 $/month. The cases were 139
diagnosed already, hence they got the TB information from medical staff more than the 140
controls, but they usually did not use other sources (Table 1). When the living conditions 141
were compared, all conditions were significantly different between the cases and the controls 142
(Table 4). “Ceramic floor”, “outside kitchen”, “gas for cooking”, “open windows everyday”, 143
“sunlight into the house”, and “ventilation in every room” were more common in the controls, 144
whereas “window in each room” and high “humidity in the house” were in the cases.
145
The cases less frequently “washed their hands before eating” but more frequently 146
“shared the dishes with others” and “drunk from the same glasses/bottles” than the controls 147
(Table 5). They also less frequently “washed their hands after blowing” than the controls, 148
whereas no difference was observed in the frequency of whether “they worked when they felt 149
unwell” between these two groups.
150
11 In order to clarify what kinds of these physical factors were most affected 151
difference in the cases and the controls, the MLR was applied (Table 6). The cases/controls 152
were the dependent variables and the groups divided by above mentioned information were 153
used as determinants. The way of obtaining TB information was removed from the 154
determinant because that from the cases was modified as described above. The obtained risks 155
were “farmers”,”close contact with TB patients”, “whether or not they did not know they 156
received BCG”, “smoking”, and “low income; ˂ 100 $/month”. “High income; ˃ 150 $/month”
157
was also extracted as a risk compared with “middle income; 100-150 $/month”. To “wash 158
hands before eating”, “wash hands after blow” and “not work when unwell” were protective.
159
Among living conditions, “live with ≥ 3 person in the same room”, “soil floor”, no “sunlight 160
in the house” and no “ventilation in the house” were extracted as risk.
161
Regardless of many symptoms, the cases did not always display significant 162
differences with the controls among the opinion regarding what they thought was TB 163
symptoms (Figure 1). “Long lasting sub fever” alone was significantly higher in the controls.
164
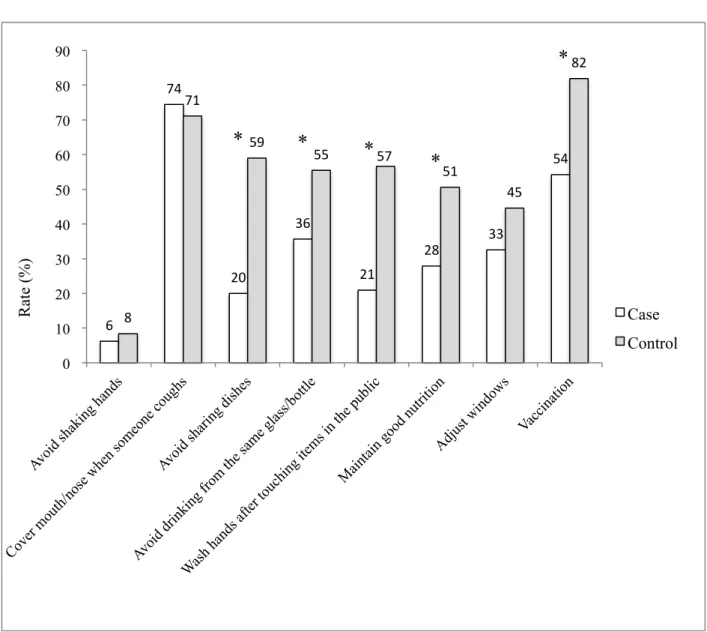
More than 70 % of both the cases and the controls thought that it was important to 165
“cover mouth/nose when someone sneezed” (Figure 2). More than half of the controls thought 166
that “avoid sharing dish”, “avoid drinking from the same glass/bottle”, “wash hands after 167
12 touching items in the public” and “maintain good nutrition” were the way to avoid getting TB 168
and the rates were significantly higher than the cases. In fact, 76 % of the controls washed 169
hands before eating and only 35 % of the cases did so (Table 5). Moreover, 76 % (9 + 67) of 170
the cases at least sometimes “shared the dish” and” drunk from the same glass”, that was 171
significantly higher than the controls. On the other hand, 87 % (39 + 48) of the controls at 172
least sometimes “washed hands after blowing”. “Vaccination” was also higher in the controls 173
than the cases (Figure 2).
174
Opinions related to the seriousness and shame, did not display any significant 175
difference between the cases and the controls (Table 7). Although many of the cases and 176
controls thought TB to be “serious”, they did not always think that TB was “serious at 177
workplaces” and “affected work performance”. Significant difference was not observed in 178
“be ashamed of having TB” but the cases were tended to want to “hide having TB”.
179
Significantly more controls thought “TB affected relationship with others” and “wanted to 180
live isolated”, whereas there was no significant difference in “TB affected family 181
responsibility” against the controls. Both of the cases and controls usually tried to be good at 182
TB patients. Around 50 % of the controls believed “TB treatment was very costly” but 183
around one fourth of the cases thought so. “HIV positive people should concern about TB”
184
13 was significantly higher in the controls than in the cases. Around one fourth to one third of 185
the cases and controls believed that TB was hereditary.
186
4. Discussion 187
In Indonesia, regular health examination was not mandatory [6]. Therefore, after symptoms 188
became apparent, the person visited the clinic where sputum smear was not always available.
189
The cases in the present study displayed 7.5 ± 2.3 complaints/person in average, indicating 190
the delay of diagnosis [15]. Although early diagnosis and initiation of treatment of infectious 191
cases is the best measure to reduce transmission [3, 16, 17], in some countries, 20 % of 192
patients were not diagnosed for over 6 months from the onset of symptoms [18]. Even after 193
the symptoms became obvious, for diagnosis, it took at least 2 more days because positive TB 194
was defined as more than 2 positive sputum smears in the smear performed three times within 195
2 days [14]. Household contacts continued meantime, when patients were with potentially 196
infectious forms proceeding to high prevalence of TB [19, 20]. On the other hand, culture was 197
not common, whereas patients with smear-negative, culture-positive TB were reportedly 198
responsible for TB transmission [21, 22]. Immediate introduction of culture examination is 199
required because, in addition to high sensitivity, it allows determining whether the patient is 200
sensitive to anti-TB drugs and useful for finding extra pulmonary TB [14]
201
14 The cases did not always know whether they were under DOTS treatment or not, but all the 202
cases could luckily quit taking medicine regardless of the obvious delay of diagnosis. Around 203
80 % of the cases were farmer, and around 30 % graduated elementary school alone, hence 204
their income was lower than the controls. Low income and low education are reportedly 205
associated with TB infection [4, 23-25]. They also had lost the chance of BCG injection. This 206
occupation was also extracted as a risk by the MLR. However, the MLR extracted high 207
income as a risk as well. Such a result is not always in accordance with several studies [4, 208
23-25], whereas it is conceivable that people with high income, regardless of their occupation, 209
had more chances to live and/or work at the places with a lot of people where a risk of TB 210
transmission was supposed to be high. The number was small but only cases had a chance to 211
close contact with TB patients. TB contact was absolutely the risk of TB transmission [18, 26].
212
No significant difference in the rate of “smoking” by the MA, but the MLR extracted 213
“smoking” as a risk to be the case. This is in good accordance with the previous report [23]. It 214
is natural that the cases “source of TB information” was medical staff, but the cases were not 215
always eager to collect information from other sources comparing with the controls. All the 216
items related living condition was significantly different between the cases and the controls 217
by the MA. Among them, the MRL extracted “small number of the person in the room”, 218
15
“ceramic floor”, “sunlight in the house”, and “ventilation in the house” as protective.
219
Importance of good ventilation was emphasized elsewhere [3, 23]. Excluding “work when 220
unwell”, their attitudes displayed significant differences between the cases and the controls by 221
the MA. “Share the dish” and “drink from the same glasses/bottles” were not extracted by the 222
MLR. Instead, “work when unwell” was extracted as well as “wash hands before eating” and 223
“wash hands after blow”. These findings may be a reflection that TB is airborne. In general, 224
the cases were not aware of danger in their attitudes, which was in good accordance with 225
previous reports [10-12].
226
Both of the cases and the controls did not recognized “dyspnea” and “chest pain” as TB 227
symptoms. Significant differences existed, but “long lasting sub fever” was also not 228
considered as TB symptoms. “dyspnea”, “chest pain” and “long lasting sub fever” were less 229
frequent than “cough with sputum”, “malaise” and so on but number of the cases complaint 230
them. Thus, it seems necessary to let the people know the TB symptoms [10-12].
231
TB itself was recognized to be dangerous both by the cases and the controls, but they did not 232
recognize its dangerousness at work places. Many of the cases were farmers; hence it seems 233
less possible to spread TB than workers. However, TB positive workers can work and be able 234
to transmit TB to their colleagues. Comparing with the rate of both the cases and the controls 235
16 who thought “having TB was a shame”, that of “wanted to hide having TB” was less. It seems 236
natural that more controls who did not receive TB treatment believed that TB was “affected 237
relationship with others” and wanted to “live isolated in case of TB” than the cases. DOTS 238
performed under the governmental hospitals and health centers were free [9], but some cases 239
visiting private hospitals/clinics had to pay the treatment fee. Higher rate of “HIV positive 240
people should be concerned about TB” in the control was reflection that they were more eager 241
to collect information than the cases. HIV infection reportedly affected TB infection [27].
242
However, the number who believed “TB was hereditary” was not different between two 243
groups.
244
Some aspects underlying the low coverage CDR are problems of socioeconomic, 245
education/knowledge and stigma [4]. Economic conditions will affect the public in getting not 246
only good environmental home conditions but also the excellent level of education. The level 247
of education in this study was relatively low because many people only finished elementary 248
school where sufficient TB education was impossible. Poor education will cause shortage of 249
knowledge about TB, leading the public into embarrassment and sometimes attitude to hide 250
their disease if they exposed to TB. Such conditions may cause the delay for some people to 251
go to the health service [18]. As a result, TB was spread among the farmers even when their 252
17 contact was not always intense like workers. It is very difficult to change occupation, income 253
and housing condition, immediately. Thus, community based TB education is very important.
254
It may be useful to educate and expose not only public but also private practitioners to the 255
community based TB program [9, 28].
256
Some cases were not dependent on the free DOTS program. To inform the existence of this 257
program is also a good education. Utilization of this program not only reduces multi-drug 258
resistant TB, but also helps reducing out-of-pocket expenses to patients [27]. Number of 259
syndromes of the cases absolutely indicated the delay of diagnosis.
260
The classic symptoms of TB are fever, cough and weight loss, but they are non-specific and 261
can be mimicked by other conditions, including malignancy and other pulmonary infections.
262
That is, in an early stage, such syndromes are not always specific to TB. However, 263
importance of these classic lung related syndromes should be aware that they are possible 264
signs of initiation of TB expansion [29].
265
266
Acknowledgements 267
We would like to thank to Semarang State University, Directorate General of Higher 268
Education (DGHE or DIKTI) and Health Department Semarang District, for all support.
269
18 Conflict of Interests
270
The authors declare that there is no conflict of interests regarding the publication of this 271
paper.
272
19 References
273
1. WHO. Systematic Screening for active TB. WHO: World Health Organization, 20 274
Avenue Appia, 1211 Geneva 27 Switzerland, 2013.
275
2. Bauer, M., A. Leavens, and K. Schwartzman, A systematic review and meta-analysis 276
of the impact of tuberculosis on health-related quality of life. Qual Life Res. 2013; 22:
277
2213-35.
278
3. Saxena, S., V. Karkhanis, and J.M. Joshi, Tuberculosis prevention: an enigma worth 279
unravelling. Indian J Tuberc. 2012; 59: 65-7.
280
4. Wu, J. and K. Dalal, Tuberculosis in Asia and the pacific: the role of socioeconomic 281
status and health system development. Int J Prev Med. 2012; 3: 8-16.
282
5. WHO. Global Tuberculosis Report 2012. WHO, 20 Avenue Appia, 1211–Geneva–27, 283
Switzerland, 2012:11.
284
6. Ministry of Health , R.I. Current Report of Development of Tuberculosis in Indonesia 285
January-December 2012. Ministry of Health Republic Indonesia: Jakarta, Indonesia, 286
2012.
287
7. Ministry of Health , R.o.I. Profile of Health Data of Indonesia in 2011. Ministry of 288
Health of The Republic of Indonesia: Jakarta, Indonesia. 2012, 289
8. Health Department , S.D. Reported TB Cases in Semarang District, 2011. Semarang 290
District, Central Java, Indonesia.2011.
291
9. Ministry of Health, R.O.I, Directorate General of Disease Control and Environmental 292
Health National. Strategy for Controlling TB in Indonesia 2010-2014. Republic Of 293
Indonesia Health Ministry Directorate General of Disease Control and Environmental 294
Health , Jakarta, 2011.
295
10. Notoatmodjo, S. Health promotion and behavioral sciences. Jakarta: Rineka Cipta.
296
2007.
297
11. Tasnim, S., A. Rahman, and F.M. Hoque, Patient's Knowledge and Attitude towards 298
Tuberculosis in an Urban Setting. Pulm Med. 2012; 2012: 352850.
299
12. Buregyeya, E., et al., Tuberculosis knowledge, attitudes and health-seeking behaviour 300
in rural Uganda. Int J Tuberc Lung Dis. 2011; 15: 938-42.
301
13. Raj S. Bhopal, A.B.a.J.U.P.o.P.H., et al., Concepts of Epidemiology, an itegrated 302
introduction to the ideas, theories, principles and methods of epidemiology. 2002, 303
United States,New York: Oxford University.
304
14. Health Minister of The Republic of Indonesia, N.M.S.V. Tuberculosis Control 305
20 Guidelines. Health Minister of The Republic of Indonesia Jakarta, Indonesia, 2009.
306
15. Ahmad, R.A., et al., Diagnostic delay amongst tuberculosis patients in Jogjakarta 307
Province, Indonesia is related to the quality of services in DOTS facilities. Trop Med 308
Int Health. 2011; 16: 412-23.
309
16. Dye, C., Tuberculosis 2000-2010: control, but not elimination. Int J Tuberc Lung Dis.
310
2000; 4: S146-52.
311
17. Reid, M.J. and N.S. Shah, Approaches to tuberculosis screening and diagnosis in 312
people with HIV in resource-limited settings. Lancet Infect Dis. 2009; 9: 173-84.
313
18. Yang, Y.R., et al., Evaluation of the tuberculosis programme in Ningxia Hui 314
Autonomous region, the People's Republic of China: a retrospective case study. BMC 315
Public Health. 2012; 12: 1110.
316
19. Batra, S., et al., Childhood tuberculosis in household contacts of newly diagnosed TB 317
patients. PLoS One. 2012; 7: e40880.
318
20. Jensen, P.A., Centers for Disease Control and Prevention (U.S.), and National Center 319
for HIV STD and TB Prevention (U.S.), Guidelines for preventing the transmission of 320
Mycobacterium tuberculosis in health-care settings, 2005. MMWR recommendations 321
and reports. 2005, Atlanta, GA: U.S. Dept. of Health and Human Services, Public 322
Health Service, Centers for Disease Control and Prevention. 141 p.
323
21. Kanaya, A.M., D.V. Glidden, and H.F. Chambers, Identifying pulmonary tuberculosis 324
in patients with negative sputum smear results. Chest. 2001; 120: 349-55.
325
22. Sarmiento, O.L., et al., Assessment by meta-analysis of PCR for diagnosis of 326
smear-negative pulmonary tuberculosis. J Clin Microbiol. 2003; 41: 3233-40.
327
23. Oxlade, O. and M. Murray, Tuberculosis and poverty: why are the poor at greater risk 328
in India? PLoS One. 2012; 7: e47533.
329
24. Shen, X., et al., Tuberculosis in an urban area in China: differences between urban 330
migrants and local residents. PLoS One. 2012; 7: e51133.
331
25. Clark, M., P. Riben, and E. Nowgesic, The association of housing density, isolation 332
and tuberculosis in Canadian First Nations communities. Int J Epidemiol. 2002; 31:
333
940-5.
334
26. Sacchi, F.P.C., et al., Sugar cane manufacturing is associated with tuberculosis in an 335
indigenous population in Brazil. Transactions of the Royal Society of Tropical 336
Medicine and Hygiene. 2013; 107: 152-157.
337
27. Ismail, I. and A. Bulgiba, Determinants of unsuccessful tuberculosis treatment 338
outcomes in Malaysian HIV-infected patients. Prev Med. 2013; 57: S27-30.
339
21 28. Artawan Eka Putra, I.W., et al., Factors associated to referral of tuberculosis suspects 340
by private practitioners to community health centres in Bali Province, Indonesia. BMC 341
Health Serv Res. 2013; 13: 445.
342
29. Davies, P.D.O., P.F. Barnes, and S.B. Gordon, Clinical tuberculosis. 4th ed. 2008, 343
London: Hodder Arnold 344
345 346
22
1
Figure 1. TB symptoms
77
64 64
16 14 47
54 50
22 15
26 69
67 67
19 20 37
52 59
34
31 30
0 10 20 30 40 50 60 70 80 90
Rate (%)
Case Control
*
2
Figure 2. The way to avoid getting TB
6
74
20
36
21
28 33
54
8
71
59
55 57
51
45
82
0 10 20 30 40 50 60 70 80 90
Rate (%)
Case Control
* * * *
*
3
Figure legends Fig.1
Differences in the knowledge about TB symptoms between the cases and controls (multiple answer). *Significant differences (ρ< 0.05, χ2 test and Student’s t-test).
Fig. 2
Differences in the way that the cases and controls thought it good to avoid getting TB
*Significant differences (ρ < 0.05, χ2 test).
1 Table 1. Demographic characteristics of the cases and control
Cases Cases
Controls Controls
Cases Controls
N % N % N % N %
Total 129 83 Smoking
Gender No 41 32 34 41
Male 65 50 40 48 No, but family smokes 45 35 28 34
Female 64 50 43 52 Yes 44 34 21 25
Occupation* Pet
Farmer 101 78 31 37 Yes 67 52 34 41
Others 28 22 52 63 No 62 48 49 59
Education* Income*
Elementary school 38 29 8 10 <100 96 74 38 46
Jr high school 59 46 32 39 100-150 19 15 31 37
High school or higher 32 25 43 52 >150 14 11 14 17
Origin
Rural 106 82 70 84 Source of TB information (multiple answer)
Urban 23 18 13 16 Broadcast# 74 57 64 77
Have you ever had BCG?* Billboards# 10 8 20 24
Yes 33 26 46 55 Newspaper# 18 14 23 28
No 30 23 21 25 Medical# 89 69 37 45
Don't know 66 51 16 19 Acquaintance# 9 7 24 29
Close contact with TB patients* Teacher# 6 5 25 30
Yes 18 9 0 0
No 111 86 83 100
Average age of the case and control (Mean ± SD) was 41.2 ± 15.3 and 35.7 ± 11.7, respectively, and the difference was significant (ρ < 0.05, Students' t-test).
*Significant difference in the rate of answers between the case and the control (ρ < 0.05, χ² test).
#For multiple answer questions, the difference in the rate of each source was examined using χ² test. The case and control displayed significant differences in all sources (ρ < 0.05).
2 Table2. The way of diagnosis and symptoms
N %
Location of diagnosis
Health center 101 78 Private clinic 16 13 Others 12 9
Way of diagnosis
No clinical examination 20 16 Smear alone 39 30
Smear, X-ray 70 54
Symptoms (multiple answer)
Cough with sputum 125 97 Cough >2w 123 95 Hemoptysis 78 60 Dyspnea 86 67 Chest pain 102 79 Malaise 108 84 Anorexia 108 84 Weight loss 101 78 Sweat at night 77 60 Sub fever >1 Mo 72 56
Mantoux test was utilized only in 2 cases. The mean ± SD of complaints/
person was 7.5 ± 2.3, whereas that of the controls only have 1.0 ± 1.7 (ρ < 0.05, Students' t-test.)
3 Table3. Information related to treatments of the cases
N %
Was treatment made under DOTS?
Yes 80 62
No 14 11
Don't know 35 27
Who was a supervisor ?a
Family 86 67
Medical Service 67 52
None 9 7
Was treatment free of charge?
Yes 80 62
No 33 26
Don't know 16 12
How long was the duration of treatment?
<6 Mo 7 5
6Mo 112 87
>6Mo 10 8
How frequent do you take medication within first 2 Mo?
Everyday 80 62
1x/week 35 27
Longer 14 11
How many kinds of drugs did you take?
2 19 15
3 34 26
4 70 54
5 6 5
Were you suffered from side effects?
+ 70 54
Which examinations were utilized during treatment ?b
Sputum smear 104 81
Chest X-ray 79 61
Sputum culture 11 8.5
Mantoux test 11 8.5
Distance to the health center
≤5 min 85 66
≤30 min 21 16
Longer 26 18
a35 cases were supervised both by family and medical staff.
b76 cases were subjected more than 2 examinations.
4 Table 4.Comparison in living condition of the participants
Cases Controls
N % N %
Number of person in the same room*
1 15 12 10 12
2 84 65 72 87
>3 30 23 1 1
House floor*
Soil 35 27 2 2
Plaster 49 38 18 22
Ceramics 45 35 63 76
Location of kitchen*
Outside 51 40 60 72
Inside 78 60 23 28
Fuel for cooking*
Cordwood 52 40 8 10
Gas 77 60 75 90
Window in each room*
Yes 52 40 8 10
No 77 60 75 90
Open windows every day*
Yes 43 33 60 72
No 86 67 23 28
Sunlight into the house*
Yes 66 51 76 92
No 63 49 7 8
Ventilation in every room*
Yes 50 39 75 90
No 79 61 8 10
Humidity in the house*
Humid 84 65 17 20
Not humid 45 35 66 80
*Significant difference between the cases and the controls (ρ < 0.05, χ² test).
5 Table 5. The differences in attitudes that the participants usually do
Cases Control
N % N %
Do you wash your hands before eating?*
Yes 45 35 63 76
Sometimes 72 56 18 22
No 12 9 2 2
Do you eat from the same dish with others?*
Yes 11 9 8 10
Sometimes 86 67 28 33
No 32 25 47 57
Do you drink from the same glasses/bottles with others?*
Yes 7 5 9 11
Sometimes 92 71 35 42
No 30 23 39 47
Do you wash your hands after blowing?*
Yes 25 19 40 48
Sometimes 69 53 32 39
No 35 27 11 13
Do you work when you are unwell?
Yes 23 18 25 30
Sometimes 78 60 40 48
No 28 22 18 22
*Significant difference between the cases and the controls (ρ < 0.05, χ² test).
6 Table 6. Multiple logistic regression analysis using case/control as the dependent valuable and living status as determinants
Comparison Reference Odds P (95 % CI) Occupation
Workers Farmers 0.05 <0.01 0.00 0.20 Others Farmers 0.05 0.01 0.00 0.54 Close contact with TB patients
No Yes 0.00 0.02 0.00 0.49 BCG
Yes Don't know 0.04 <0.01 0.00 0.32 Smoking
No Yes 0.14 0.04 0.01 0.92 Income ($/Mo)
100-150 <100 0.05 <0.01 0.00 0.33 100-150 >150 0.08 0.04 0.01 0.89 Person/room
1 ≥3 0.00 <0.01 0.00 0.35 2 ≥3 0.00 <0.01 0.00 0.27 Wash hands before eating
Yes Sometimes 0.06 <0.01 0.01 0.32 Wash hands after blow
Sometimes No 0.06 0.01 0.01 0.46 Work when unwell
No Yes 0.09 0.02 0.00 0.66 Floor
Ceramics Soil 0.06 0.04 0.00 0.90 Sunlight in the house
Yes No 0.06 0.02 0.00 0.67 Ventilation in the house
Yes No 0.02 <0.01 0.00 0.24 Source of TB information (multiple answer) was excluded because this information was modified by consultation of the cases to the health center. Among determinants, age class, gender, education, pet, share the dishes, drink from the same bottle/glass, location of kitchen, fuel for cooking, open the window everyday, and humidity in the house were not selected.
7 Table 7. Differences in the opinion against TB between the cases and controls
Cases Controls
N % N %
Do you think that TB is serious?
Yes 91 71 67 81
No 2 2 3 4
Don't know 36 28 15 18
Do you think that TB is serious at work places?
Yes 46 36 34 41
No 14 11 10 12
Don't know 69 53 39 47
Does TB affect your work performance?
Yes 51 40 43 52
Not always 60 47 29 35
No 18 14 11 13
Do you be ashamed of having TB?
Yes 49 38 22 27
No 53 41 35 42
Don't know 27 21 26 31
Do you want to hide having TB?*
Yes 14 11 10 12
Not always 74 57 30 36
No 41 32 43 52
Does TB affect relationship with others?*
Yes 20 16 36 44
Not always 72 56 35 42
No 37 29 12 14
Does TB affect family responsibilities?
Yes 58 45 41 49
Not always 53 41 35 42
No 18 14 7 8
Will you want to live isolated due to having TB?*
Yes 5 4 12 14
Not always 43 33 25 30
No 81 63 46 55
How do you feel about the person with TB?
Desire to help 94 73 59 71
Want to stay away 28 22 20 24
No particular feeling 7 5 4 5
Is TB treatment very costly?*
8
Yes 32 25 42 51
Not always 44 34 21 25
No 53 41 20 24
Do you think that HIV positive people should concern about TB?*
Yes 23 18 39 47
Not always 79 61 30 36
No 27 21 14 17
Do you think that TB is hereditary
Yes 30 23 24 29
No 79 61 47 57
Don't know 20 16 12 14
*Significant difference between the cases and the controls (ρ < 0.05, χ² test).