Characteristic feature in large-scale lower tropospheric structure over the traverse route on the East Antarctic ice sheet in the winter based upon a series of radiosonde observation in 2018
Naohiko Hirasawa1, and Kyohei Yamada1,2
1 National Institute of Polar Research
2Nagano prefecture Environment Research Center
Suface-based temperature inversion layer (hereinafter simply “inversion layer”) developed on the Antarctic ice sheet is a typical feature that represents the Antarctic climate and tropospheric atmospheric circulation along with the katabatic wind.
Phillpot and Zillman [1970] estimated the distribution of the inversion intensity on the ice sheet as an average field from June to August based on the limited observation data. Since then, there have been few new collective observations that can update their figure, so their result is still cited as observation that represent the characteristics of the inversion layer on the Antarctic ice sheet in winter. This situation will continue for some time, but continuing to collect observational data that can be compared to their result is necessary to increase knowledge of the atmospheric circulation over the Antarctic ice sheet.
On the other hand, the accuracy of numerical models has improved remarkably, Antarctic Meso-scale Prediction System (AMPS) using the Weather Research and Forecasting Model (WRF) has been carried out, and it has also been used for meteorological mechanism analysis and climate analysis. We have also used WRF to study the dynamical mechanism of strong winds in January 2015 (Yamada and Hirasawa 2018) and the distribution of snowfall on the Antarctic ice sheet (Hirasawa and Yamada 2019). For such a numerical model, validation regarding the reproducibility of the inversion layer on the Antarctic ice sheet is one of the points of interest.
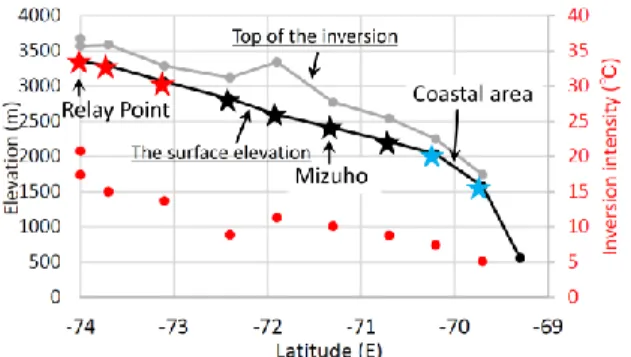
In October 2018, we continued sonde observation during a traverse from Relay Point to Syowa Station. In this presentation, we describe the characteristics of the cross-sectional structure of the inversion layer along the traverse route (Fig.1), and compare the results with the characteristics of the inversion layer calculated by the numerical model, although which is another case. The observed inversion layer has the intensities of 20-15 °C near Relay Point on the highland with relatively gentle slope, about 10 °C around Mizuho Station on the middle of the continental slope, and 5 °C on the coastal ice sheet. Looking at the thickness of the inversion layer, it is the thickest on the middle of the continental slope and thin on the highlands and on the coastal ice sheet. Figure 2 shows the vertical profile of average wind speed in each region of the three. The wind speed is the strongest on the middle of the slope, and the height at which the maximum appears is the highest. The surface-based layer with large vertical wind shear can create the isothermal layer in the lower part ot the inversion layer because it induces vertical mixing of the atmosphere. These results are consistent with the characteristics of the inversion layer calculated by the numerical model. If such a structure is generally created on the ice sheet, it implies that there is a continent-scale atmospheric circulation structure involving the boundary layer characterized by the inversion layer and the lower troposphere above it. It can also affect the transport of heat, moisture, and aerosols and is worth further research in the future.
References
Phillpot, H.R. and Zillman, J.W. (1970), The surface temperature inversion over the Antarctic continent, J. Geophys. Res., 75, 4161-4169..
Yamada, K., N. Hirasawa (2018), Analysis of a record breaking strong wind event at Syowa Station in January 2015, J. Geophys. Res., Atmosphere, JGRD55093, DOI: 10.1029/2018JD02887
Hirasawa, N., and K. Yamada (2019), Discussion on Antarctic accumulation with simulated snowfall distribution associated with a strong synoptic-scale disturbance, IUGG/IACS/C-7, Montreal, Canada, 9-13 July 2019.
Figure 1. Cross-sectional structure of the inversion layer along the traverse route from Relay Point to the coastal area base upon radiosonde observation in October 2018. Gray line indicates the altitude of the top of the inversion. Red dot indicates inversion intensity at each point.
Figure 2. Vertical profile of average wind speed in each region of the three.