http://dx.doi.org/10.4236/wjcd.2015.512042
How to cite this paper: Tokunaga, M., et al. (2015) Association between the Consumption of Carbonated Beverages and Out-of-Hospital Cardiac Arrests of Cardiac Origin in Japan. World Journal of Cardiovascular Diseases, 5, 361-372.
http://dx.doi.org/10.4236/wjcd.2015.512042
Association between the Consumption of Carbonated Beverages and Out-of-Hospital Cardiac Arrests of Cardiac Origin in Japan
Masaki Tokunaga1*, Yasunori Suematsu1*, Shin-ichiro Miura1,2#, Takashi Kuwano1, Atsushi Iwata1,2, Hiroaki Nishikawa1, Bo Zhang2,3, Naohiro Yonemoto4, Hiroshi Nonogi5, Ken Nagao6, Takeshi Kimura7, Keijiro Saku1,2#
1Department of Cardiology, Fukuoka University School of Medicine, Fukuoka, Japan
2The AIG Collaborative Research Institute of Cardiovascular Medicine, Fukuoka University, Fukuoka, Japan
3Department of Biochemistry, Fukuoka University School of Medicine, Fukuoka, Japan
4Department of Epidemiology and Biostatistics, National Center of Neurology and Psychiatry, Tokyo, Japan
5Hospital Deputy, Shizuoka General Hospital, Shizuoka, Japan
6Department of Cardiology, Resuscitation and Emergency Cardiovascular Care, Surugadai Nihon University Hospital, Nihon University School of Medicine, Tokyo, Japan
7Department of Cardiovascular Medicine, Graduate School of Medicine, Kyoto University, Kyoto, Japan
Received 29 May 2015; accepted 22 December 2015; published 25 December 2015 Copyright © 2015 by authors and Scientific Research Publishing Inc.
This work is licensed under the Creative Commons Attribution International License (CC BY).
http://creativecommons.org/licenses/by/4.0/
Abstract
Background: The consumption of carbonated beverages has been shown to increase the risk of developing metabolic syndrome. The associations between the consumption of carbonated beve- rages and left arterial dimension or left ventricular mass are believed to be likely related to the greater body weight of carbonated beverage drinkers relative to non-drinkers. Nonetheless, little is known about the association between the consumption of carbonated beverages and out-of- hospital cardiac arrests (OHCAs) in Japan. Methods: We compared the age-adjusted incidence of OHCAs to the expenditures on various beverages per person between 2005 and 2011 in the 47 prefectures of Japan. Patients who suffered from OHCAs of cardiac and non-cardiac origin were enrolled in All-Japan Utstein Registry of the Fire and Disaster Management Agency. The expendi- tures on various beverages per person in the 47 prefectures in Japan were obtained from data published by the Ministry of Health, Labour and Welfare of Japan. Results: There were 797,422 cases of OHCA in the All-Japan Utstein registry between 2005 and 2011, including 11,831 cases who did not receive resuscitation. Among these 785,591 cases of OHCA, 435,064 (55.4%) were classified as cardiac origin and 350,527 (44.6%) were non-cardiac origin. Non-cardiac origin in-
*The first two authors contributed equally to this work (M.T. and Y.S.).
#Corresponding author.
cluded cerebrovascular disease, respiratory disease, malignant tumor, and exogenous disease (4.8%, 6.1%, 3.5%, and 18.9%, respectively). The expenditures on carbonated beverages were significantly associated with OHCAs of cardiac origin (r = 0.30, p = 0.04), but not non-cardiac origin (r = −0.03, p = 0.8). Expenditures on other beverages, including green tea, tea, coffee, cocoa, fruit or vegetable juice, fermented milk beverage, milk beverage, and mineral water, were not signifi- cantly associated with OHCAs of cardiac origin. Conclusion: Carbonated beverage consumption was significantly and positively associated with OHCAs of cardiac origin in Japan, indicating that beverage habits might play a role in OHCAs of cardiac origin.
Keywords
Out-of-Hospital Cardiac Arrest, Utstein Registry, Carbonated Beverage, Ecological Study
1. Introduction
Several reports have shown that the consumption of soft drinks has been increasing worldwide [1] [2]. The con- sumption of large quantities of soft drinks has been shown to not only lead to hypertension and diabetes, but also to promote atherosclerosis [3]-[8]. Furthermore, these drinks contain large amounts of advanced glycation end- products which accelerate the progression of atherosclerosis [9]. Some epidemiologic studies have shown a pos- itive correlation between the consumption of these drinks and the incidence of cardiovascular disease (CVD) and stroke [10]-[12], while other reports have demonstrated that the intake of green tea and coffee reduces the risk and mortality of CVD in Japan [13]-[15]. Carbonated beverages, or sodas, have frequently been demon- strated to increase the risk of metabolic syndrome and CVD, such as subclinical cardiac remodeling and stroke [16] [17].
The Fire and Disaster Management Agency of Japan launched a prospective, nationwide, population-based, cohort study in subjects who had an OHCA to evaluate the effect of the nationwide dissemination of pub- lic-access Automated External Defibrillators (AEDs) on the rate of survival among patients who had an OHCA, and the Japanese Circulation Society (JCS) Resuscitation Science Study (JCS-ReSS) Group had a suitable data- base in January 2005 [18]. These data showed that in Japan, over 100,000 people experienced OHCA annually, and their survival rate within the first month thereafter was only 5%. Thus, OHCA is still a major public health problem in Japan. As for OHCA of cardiac origin, several studies have demonstrated that some factors (e.g., seafood consumption) reduce the risk of OHCA of cardiac origin [19]. However, the association between the consumption of large amounts of carbonated beverages and fatal CVD, or out-of-hospital cardiac arrests (OHCA) of cardiac origin, is not clear.
In the present study, we used an ecological method, which referred to a geographical and temporal study of risk-modifying factors on health outcomes based on populations. We hypothesized that the consumption of large amounts of carbonated beverages might be related to the incidence of OHCA of cardiac origin. Therefore, we considered that the kinds of soft drinks, especially carbonated beverages, consumed in each prefecture, in addi- tion to the total consumption of soft drinks per se in each prefecture, would be associated with OHCA of cardiac origin. We looked for associations between the average consumption of different kinds of soft drinks and the average incidence of OHCA between 2005 and 2011 in the 47 prefectures of Japan.
2. Methods 2.1. Subjects
Patients who suffered from OHCA of cardiac or non-cardiac origin (n = 435,064 and 350,527, respectively) and who were enrolled in the All-Japan Utstein Registry of the Fire and Disaster Management Agency between 2005 and 2011 were included in this analysis. Cardiac arrest was considered the cessation of cardiac mechanical ac- tivity, and was confirmed by the absence of a detectable pulse, unresponsiveness, and apnea. It included all pa- tients who had an out-of-hospital cardiac arrest before the arrival of emergency medical services (EMS) person- nel, were treated by EMS personnel, and were then transported to medical institutions. This reporting system has
been implemented in all of the fire stations in Japan and includes all cases of OHCA. The data were registered by the Fire and Disaster Management Agency (FDMA) of Japan and changed to a suitable database by the Jap- anese Circulation Society Resuscitation Science Study (JCS-ReSS) Group. Whether the arrest was of cardiac or non-cardiac origin was determined clinically by the physician in charge, in collaboration with the EMS person- nel, and was confirmed by a staff member at the FDMA. Patients were followed-up at 1 month, and 1 month survival, Cerebral Performance Category (CPC) score, and Overall Performance Category (OPC) score were checked by the EMS personnel and physicians. CPC scores are used to describe “good (1-2)” and “poor (3-4)”
outcomes. The 1 is conscious and alert with normal function or only slight disability, the 2 is conscious and alert with moderate disability, the 3 is conscious with severe disability, the 4 is comatose or persistent vegetative state, and the 5 is brain dead or death from other causes. OPC scores are used to describe “good (1-2)” and “poor (3-4)”
outcomes. The 1 is healthy, alert, capable of normal life, the 2 is moderate overall disability, the 3 is severe overall disability, the 4 is coma or vegetative state, and the 5 is death, certified brain dead or dead by traditional criteria. Data regarding the expenditures on beverages in the 47 municipalities were obtained from the Family Income and Expenditure Survey published by the Ministry of Internal Affairs and Communications of Japan [20]. The populations in the 47 prefectures of Japan were obtained from the Annual Report on Current Popula- tion Estimates (2005-2011) published by the Ministry of Internal Affairs and Communications of Japan [21].
The study protocol for analyses was approved by the Ethics Committee of Fukuoka University (FU-#00000403), Japan.
2.2. Age-Adjusted Incidence of OHCA
Using the Utstein Registry, we calculated the crude incidence of OHCA by determining the raw number of cases of OHCA by prefecture and then dividing these numbers by the population of the prefecture from 2005 to 2011 [21]. The Japanese Model Population in 1985 was used as a standard population, and age-standardization was performed by a direct method. We used a popular method to adjust for age. The Japanese Model Population in 1985 is a standard population (Supplementary Table 1), similar to the World Standard Population reported by Doll and Segi. First, we calculated the age-specific incidence for five-year age groups per person-year by divid- ing the number of OHCA cases in each age group by the population in each age group in the 47 prefectures.
Second, age-standardized incidences were calculated to allow comparison with the Japanese Model Population in 1985, with age-standardization conducted by a direct method. Age-adjusted incidence was calculated as Σ (the incidence of OHCA in the five-year age group x the size of the standard population in the five-year age group)/total standard population. Finally, we determined the average yearly age-adjusted incidence of OHCA by prefecture from 2005 to 2011.
2.3. Expenditures on Beverages
Data regarding the expenditures on beverages in the 47 municipalities were obtained from the Family Income and Expenditure Survey published by the Ministry of Internal Affairs and Communications of Japan [20]. The survey unit was the household throughout the entire area of Japan. Data were obtained with four different questionnaires: Household Schedule, Family Account Book, Yearly Income Schedule and Savings Schedule.
Enumerators filled in the Household Schedule with the number of household members, occupation and indus- try of earners, type of dwelling, etc. We considered 9 kinds of beverages: carbonated beverages, green tea, tea, coffee, cocoa, juice, fermented milk beverage, milk, and mineral water. Yearly average expenditures per household by prefectural capital city were obtained from this Survey. We calculated the expenditures on these drinks per person by dividing by the number of household members, and determined the averages from 2005 to 2011.
2.4. Statistical Analysis
The statistical analysis was performed using SAS software, version 9.4 (SAS Institute, Cary, NC, USA) at Fu- kuoka University. We used a t-test for continuous variables and chi-squared tests for categorical variables. The Spearman Rank Correlation Coefficient was used to evaluate associations between groups. The values are ex- pressed as the mean ± standard deviation (SD). Statistical significance was defined as a p-value of less than 0.05.
3. Results
3.1. Patient Characteristics in the All-Japan Utstein Registry
There were 797,422 cases of OHCA in the All-Japan Utstein registry between 2005 and 2011, including 11,831 cases who did not receive resuscitation. Table 1 shows the patient characteristics in the All-Japan Utstein Regi- stry between 2005 and 2011, excluding the 11,831 in the no-resuscitation group: 785,591 cases of OHCA:
435,064 (55.4%) of cardiac origin and 350,527 (44.6%) of non-cardiac origin. Non-cardiac origin included ce- rebrovascular disease, respiratory disease, malignant tumor, and exogenous disease (4.8%, 6.1%, 3.5%, and 18.9%, respectively). Patients with OHCA of cardiac origin were significantly older, and had a lower incidence of male and a higher incidence of 1-month survival, cerebral performance category 1 or 2, and overall perfor- mance category 1 or 2 compared to OHCA of non-cardiac origin. The initial rhythms in OHCA of cardiac origin were significantly more likely to be ventricular fibrillation and pulseless ventricular tachycardia, and less likely to be pulseless electrical activity and asystole. We showed the data aggregated by prefecture (Supplementary Table 2).
3.2. Time Trends for the Incidence of OHCA and Expenditures on Carbonated Beverages Figure 1 shows the yearly changes in the expenditures on carbonated beverages and the crude incidence of OHCA (total, cardiac and non-cardiac origin) in the 47 prefectures of Japan from 2005 to 2011. We performed a Spearman rank correlation coefficient analysis on the yearly increase in expenditures on carbonated beverages and the crude incidence of total OHCA, OHCA of cardiac origin, and OHCA of non-cardiac origin. The inci- dence of OHCA of both total and cardiac origin and the expenditures on carbonated beverages have been in- creasing yearly since 2005. We also investigated the associations between the yearly increase in the expendi- tures on carbonated beverages and the yearly increase in the crude incidence of total OHCA (p = 0.02), OHCA of cardiac origin (p = 0.005), and OHCA of non-cardiac origin (p = 0.3).
3.3. Incidence of OHCA of Cardiac and Non-Cardiac Origin and the Expenditures on Carbonated Beverages in the 47 Prefectures of Japan
Figure 2 shows the mean age-adjusted incidence of OHCA of cardiac and non-cardiac origin and the mean ex- penditures on carbonated beverages in the 47 prefectures of Japan between 2005 and 2011. Northern Japan might tend to show a high incidence of OHCA of cardiac origin and high expenditures on carbonated beverages.
There was no certification using statistical analysis.
Table 1. Patient characteristics.
Total (n = 785,591) Cardiac origin (n = 435,064) Non-cardiac origin (n = 350,527)
Age, years. 72 ± 18 75 ± 16* 69 ± 21
Male, n (%) 458,105 (58.3) 251,554 (57.8)* 206,551 (58.9)
ROSC, n (%) 52,955 (6.7) 29,214 (6.7) 23,741 (6.8)
1-month survival, n (%) 37,912 (4.8) 23,553 (5.4)* 14,359 (4.1)
CPC1 or 2, n (%) 17,410 (2.2) 13,230 (3.0)* 4180 (1.2)
OPC1 or 2, n (%) 17,223 (2.2) 13,109 (3.0)* 4114 (1.2)
Initial rhythm
VF 55,192 (7.0) 47,606 (10.9)* 7586 (2.2)
pulseless VT 1862 (0.2) 1219 (0.3)* 643 (0.2)
PEA 166,976 (21.3) 87,158 (20.0)* 79,818 (22.8)
Asystole 528,193 (67.2) 282,336 (64.9)* 245,857 (70.1)
ROSC: Return of spontaneous circulation; CPC: Cerebral performance category; OPC: Overall performance category; VF: Ventricular fibrillation;
VT: Ventricular tachycardia; PEA: Pulseless electrical activity. *p < 0.05 vs. non-cardiac origin.
Figure 1. Yearly changes in the expenditures on carbonated beverages and the incidence of OHCA in the 47 prefectures of Japan from 2005 to 2011. The green line (left vertical axis) indicates the annual expenditures on carbonated beverages per person in the 47 prefectures between 2005 and 2011. The orange, red, and blue lines (right vertical axis) indicate the annual crude incidence of OHCA in the 47 prefectures in all patients and in those of cardiac and non-cardiac origin between 2005
and 2011, respectively.
Figure 2. Mean age-adjusted incidence of OHCA of cardiac origin (red map in the left panel), non-cardiac origin (blue map in the middle panel), and expenditures on carbonated beverages (green map in the right panel) in the 47 prefectures of Japan be-
tween 2005 and 2011.
3.4. Correlations between the Nine Kinds of Beverage and the Incidence of OHCA of Cardiac and Non-Cardiac Origin in the 47 Prefectures
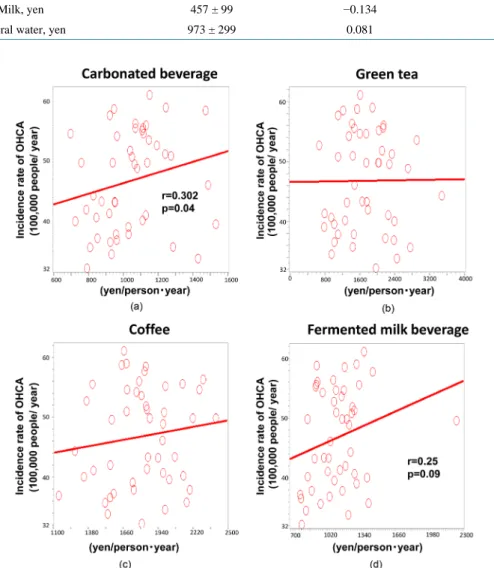
Table 2 shows the Spearman Rank Correlation Coefficients between the consumption of each type of beverage and the age-adjusted incidence of OHCA of cardiac origin. The expenditure on carbonated beverages was significantly associated with the age-adjusted incidence of OHCA of cardiac origin as also shown in Figure 3 (r = 0.302, p = 0.04), but not non-cardiac origin (r = −0.03, p = 0.8). On the other hand, the expenditures on other Table 2. Associations between the cost of kinds of drink and the age-adjusted incidence of out-of-hospital cardiac arrest of
cardiac origin.
Cost r p
Carbonated beverage, yen 1043 ± 198 0.302 0.04
Green tea, yen 1727 ± 617 0.010 0.94
Tea, yen 283 ± 89 0.145 0.33
Coffee, yen 1808 ± 290 0.088 0.55
Cocoa, yen 154 ± 24 0.192 0.20
Juice, yen 3359 ± 524 0.140 0.35
Fermented milk beverage, yen 1140 ± 243 0.253 0.09
Milk, yen 457 ± 99 −0.134 0.37
Mineral water, yen 973 ± 299 0.081 0.59
Figure 3. Correlations between the age-adjusted incidence of OHCA and the expenditures on different kinds of beverages in the
47 prefectures of Japan. Red lines and circles indicate the correlation to OHCA of cardiac origin.
beverages were not significantly associated with the age-adjusted incidence of OHCA of cardiac origin: green tea (r = −0.010, p = 0.94), tea (r = −0.145, p = 0.33), coffee (r = −0.088, p = 0.55), cocoa (r = −0.192, p = 0.20), juice (r = −0.140, p = 0.35), milk (r = −0.134, p = 0.37), and mineral water (r = −0.081, p = 0.59). The expendi- ture on fermented milk beverages tended to be positively associated with OHCAs of cardiac origin (r = 0.25, p = 0.09). The variability of the data was also shown in Supplementary Table 3.
4. Discussion
In the present study, the incidence of OHCA of cardiac origin increased, and the total number of OHCAs reached over 780,000 during the observation period in Japan. The consumption of carbonated beverages also in- creased from 2005 to 2011, and the population in northern Japan tended to consume more carbonated beverages.
Although we found a significant positive relation between the consumption of carbonated beverages and the age-adjusted incidence of OHCA of cardiac origin, similar associations were not seen for the consumption of green tea, tea, milk, fermented milk beverages, coffee, cocoa, juice or mineral water. Epidemiological data have shown unequivocally that an increased intake of soft drinks is associated with metabolic syndrome, CVD and stroke [10]-[12]. In our study, however, only the consumption of carbonated beverages was significantly and positively correlated with the incidence of OHCA of cardiac origin. As far as we know, this study is the first to demonstrate an association between the consumption of carbonated beverages and OHCA of cardiac origin.
Previous studies have demonstrated that the consumption of carbonated beverages and other soft drinks was positively associated with increases in blood sugar, insulin, triglyceride and low-density lipoprotein cholesterol, and these metabolic abnormalities promoted CVD [3]-[8] [10]-[12]. In our study, however, only carbonated be- verages, and not the other beverages, were positively correlated with the age-adjusted incidence of OHCA of cardiac origin. Thus, our results did not completely agree with the results of previous studies. Although it is still unclear why and how only the consumption of carbonated beverage was positively associated with the age-adjusted incidence of OHCA of cardiac origin, one possible explanation is that the acid contained in carbo- nated beverages might play an important role in this association. Some previous papers have shown that an in- creased risk of CVD was associated with the intake of not only soft drinks, but also diet drinks [22] [23]. In these studies, an increase in sugar intake was shown to be related to an increase in metabolic abnormalities and to promote CVD, while other factors might also play important roles in promoting CVD. In one report, carbo- nated drinks were associated with a reduced telomere length in leukocytes, which is related to the cell cycle and cell aging [24]. In addition, there was no association between non-carbonated soft drinks and telomere length.
This suggests that carbonated acid might promote atherosclerosis through its association with cell aging. There- fore, we thought that the acid in carbonated beverages might play an important role in promoting atherosclerosis, and lead to the increase in the age-adjusted incidence of OHCA of cardiac origin observed in our study.
According to previous reports, the consumption of green tea and coffee is significantly and negatively asso- ciated with the incidence of CVD [13]-[15]. In our study, green tea and coffee did not show a significant nega- tive correlation with the age-adjusted incidence of OHCA of cardiac origin. Thus, our results did not completely correspond with these previous reports. There are several possible explanations for this discrepancy. First, the consumption of these beverages was expressed in terms of money spent and this may not accurately reflect their actual consumption. Second, not all cases of OHCA of cardiac origin are caused by CVD based on atherosclero- sis. Since the OHCA database we used included all age groups in Japan, some cases may have been due to some other heart disease, such as arrhythmia or congenital heart disease, which are often observed in younger patients [25]. In addition, some papers have reported that fermented milk beverages had a positive impact on blood pressure [26]-[28]. Inconsistent with these findings, fermented milk beverages tended to increase the age-ad- justed incidence of OHCA of cardiac origin in our study. Further studies will be needed to clarify whether these drinks actually increase the risk and incidence of OHCA of cardiac origin.
5. Limitations
Since this was an ecological study and the baseline characteristics in these surveys are different, we need to con- sider an ecological fallacy, and thus the results may not be completely accurate. In addition, an ecological study is an epidemiologic analysis in which the units of analysis are populations or groups of people rather than indi- viduals. The results of this group study are suggestive, and are insufficient to prove any associations. Further in- dividual studies will be needed to check these results. The data on the average consumption of various beverages
in the 47 prefectures of Japan only included information for the respective prefectural capitals. However, this information should reflect the characteristics of the prefectures. Furthermore, the results were estimated from data on consumer spending rather than from a dietary questionnaire. Family Income and Expenditure Survey does not provide a detailed classification of carbonated beverages. Other confounding factors, such as the cli- mate or lifestyle in the 47 prefectures, should also be considered.
6. Conclusion
In Japan, the consumption of carbonated beverages may be associated with the risk of OHCA of cardiac origin, although further individual studies will be needed to confirm this association.
Acknowledgements
We acknowledge the Japanese Circulation Society Resuscitation Science Study (JCS-ReSS) Group for the offer of Utstein data.
Funding
KS has an Endowed Department of “Advanced Therapeutics for Cardiovascular Disease” supported by Boston Scientific Japan Co. Ltd., Japan Medtronic Co. Ltd., Japan Lifeline Co. Ltd., Nihon Kohden Co. Ltd., and St.
Jude Medical Japan Co. Ltd. (these 5 companies sell products related to OHCA: AED etc.), and the Department of Community and Emergency Medicine (supported by Izumi General Medical Center), which is related to Emergency Medicine Support by Fukuoka Prefecture. KS and MS are Directors of the Nonprofit Organization Clinical and Applied Science, Fukuoka, Japan.
Conflict of Interest
None declared.
References
[1] Nielsen, S.J. and Popkin, B.M. (2004) Changes in Beverage Intake between 1977 and 2001. American Journal of Pre- ventive Medicine, 27, 205-210. http://dx.doi.org/10.1016/j.amepre.2004.05.005
[2] Vereecken, C.A., Inchley, J., Subramanian, S.V., Hublet, A. and Maes, L. (2005) The Relative Influence of Individual and Contextual Socio-Economic Status on Consumption of Fruit and Soft Drinks among Adolescents in Europe. The European Journal of Public Health 15, 224-232. http://dx.doi.org/10.1093/eurpub/cki005
[3] Malik, V.S., Schulze, M.B. and Hu, F.B. (2006) Intake of Sugar-Sweetened Beverages and Weight Gain: A Systematic Review. The American Journal of Clinical Nutrition, 84, 274-288.
[4] Schulze, M.B., Manson, J.E., Ludwig, D.S., Colditz, G.A., Stampfer, M.J., Willett, W.C. and Hu, F.B. (2004) Sug- ar-Sweetened Beverages, Weight Gain, and Incidence of Type 2 Diabetes in Young and Middle-Aged Women. JAMA, 292, 927-934. http://dx.doi.org/10.1001/jama.292.8.927
[5] James, J., Thomas, P., Cavan, D. and Kerr, D. (2004) Preventing Childhood Obesity by Reducing Consumption of Carbonated Drinks: Cluster Randomised Controlled Trial. BMJ, 328, 1237.
http://dx.doi.org/10.1136/bmj.38077.458438.EE
[6] Parks, E.J. and Hellerstein, M.K. (2000) Carbohydrate-Induced Hypertriacylglycerolemia: Historical Perspective and Review of Biological Mechanisms. The American Journal of Clinical Nutrition, 71, 412-433.
[7] Nseir, W., Nassar, F. and Assy, N. (2010) Soft Drinks Consumption and Nonalcoholic Fatty Liver Disease. World Journal of Gastroenterology, 16, 2579-2588. http://dx.doi.org/10.3748/wjg.v16.i21.2579
[8] Aronson, D. and Rayfield, E.J. (2002) How Hyperglycemia Promotes Atherosclerosis: Molecular Mechanisms. Cardi- ovascular Diabetology, 1, 1.
[9] Takeuchi, M., Takino, J., Furuno, S., Shirai, H., Kawakami, M., Muramatsu, M., Kobayashi, Y. and Yamagishi, S.
(2015) Assessment of the Concentrations of Various Advanced Glycation End-Products in Beverages and Foods that Are Commonly Consumed in Japan. PLoS ONE, 10, e0118652. http://dx.doi.org/10.1371/journal.pone.0118652 [10] Eshak, E.S., Iso, H., Kokubo, Y., Saito, I., Yamagishi, K., Inoue, M. and Tsugane, S. (2012) Soft Drink Intake in Rela-
tion to Incident Ischemic Heart Disease, Stroke, and Stroke Subtypes in Japanese Men and Women: The Japan Public
Health Centre-Based Study Cohort I. The American Journal of Clinical Nutrition, 96, 1390-1397.
http://dx.doi.org/10.3945/ajcn.112.037903
[11] Dhingra, R., Sullivan, L., Jacques, P.F., Wang, T.J., Fox, C.S., Meigs, J.B., D’Agostino, R.B., Gaziano, J.M. and Va- san, R.S. (2007) Soft Drink Consumption and Risk of Developing Cardiometabolic Risk Factors and the Metabolic Syndrome in Middle-Aged Adults in the Community. Circulation, 116, 480-488.
http://dx.doi.org/10.1161/CIRCULATIONAHA.107.689935
[12] Fung, T.T., Malik, V., Rexrode, K.M., Manson, J.E., Willett, W.C. and Hu, F.B. (2009) Sweetened Beverage Con- sumption and Risk of Coronary Heart Disease in Women. American Journal of Clinical Nutrition, 89, 1037-1042.
http://dx.doi.org/10.3945/ajcn.2008.27140
[13] Saito, E., Inoue, M., Sawada, N., Shimazu, T., Yamaji, T., Iwasaki, M., Sasazuki, S., Noda, M., Iso, H. and Tsugane, S., JPHC Study Group (2015) Association of Green Tea Consumption with Mortality Due to All Causes and Major Causes of Death in a Japanese Population: The Japan Public Health Center-Based Prospective Study (JPHC Study). Annals of Epidemiology, 25, 512-518.e3. http://dx.doi.org/10.1016/j.annepidem.2015.03.007
[14] Kokubo, Y., Iso, H., Saito, I., Yamagishi, K., Yatsuya, H., Ishihara, J., Inoue, M. and Tsugane, S. (2013) The Impact of Green Tea and Coffee Consumption on the Reduced Risk of Stroke Incidence in Japanese Population: The Japan Pub- lic Health Center-Based Study Cohort. Stroke, 44, 1369-1374. http://dx.doi.org/10.1161/STROKEAHA.111.677500 [15] Saito, E., Inoue, M., Sawada, N., Shimazu, T., Yamaji, T., Iwasaki, M., Sasazuki, S., Noda, M., Iso, H. and Tsugane, S.
(2015) Association of Coffee Intake with Total and Cause-Specific Mortality in a Japanese Population: The Japan Pub- lic Health Center-Based Prospective Study. American Journal of Clinical Nutrition, 101, 1029-1037.
http://dx.doi.org/10.3945/ajcn.114.104273
[16] Andersson, C., Sullivan, L., Benjamin, E.J., Aragam, J., Jacques, P., Cheng, S. and Vasan, R.S. (2015) Association of Soda Consumption with Subclinical Cardiac Remodeling in the Framingham Heart Study. Metabolism, 64, 208-212.
http://dx.doi.org/10.1016/j.metabol.2014.10.009
[17] Bernstein, A.M., de Koning, L., Flint, A.J., Rexrode, K.M. and Willett, W.C. (2012) Soda Consumption and the Risk of Stroke in Men and Women. American Journal of Clinical Nutrition, 95, 1190-1199.
http://dx.doi.org/10.3945/ajcn.111.030205
[18] Iwami, T., Kitamura, T., Kawamura, T., Mitamura, H., Nagao, K., Takayama, M., Seino, Y., Tanaka, H., Nonogi, H., Yonemoto, N. and Kimura, T., Japanese Circulation Society Resuscitation Science Study (JCS-ReSS) Group (2012) Chest Compression-Only Cardiopulmonary Resuscitation for Out-of-Hospital Cardiac Arrest with Public-Access Defi- brillation: A Nationwide Cohort Study. Circulation, 126, 2844-2851.
http://dx.doi.org/10.1161/CIRCULATIONAHA.112.109504
[19] Suematsu, Y., Miura, S., Zhang, B., Uehara, Y., Tokunaga, M., Yonemoto, N., Nonogi, H., Nagao, K., Kumura, T., Saku, K., on Behalf of the Japanese Circulation Society Resuscitation Science Study (JCS-ReSS) Group (2014) Asso- ciations between the Consumption of Different Kinds of Seafood and Out-of-Hospital Cardiac Arrests of Cardiac Ori- gin in Japan. IJC Heart & Vessels, 2, 8-14. http://dx.doi.org/10.1016/j.ijchv.2013.11.002
[20] Ministry of Internal Affairs and Communications (2013) http://www.stat.go.jp/english/data/kakei/index.htm.
[21] Ministry of Internal Affairs and Communications (2014) http://www.stat.go.jp/english/data/jinsui/index.htm.
[22] Nettleton, J.A., Lutsey, P.L., Wang, Y., Lima, J.A., Michos, E.D. and Jacobs Jr., D.R. (2009) Diet Soda Intake and Risk of Incident Metabolic Syndrome and Type 2 Diabetes in the Multi-Ethnic Study of Atherosclerosis (MESA). Di- abetes Care, 32, 688-694. http://dx.doi.org/10.2337/dc08-1799
[23] Gardener, H., Rundek, T., Markert, M., Wright, C.B., Elkind, M.S. and Sacco, R.L. (2012) Diet Soft Drink Consump- tion Is Associated with an Increased Risk of Vascular Events in the Northern Manhattan Study.Journal of General In- ternal Medicine, 27, 1120-1126. http://dx.doi.org/10.1007/s11606-011-1968-2
[24] Leung, C.W., Laraia, B.A., Needham, B.L., Rehkopf, D.H., Adler, N.E., Lin, J., Blackburn, E.H. and Epel, E.S. (2014) Soda and Cell Aging: Associations between Sugar-Sweetened Beverage Consumption and Leukocyte Telomere Length in Healthy Adults from the National Health and Nutrition Examination Surveys. American Journal of Public Health, 104, 2425-2431. http://dx.doi.org/10.2105/AJPH.2014.302151
[25] Semsarian, C., Ingles, J. and Wilde, A.A. (2015) Sudden Cardiac Death in the Young: The Molecular Autopsy and a Practical Approach to Surviving Relatives. European Heart Journal, 36, 1290-1296.
http://dx.doi.org/10.1093/eurheartj/ehv063
[26] Soedamah-Muthu, S.S., Verberne, L.D., Ding, E.L., Engberink, M.F. and Geleijnse, J.M. (2012) Dairy Consumption and Incidence of Hypertension: A Dose-Response Meta-Analysis of Prospective Cohort Studies. Hypertension, 60, 1131-1137. http://dx.doi.org/10.1161/HYPERTENSIONAHA.112.195206
[27] Dalmeijer, G.W., Struijk, E.A., van der Schouw, Y.T., Soedamah-Muthu, S.S., Verschuren, W.M., Boer, J.M., Ge-
leijnse, J.M. and Beulens, J.W. (2013) Dairy Intake and Coronary Heart Disease or Stroke—A Population-Based Co- hort Study. International Journal of Cardiology, 167, 925-929. http://dx.doi.org/10.1016/j.ijcard.2012.03.094
[28] Jauhiainen, T., Rönnback, M., Vapaatalo, H., Wuolle, K., Kautiainen, H., Groop, P.H. and Korpela, R. (2010) Long- Term Intervention with Lactobacillus helveticus Fermented Milk Reduces Augmentation Index in Hypertensive Sub- jects. European Journal of Clinical Nutrition, 64, 424-431. http://dx.doi.org/10.1038/ejcn.2010.3
Supplementary
Table 1. The Japanese model population in 1985.
age group standard population
age number
0 - 4 8,180,000
5 - 9 8,338,000
10 - 14 8,497,000
15 - 19 8,655,000
20 - 24 8,814,000
25 - 29 8,972,000
30 - 34 9,130,000
35 - 39 9,289,000
40 - 44 9,400,000
45 - 49 8,651,000
50 - 54 7,616,000
55 - 59 6,581,000
60 - 64 5,546,000
65 - 69 4,511,000
70 - 74 3,476,000
75 - 79 2,441,000
80 - 84 1,406,000
85 - 784,000
total 120,287,000
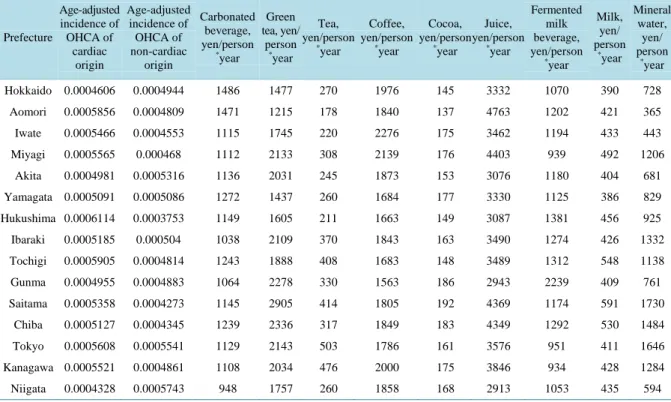
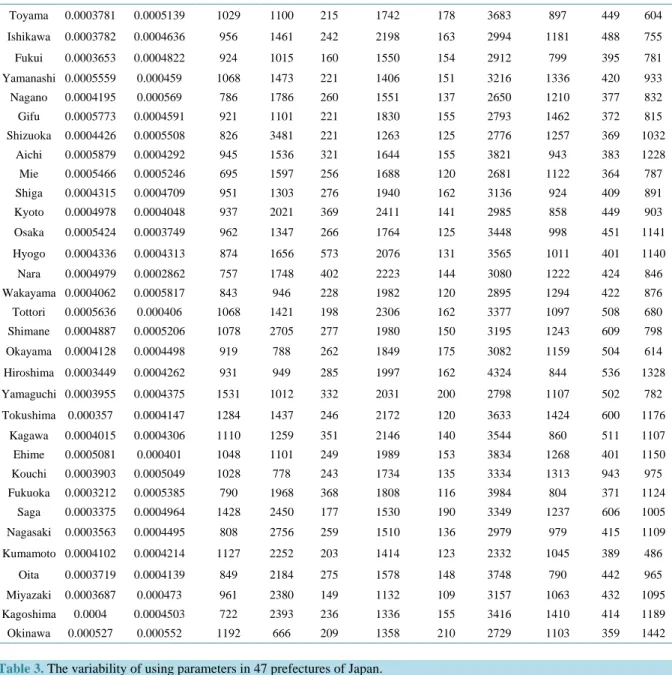
Table 2. The using parameters in 47 prefectures of Japan.
Prefecture
Age-adjusted incidence of OHCA of
cardiac origin
Age-adjusted incidence of OHCA of non-cardiac
origin
Carbonated beverage, yen/person
*year
Green tea, yen/
person
*year Tea, yen/person
*year
Coffee, yen/person
*year
Cocoa, yen/person
*year
Juice, yen/person
*year
Fermented milk beverage, yen/person
*year
Milk, yen/
person
*year Mineral
water, yen/
person
*year
Hokkaido 0.0004606 0.0004944 1486 1477 270 1976 145 3332 1070 390 728
Aomori 0.0005856 0.0004809 1471 1215 178 1840 137 4763 1202 421 365
Iwate 0.0005466 0.0004553 1115 1745 220 2276 175 3462 1194 433 443
Miyagi 0.0005565 0.000468 1112 2133 308 2139 176 4403 939 492 1206
Akita 0.0004981 0.0005316 1136 2031 245 1873 153 3076 1180 404 681
Yamagata 0.0005091 0.0005086 1272 1437 260 1684 177 3330 1125 386 829
Hukushima 0.0006114 0.0003753 1149 1605 211 1663 149 3087 1381 456 925
Ibaraki 0.0005185 0.000504 1038 2109 370 1843 163 3490 1274 426 1332
Tochigi 0.0005905 0.0004814 1243 1888 408 1683 148 3489 1312 548 1138
Gunma 0.0004955 0.0004883 1064 2278 330 1563 186 2943 2239 409 761
Saitama 0.0005358 0.0004273 1145 2905 414 1805 192 4369 1174 591 1730
Chiba 0.0005127 0.0004345 1239 2336 317 1849 183 4349 1292 530 1484
Tokyo 0.0005608 0.0005541 1129 2143 503 1786 161 3576 951 411 1646
Kanagawa 0.0005521 0.0004861 1108 2034 476 2000 175 3846 934 428 1284
Niigata 0.0004328 0.0005743 948 1757 260 1858 168 2913 1053 435 594
Continued
Toyama 0.0003781 0.0005139 1029 1100 215 1742 178 3683 897 449 604
Ishikawa 0.0003782 0.0004636 956 1461 242 2198 163 2994 1181 488 755
Fukui 0.0003653 0.0004822 924 1015 160 1550 154 2912 799 395 781
Yamanashi 0.0005559 0.000459 1068 1473 221 1406 151 3216 1336 420 933
Nagano 0.0004195 0.000569 786 1786 260 1551 137 2650 1210 377 832
Gifu 0.0005773 0.0004591 921 1101 221 1830 155 2793 1462 372 815
Shizuoka 0.0004426 0.0005508 826 3481 221 1263 125 2776 1257 369 1032
Aichi 0.0005879 0.0004292 945 1536 321 1644 155 3821 943 383 1228
Mie 0.0005466 0.0005246 695 1597 256 1688 120 2681 1122 364 787
Shiga 0.0004315 0.0004709 951 1303 276 1940 162 3136 924 409 891
Kyoto 0.0004978 0.0004048 937 2021 369 2411 141 2985 858 449 903
Osaka 0.0005424 0.0003749 962 1347 266 1764 125 3448 998 451 1141
Hyogo 0.0004336 0.0004313 874 1656 573 2076 131 3565 1011 401 1140
Nara 0.0004979 0.0002862 757 1748 402 2223 144 3080 1222 424 846
Wakayama 0.0004062 0.0005817 843 946 228 1982 120 2895 1294 422 876
Tottori 0.0005636 0.000406 1068 1421 198 2306 162 3377 1097 508 680
Shimane 0.0004887 0.0005206 1078 2705 277 1980 150 3195 1243 609 798
Okayama 0.0004128 0.0004498 919 788 262 1849 175 3082 1159 504 614
Hiroshima 0.0003449 0.0004262 931 949 285 1997 162 4324 844 536 1328
Yamaguchi 0.0003955 0.0004375 1531 1012 332 2031 200 2798 1107 502 782
Tokushima 0.000357 0.0004147 1284 1437 246 2172 120 3633 1424 600 1176
Kagawa 0.0004015 0.0004306 1110 1259 351 2146 140 3544 860 511 1107
Ehime 0.0005081 0.000401 1048 1101 249 1989 153 3834 1268 401 1150
Kouchi 0.0003903 0.0005049 1028 778 243 1734 135 3334 1313 943 975
Fukuoka 0.0003212 0.0005385 790 1968 368 1808 116 3984 804 371 1124
Saga 0.0003375 0.0004964 1428 2450 177 1530 190 3349 1237 606 1005
Nagasaki 0.0003563 0.0004495 808 2756 259 1510 136 2979 979 415 1109
Kumamoto 0.0004102 0.0004214 1127 2252 203 1414 123 2332 1045 389 486
Oita 0.0003719 0.0004139 849 2184 275 1578 148 3748 790 442 965
Miyazaki 0.0003687 0.000473 961 2380 149 1132 109 3157 1063 432 1095
Kagoshima 0.0004 0.0004503 722 2393 236 1336 155 3416 1410 414 1189
Okinawa 0.000527 0.000552 1192 666 209 1358 210 2729 1103 359 1442
Table 3. The variability of using parameters in 47 prefectures of Japan.
Variability
Age-adjusted incidence of OHCA of
cardiac origin
Age-adjuste d incidence of OHCA of non-cardiac
origin
Carbonated beverage, yen/person
*year
Green tea, yen/person
*year
Tea, yen/person
*year
Coffee, yen/person
*year
Cocoa, yen/person
*year
Juice, yen/person
*year
Fermented milk beverage, yen/person
*year
Milk, yen/person
*year
Mineral water, yen/person
*year
Average 0.00046771 0.00046919 1042.62228 1726.8696 283.402047 1807.93605 153.851616 3359.11319 1139.99348 456.918416 973.087874 Median 0.00048865 0.00046801 1037.923 1655.61319 260.131206 1830.09361 153.025736 3332.24133 1124.66504 426.259499 932.648286 VAR.S 6.86E−09 3.51E−09 39228.3051 381154.072 7986.07641 84092.8392 553.336313 274215.509 59003.7174 9779.91365 89658.2569 VAR.P 6.71E−09 3.44E−09 38393.6603 373044.411 7816.15989 82303.6298 541.5632 268381.137 57748.3192 9571.83038 87750.6344 STDEVA 8.28E−05 5.92E−05 198.061367 617.376767 89.36485 289.987653 23.5231017 523.655907 242.906808 98.8934459 299.429886