Since 1992, the present author has examined correlations between cranial and postcranial measurements in order to clarify the causes of brachycephalization. Using principal component analysis and Kaiser’s normal varimax rotation methods, the author found that cranial length is strongly associated with the sagittal and trans- verse diameters of the vertebral bodies, sacral breadths, costal chords, many humeral measure- ments, pelvic breadths and heights, femoral lengths and thicknesses, and tibial lengths and thicknesses. Findings also showed that cranial breadth has no consistent association with any measurements of the vertebrae, ribs, sternum, scapula, clavicle, humerus, ulna, radius, pelvis, femur, patella, tibia, fibula or foot bones. In turn it showed that basi-bregmatic height is signifi- cantly associated with the transverse diameters of the vertebral foramina of almost all the vertebrae and with the size of the talus. The details of these results have already been published (Mizoguchi, 1992, 1994, 1995, 1996, 1997, 1998a, b, 1999,
on the pelvis have not been fully described, though briefly presented at an international sym- posium (Mizoguchi, 2003a). Therefore, the de- tailed results of the analyses on the pelvis are given here to complete this series of multivariate analyses.
Materials and Methods
The data used are the raw measurements of the neurocranium reported by Miyamoto (1924) and those of the pelvis reported by Miyamoto (1927) and Tabata (1930). These are of the same skele- tons of 30 male and 20 female modern Japanese who had lived in the Kinai district. The basic sta- tistics for three main neurocranial measurements, i.e., cranial length, cranial breadth and basi-breg- matic height, are presented in Mizoguchi (1994), and those for pelvic measurements are listed in Table 1.
For examining the overall relations between the neurocranial and pelvic measurements, prin-
Significant Associations between Cranial Length and Pelvic Measurements: Toward the Solution of
the Brachycephalization Problem
Yuji Mizoguchi
Department of Anthropology, National Science Museum 3–23–1 Hyakunincho, Shinjuku-ku, Tokyo, 169–0073 Japan
E-mail: [email protected]
Abstract As a step toward elucidating the causes of brachycephalization, correlations between neurocranial and pelvic measurements were examined using principal component analysis and Kaiser’s normal varimax rotation methods. The results show that, while cranial breadth has no sys- tematic relation with any pelvic measurements, cranial length is significantly associated with the height of the innominate, maximum pelvic breadth, and anterior upper spinal breadth in both sexes. These findings support the previous suggestion from the analyses of the sacrum that the form of the maternal pelvic inlet has been and is still one of the most important determinants for the neurocranial form, and suggest the possibility that one of the causes for brachycephalization may be a secular change in the shape of the pelvis.
Key words : Brachycephalization, Neurocranium, Pelvis, Principal component analysis, Boot- strap method
Table 1. Means and standard deviations for pelvic measurements in Japanese males and females.1)
Males Females
Variable2)
n Mean SD n Mean SD
K1 Physiological pelvic height 30 199.7 9.7 20 188.3 9.7
K2 Physiological pelvic depth 30 143.1 6.7 20 142.8 7.9
1 Height of innominate 29 206.3 9.8 20 189.9 9.7
K4 Height of innominate 30 190.7 9.6 20 174.9 9.0
2 Maximum pelvic breadth 30 258.8 13.8 20 251.9 14.4
3 Maximum pelvic depth 27 161.3 9.7 20 167.6 9.9
3(1) Lumbo-pubic depth 28 173.4 9.8 20 178.2 9.2
5 Anterior upper spinal breadth 30 224.0 13.6 20 218.6 15.2
5(1) Anterior lower spinal breadth 30 180.6 9.8 20 175.3 10.8
6 Posterior upper spinal breadth 30 70.3 9.3 19 77.5 7.3
7 Acetabular breadth 30 118.9 5.7 20 123.4 5.5
19 Inter-obturator breadth 30 45.6 3.9 20 51.9 5.4
23 Sagittal diameter of pelvic inlet 30 100.2 7.7 20 109.2 7.7
24 Transverse diameter of pelvic inlet 30 120.3 5.5 19 123.9 6.2
25 Oblique diameter of pelvic inlet 30 118.2 4.5 20 122.0 6.3
26(1) Sagittal diameter of pelvic outlet 30 108.0 7.4 20 115.8 10.3
8 Breadth between ischial spines 30 82.9 5.6 19 97.4 6.9
27 Transverse diameter of pelvic outlet 30 93.7 6.4 20 110.0 6.9
27a Transverse diameter of pelvic outlet 30 109.2 8.8 20 127.1 9.2
28 Side height of true pelvis 30 93.2 4.8 20 83.1 4.8
29 Anterior height of true pelvis 30 117.3 6.1 20 115.0 5.8
30 True height of true pelvis 30 128.5 7.1 20 123.7 8.3
18 Length of pubic symphysis 30 34.2 3.7 20 32.0 4.5
1 Anterior arc of sacrum 30 113.9 10.2 19 112.3 8.0
2 Anterior length of sacrum 30 101.2 11.3 19 100.4 9.2
5 Anterior superior breadth of sacrum 30 99.8 4.5 20 99.4 7.5
6 Maximum depth of anterior concavity of sacrum 30 20.4 6.0 19 19.1 3.9
7 Position of maximum depth from promontory 30 64.9 10.5 19 64.3 7.2
23(2) Inferior sagittal diameter of true pelvis 30 115.2 8.2 20 121.7 8.4 23(1) Normal sagittal diameter of true pelvis 30 122.9 11.6 20 130.8 10.9
9 Iliac height 30 126.1 5.8 20 119.0 5.7
10 Height of iliac blade 30 98.5 5.3 20 95.3 6.0
K28 Height of iliac blade 30 97.4 5.8 20 90.6 5.8
12 Iliac breadth 30 149.2 6.6 20 144.7 8.3
13 Breadth of iliac blade 30 89.0 5.1 20 89.3 5.7
4 Maximum breadth of innominate 29 167.2 11.6 20 169.6 8.7
17 Pubis length 30 82.7 4.4 20 84.4 5.3
15 Ischium length 30 83.6 4.7 20 75.7 4.4
11 Depth of iliac fossa 30 7.7 2.1 20 4.5 1.3
20 Length of obturator foramen 30 51.5 3.6 20 47.8 3.0
21 Breadth of obturator foramen 30 32.5 2.9 20 33.4 2.1
14 Acetabulo-symphysial breadth 30 113.7 4.8 20 112.2 6.2
22 Maximum diameter of acetabulum 30 54.0 2.4 20 50.4 2.7
31 Breadth of greater sciatic notch 30 54.4 6.6 19 62.5 3.2
32 Depth of greater sciatic notch 30 36.5 2.8 19 34.2 2.4
34(1) Divergence angle of iliac blade 30 87.8 7.4 20 84.6 9.5
34 Inclination angle of iliac blade 29 113.3 7.1 20 114.4 4.8
33 Subpubic angle 30 58.1 9.1 20 77.7 8.4
35 Inclination angle of pelvis 30 63.2 5.2 19 64.1 4.0
K44 Inclination angle of lumbo-pubic depth 28 54.4 3.6 20 57.0 4.4
36 Sacral inclination angle 30 43.1 10.2 20 44.9 10.4
W a-angle (angle between pubis and ilium axes) 28 171.3 4.9 18 169.2 5.6 W b-angle (angle between pubis and ischium axes) 28 84.2 3.1 18 81.6 4.3 W g-angle (angle between ilium and ischium axes) 28 104.5 4.2 18 109.2 6.0
1) The estimates of basic statistics listed here were recalculated by the present author on the basis of the raw data published by Miyamoto (1927) and Tabata (1930). When measurements are available for both sides, only those on the right side were used.
1963; Okuno et al., 1971, 1976; Takeuchi and Yanai, 1972) was applied to the correlation ma- trices on them. The number of principal compo- nents was determined so that the cumulative pro- portion of the variances of the principal compo- nents exceeded 80%. The principal components obtained in such a way were then transformed by Kaiser’s normal varimax rotation method (Asano, 1971; Okuno et al., 1971) into different factors because these may reveal some other associations hidden behind the measurements.
The measurements of the pelvis were, in prac- tice, arbitrarily divided into four groups to carry out the above multivariate analyses. This was necessary because of a statistical restriction on sample size given the number of variables.
The significance of factor loadings was tested by the bootstrap method (Efron, 1979a, b, 1982;
Diaconis and Efron, 1983; Mizoguchi, 1993). In order to estimate the bootstrap standard deviation of a factor loading, 1,000 bootstrap replications including the observed sample were used. The bootstrap standard deviation was estimated by di- rectly counting the cumulative frequency for the standard deviation in the bootstrap distribution.
The reality of a common factor such as those represented by a principal component or rotated factor was further tested, though indirectly, by evaluating similarity between the factors ob- tained for males and females, i.e., by estimating a Spearman’s rank correlation coefficient, rho (Siegel, 1956), between the variation patterns of the factor loadings.
Statistical calculations were executed with the mainframe, HITACHI MP5800 System, at the Computer Centre, University of Tokyo. The pro- grams used were BSFMD for calculating basic statistics, BTPCA for principal component analy- sis and Kaiser’s normal varimax rotation, and RKCNCT for rank correlation coefficients. All of these programs were written in FORTRAN by the present author.
Results
analyses (PCAs) and the rotated solutions for the neurocranium and the pelvis are shown in Tables 2 to 17. And the Spearman’s rank correlation co- efficients between males and females for the vari- ation pattern of factor loadings on the principal components (PCs) and/or rotated factors extract- ed are shown in Tables 18 to 21.
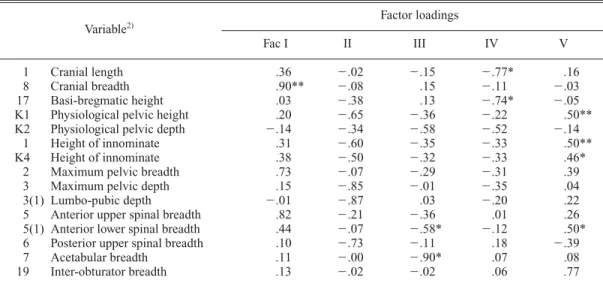
First of all, the PCAs and the rotated solutions for the pelvis show that cranial length is signifi- cantly associated with the height of the innomi- nate, maximum pelvic breadth, and anterior upper spinal breadth in both sexes. This can be confirmed by comparing the first PC extracted from the first data set of males (Table 2) with the first rotated factor from the first data set of fe- males (Table 5). These two factors from males and females are highly significantly correlated at the 0.1% level, as shown by the Spearman’s rank correlation coefficient of 0.82 (Table 18).
On the other hand, regarding cranial breadth and basi-bregmatic height, there is no such PC or rotated factor, common to males and females, as is significantly correlated with both the breadth or height and one or more pelvic measurements (Tables 2 to 17).
Discussion
In the present study, it was found that cranial length had significant associations with the height of the innominate, maximum pelvic breadth, and anterior upper spinal breadth in both sexes (Tables 2 and 5). The two factors causing these associations, independently extracted from males and females, have significantly similar pat- terns of variation in their factor loadings (Table 18). These findings strongly suggest the tight connection in shape of the neurocranium and the pelvis.
Within-population variations
This tight connection between the neurocrani-
um and the pelvis had already been suggested by
Mizoguchi (1992) in his preliminary analysis
using the same male sample as in the present
Table 2. Principal component analysis of the correlation matrix on the first set of neurocranial and pelvic mea- surements from Japanese males.1)
Factor loadings Total
Variable2) variance
PC I II III IV V (%)
1 Cranial length .61*** .07 .26 .57 .02 76.65
8 Cranial breadth .45* .32 .64 .12 .35 84.41
17 Basi-bregmatic height .44* .48 .31 .43 .08 70.31
K1 Physiological pelvic height .89*** .13 .19 .15 .19 90.43
K2 Physiological pelvic depth .49* .34 .39 .45 .21 75.71
1 Height of innominate .95*** .07 .09 .06 .16 94.06
K4 Height of innominate .90*** .01 .02 .02 .11 81.58
2 Maximum pelvic breadth .78*** .46 .22 .08 .07 87.17
3 Maximum pelvic depth .70*** .59 .13 .12 .03 87.06
3(1) Lumbo-pubic depth .63*** .59 .02 .25 .18 83.76
5 Anterior upper spinal breadth .75*** .45 .13 .22 .28 91.80
5(1) Anterior lower spinal breadth .72*** .47 .24 .02 .02 79.57
6 Posterior upper spinal breadth .27 .54 .07 .40 .46 73.94
7 Acetabular breadth .41 .32 .68 .09 .31 83.90
19 Inter-obturator breadth .36 .36 .03 .22 .56 61.98
Total contribution (%) 42.95 15.48 9.17 7.36 6.53 81.49
Cumulative proportion (%) 42.95 58.43 67.60 74.96 81.49 81.49
1) The sample size is 24. The number of the principal components shown here was so determined that the cumula- tive proportion of the variances of the principal components exceeded 80%.
2) See the second footnote to Table 1.
*P0.05; **P0.01; ***P0.001, by a two-tailed bootstrap test.
Table 3. Solution obtained through the normal varimax rotation of the first five principal components for the cor- relation matrix on the first set of neurocranial and pelvic measurements from Japanese males.1)
Factor loadings Variable2)
Fac I II III IV V
1 Cranial length .36 .02 .15 .77* .16
8 Cranial breadth .90** .08 .15 .11 .03
17 Basi-bregmatic height .03 .38 .13 .74* .05
K1 Physiological pelvic height .20 .65 .36 .22 .50**
K2 Physiological pelvic depth .14 .34 .58 .52 .14
1 Height of innominate .31 .60 .35 .33 .50**
K4 Height of innominate .38 .50 .32 .33 .46*
2 Maximum pelvic breadth .73 .07 .29 .31 .39
3 Maximum pelvic depth .15 .85 .01 .35 .04
3(1) Lumbo-pubic depth .01 .87 .03 .20 .22
5 Anterior upper spinal breadth .82 .21 .36 .01 .26
5(1) Anterior lower spinal breadth .44 .07 .58* .12 .50*
6 Posterior upper spinal breadth .10 .73 .11 .18 .39
7 Acetabular breadth .11 .00 .90* .07 .08
19 Inter-obturator breadth .13 .02 .02 .06 .77
Table 4. Principal component analysis of the correlation matrix on the first set of neurocranial and pelvic mea- surements from Japanese females.1)
Factor loadings Total
Variable2) variance
PC I II III IV V (%)
1 Cranial length .42 .33 .68 .08 .15 77.75
8 Cranial breadth .01 .86 .38 .03 .07 88.24
17 Basi-bregmatic height .29 .69 .26 .05 .39 78.88
K1 Physiological pelvic height .73* .28 .04 .16 .47 86.23
K2 Physiological pelvic depth .73*** .32 .12 .42 .01 81.81
1 Height of innominate .97*** .10 .01 .12 .05 97.07
K4 Height of innominate .93*** .11 .01 .16 .02 89.74
2 Maximum pelvic breadth .85*** .07 .13 .25 .09 81.08
3 Maximum pelvic depth .73*** .37 .04 .40 .31 94.01
3(1) Lumbo-pubic depth .76*** .36 .12 .41 .29 96.12
5 Anterior upper spinal breadth .62*** .04 .53 .46 .09 88.22
5(1) Anterior lower spinal breadth .83*** .25 .26 .19 .03 85.90
6 Posterior upper spinal breadth .09 .61 .19 .54 .23 76.06
7 Acetabular breadth .32 .45 .62 .27 .33 87.36
19 Inter-obturator breadth .32 .13 .70 .14 .38 78.16
Total contribution (%) 41.75 16.28 13.23 8.45 6.08 85.78
Cumulative proportion (%) 41.75 58.02 71.25 79.70 85.78 85.78
1) The sample size is 19. The number of the principal components shown here was so determined that the cumula- tive proportion of the variances of the principal components exceeded 80%.
2) See the second footnote to Table 1.
*P0.05; **P0.01; ***P0.001, by a two-tailed bootstrap test.
Table 5. Solution obtained through the normal varimax rotation of the first five principal components for the cor- relation matrix on the first set of neurocranial and pelvic measurements from Japanese females.1)
Factor loadings Variable2)
Fac I II III IV V
1 Cranial length .66** .43 .05 .07 .38
8 Cranial breadth .25 .70 .42 .32 .22
17 Basi-bregmatic height .25 .24 .78** .24 .08
K1 Physiological pelvic height .43 .51* .13 .28 .57
K2 Physiological pelvic depth .22 .52 .16 .61 .31
1 Height of innominate .72* .02 .03 .56 .38
K4 Height of innominate .72* .01 .01 .52 .33
2 Maximum pelvic breadth .77* .04 .05 .43 .17
3 Maximum pelvic depth .25 .02 .12 .93*** .04
3(1) Lumbo-pubic depth .19 .05 .07 .95*** .09
5 Anterior upper spinal breadth .92* .02 .16 .03 .06
5(1) Anterior lower spinal breadth .57 .11 .34 .39 .50
6 Posterior upper spinal breadth .11 .86* .01 .04 .04
7 Acetabular breadth .11 .06 .81 .13 .43
19 Inter-obturator breadth .00 .05 .16 .04 .87*
1) The sample size is 19. The cumulative proportion of the variances of the five principal components is 85.78%.
2) See the second footnote to Table 1.
Table 6. Principal component analysis of the correlation matrix on the second set of neurocranial and pelvic mea- surements from Japanese males.1)
Factor loadings Total
Variable2) variance
PC I II III IV V (%)
1 Cranial length .30 .44 .49 .07 .27 59.42
8 Cranial breadth .22 .26 .43 .71 .05 80.32
17 Basi-bregmatic height .39 .39 .23 .23 .60 77.33
23 Sagittal diameter of pelvic inlet .66** .15 .64 .21 .10 92.15
24 Transverse diameter of pelvic inlet .44* .04 .40 .72 .00 86.66
25 Oblique diameter of pelvic inlet .70*** .06 .10 .58 .07 84.45
26(1) Sagittal diameter of pelvic outlet .69*** .17 .07 .10 .54 80.69
8 Breadth between ischial spines .27 .85 .31 .12 .04 90.32
27 Transverse diameter of pelvic outlet .37 .86 .17 .04 .18 93.59
27a Transverse diameter of pelvic outlet .42 .77 .00 .08 .16 80.23
28 Side height of true pelvis .81*** .42 .20 .03 .01 87.05
29 Anterior height of true pelvis .77*** .09 .32 .01 .27 77.37
30 True height of true pelvis .84*** .13 .26 .06 .11 80.90
18 Length of pubic symphysis .82*** .09 .09 .16 .11 73.00
23(2) Inferior sagittal diam. of true pelvis .66*** .07 .61 .01 .12 83.49 23(1) Normal sagittal diam. of true pelvis .83*** .06 .08 .23 .28 82.46
Total contribution (%) 37.63 17.08 11.18 9.79 6.16 81.84
Cumulative proportion (%) 37.63 54.71 65.89 75.68 81.84 81.84
1) The sample size is 30. The number of the principal components shown here was so determined that the cumula- tive proportion of the variances of the principal components exceeded 80%.
2) See the second footnote to Table 1.
*P0.05; **P0.01; ***P0.001, by a two-tailed bootstrap test.
Table 7. Solution obtained through the normal varimax rotation of the first five principal components for the cor- relation matrix on the second set of neurocranial and pelvic measurements from Japanese males.1)
Factor loadings Variable2)
Fac I II III IV V
1 Cranial length .24 .12 .17 .11 .69
8 Cranial breadth .37 .43 .15 .61 .29
17 Basi-bregmatic height .03 .07 .19 .02 .86
23 Sagittal diameter of pelvic inlet .21 .15 .92 .08 .02
24 Transverse diameter of pelvic inlet .26 .25 .15 .83 .16
25 Oblique diameter of pelvic inlet .30 .11 .42 .74 .14
26(1) Sagittal diameter of pelvic outlet .87* .02 .19 .07 .01
8 Breadth between ischial spines .11 .92 .08 .13 .15
27 Transverse diameter of pelvic outlet .02 .95 .14 .08 .01
27a Transverse diameter of pelvic outlet .04 .84 .31 .02 .03
28 Side height of true pelvis .65* .09 .27 .30 .53
29 Anterior height of true pelvis .79 .18 .10 .21 .26
30 True height of true pelvis .42 .06 .68 .29 .29
18 Length of pubic symphysis .53* .20 .42 .09 .47
23(2) Inferior sagittal diam. of true pelvis .18 .09 .88 .12 .00
23(1) Normal sagittal diam. of true pelvis .76* .12 .47 .02 .13
Table 8. Principal component analysis of the correlation matrix on the second set of neurocranial and pelvic mea- surements from Japanese females.1)
Factor loadings Total
Variable2) variance
PC I II III IV (%)
1 Cranial length .52* .50 .27 .47 81.56
8 Cranial breadth .04 .43 .78 .31 88.65
17 Basi-bregmatic height .45 .01 .58 .24 59.37
23 Sagittal diameter of pelvic inlet .59 .47 .48 .30 88.63
24 Transverse diameter of pelvic inlet .76* .04 .42 .30 84.10
25 Oblique diameter of pelvic inlet .86** .08 .29 .13 84.52
26(1) Sagittal diameter of pelvic outlet .82*** .02 .16 .28 76.70
8 Breadth between ischial spines .15 .73 .58 .13 91.14
27 Transverse diameter of pelvic outlet .08 .91* .26 .10 90.48
27a Transverse diameter of pelvic outlet .04 .86 .40 .11 90.69
28 Side height of true pelvis .88*** .07 .08 .22 83.00
29 Anterior height of true pelvis .85*** .06 .19 .30 85.72
30 True height of true pelvis .84*** .10 .24 .19 81.10
18 Length of pubic symphysis .78** .24 .22 .29 80.01
23(2) Inferior sagittal diam. of true pelvis .67 .50 .46 .14 92.21 23(1) Normal sagittal diam. of true pelvis .88*** .02 .15 .28 87.70
Total contribution (%) 42.82 19.25 15.49 6.54 84.10
Cumulative proportion (%) 42.82 62.07 77.56 84.10 84.10
1) The sample size is 18. The number of the principal components shown here was so determined that the cumula- tive proportion of the variances of the principal components exceeded 80%.
2) See the second footnote to Table 1.
*P0.05; **P0.01; ***P0.001, by a two-tailed bootstrap test.
Table 9. Solution obtained through the normal varimax rotation of the first four principal components for the cor- relation matrix on the second set of neurocranial and pelvic measurements from Japanese females.1)
Factor loadings Variable2)
Fac I II III IV
1 Cranial length .33 .32 .23 .75
8 Cranial breadth .21 .03 .39 .83
17 Basi-bregmatic height .26 .33 .47 .45
23 Sagittal diameter of pelvic inlet .10 .14 .91* .15
24 Transverse diameter of pelvic inlet .89* .17 .09 .11
25 Oblique diameter of pelvic inlet .85* .01 .26 .22
26(1) Sagittal diameter of pelvic outlet .57 .01 .53 .41
8 Breadth between ischial spines .04 .94 .10 .14
27 Transverse diameter of pelvic outlet .11 .92 .17 .12
27a Transverse diameter of pelvic outlet .14 .93 .03 .16
28 Side height of true pelvis .84* .10 .34 .03
29 Anterior height of true pelvis .88* .06 .27 .01
30 True height of true pelvis .48 .10 .75* .08
18 Length of pubic symphysis .86 .18 .11 .11
23(2) Inferior sagittal diam. of true pelvis .25 .16 .88* .25
23(1) Normal sagittal diam. of true pelvis .51 .15 .73* .25
1) The sample size is 18. The cumulative proportion of the variances of the four principal components is 84.10%.
2) See the second footnote to Table 1.
Table 11. Solution obtained through the normal varimax rotation of the first five principal components for the correlation matrix on the third set of neurocranial and pelvic measurements from Japanese males.1)
Factor loadings Variable2)
Fac I II III IV V
1 Cranial length .28 .28 .02 .03 .84*
8 Cranial breadth .39* .44 .46 .55* .05
17 Basi-bregmatic height .02 .83 .09 .07 .30
9 Iliac height .82** .25 .17 .01 .28
10 Height of iliac blade .83** .14 .11 .05 .38
K28 Height of iliac blade .85** .16 .21 .01 .34
12 Iliac breadth .76** .36 .19 .14 .07
13 Breadth of iliac blade .71* .49 .22 .10 .02
4 Maximum breadth of innominate .83** .27 .09 .03 .25
17 Pubis length .83** .13 .21 .04 .14
15 Ischium length .79* .09 .28 .07 .16
11 Depth of iliac fossa .30 .16 .14 .85 .01
20 Length of obturator foramen .34 .11 .70* .05 .12
21 Breadth of obturator foramen .29 .06 .82** .13 .06
14 Acetabulo-symphysial breadth .91** .14 .08 .21 .07
22 Maximum diameter of acetabulum .73** .26 .18 .15 .09
Table 10. Principal component analysis of the correlation matrix on the third set of neurocranial and pelvic mea- surements from Japanese males.1)
Factor loadings Total
Variable2) variance
PC I II III IV V (%)
1 Cranial length .50** .44 .32 .20 .52 85.72
8 Cranial breadth .29 .62 .19 .57 .15 85.24
17 Basi-bregmatic height .31 .61 .44 .27 .23 78.70
9 Iliac height .90*** .10 .03 .05 .08 83.84
10 Height of iliac blade .89*** .10 .01 .09 .23 86.41
K28 Height of iliac blade .94*** .03 .04 .06 .17 91.57
12 Iliac breadth .85*** .08 .02 .07 .17 77.11
13 Breadth of iliac blade .82*** .13 .04 .05 .32 79.93
4 Maximum breadth of innominate .80*** .02 .24 .13 .35 82.92
17 Pubis length .80*** .23 .13 .17 .17 77.21
15 Ischium length .81*** .25 .07 .04 .14 74.18
11 Depth of iliac fossa .34 .04 .39 .76 .12 86.78
20 Length of obturator foramen .54** .34 .46 .08 .08 63.18
21 Breadth of obturator foramen .46 .47 .54 .12 .21 78.39
14 Acetabulo-symphysial breadth .84*** .23 .34 .03 .12 89.84
22 Maximum diameter of acetabulum .81*** .02 .05 .08 .09 66.68
Total contribution (%) 51.54 9.43 7.40 6.93 5.17 80.48
Cumulative proportion (%) 51.54 60.98 68.38 75.31 80.48 80.48
1) The sample size is 29. The number of the principal components shown here was so determined that the cumula- tive proportion of the variances of the principal components exceeded 80%.
2) See the second footnote to Table 1.
*P0.05; **P0.01; ***P0.001, by a two-tailed bootstrap test.
Table 12. Principal component analysis of the correlation matrix on the third set of neurocranial and pelvic mea- surements from Japanese females.1)
Factor loadings Total
Variable2) variance
PC I II III IV V (%)
1 Cranial length .29 .77 .07 .06 .39 83.76
8 Cranial breadth .14 .79 .19 .24 .36 86.21
17 Basi-bregmatic height .38** .31 .72 .30 .19 88.29
9 Iliac height .94*** .05 .16 .07 .02 91.31
10 Height of iliac blade .84*** .07 .22 .13 .07 77.77
K28 Height of iliac blade .85*** .04 .28 .01 .02 80.94
12 Iliac breadth .94*** .01 .04 .11 .10 91.25
13 Breadth of iliac blade .67** .22 .43 .33 .22 84.34
4 Maximum breadth of innominate .88*** .12 .01 .01 .24 84.45
17 Pubis length .76*** .00 .47 .12 .19 84.95
15 Ischium length .86*** .03 .07 .22 .16 80.99
11 Depth of iliac fossa .13 .54 .45 .51 .31 87.39
20 Length of obturator foramen .55* .54 .07 .21 .35 76.66
21 Breadth of obturator foramen .49* .15 .20 .59 .48 88.43
14 Acetabulo-symphysial breadth .89*** .07 .31 .16 .15 94.56
22 Maximum diameter of acetabulum .78*** .08 .25 .22 .17 75.75
Total contribution (%) 49.63 12.51 9.63 6.76 6.29 84.82
Cumulative proportion (%) 49.63 62.14 71.77 78.53 84.82 84.82
1) The sample size is 20. The number of the principal components shown here was so determined that the cumula- tive proportion of the variances of the principal components exceeded 80%.
2) See the second footnote to Table 1.
*P0.05; **P0.01; ***P0.001, by a two-tailed bootstrap test.
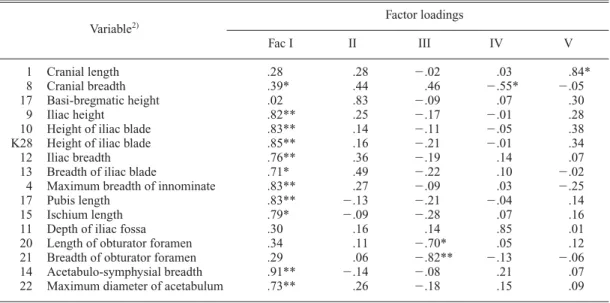
Table 13. Solution obtained through the normal varimax rotation of the first five principal components for the correlation matrix on the third set of neurocranial and pelvic measurements from Japanese females.1)
Factor loadings Variable2)
Fac I II III IV V
1 Cranial length .18 .83 .14 .16 .28
8 Cranial breadth .09 .90 .11 .19 .02
17 Basi-bregmatic height .04 .28 .31 .78* .31
9 Iliac height .74* .10 .03 .59* .07
10 Height of iliac blade .84** .05 .18 .18 .06
K28 Height of iliac blade .86** .09 .13 .19 .09
12 Iliac breadth .82** .02 .04 .48* .02
13 Breadth of iliac blade .49 .13 .42 .60* .23
4 Maximum breadth of innominate .84** .02 .06 .31 .19
17 Pubis length .90* .03 .16 .07 .06
15 Ischium length .66* .19 .02 .57* .13
11 Depth of iliac fossa .07 .14 .01 .08 .92*
20 Length of obturator foramen .29 .21 .23 .60 .48
21 Breadth of obturator foramen .36 .04 .86*** .15 .01
14 Acetabulo-symphysial breadth .94** .09 .21 .14 .00
22 Maximum diameter of acetabulum .51 .07 .00 .69** .10
1) The sample size is 20. The cumulative proportion of the variances of the five principal components is 84.82%.
2) See the second footnote to Table 1.
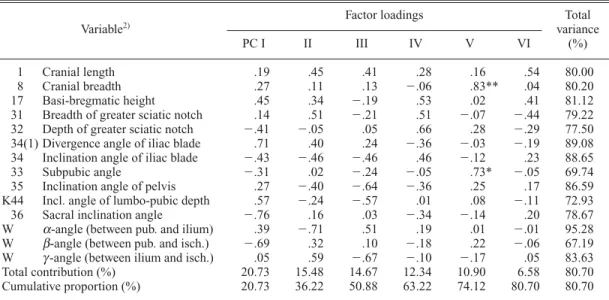
Table 14. Principal component analysis of the correlation matrix on the fourth set of neurocranial and pelvic measurements from Japanese males.1)
Factor loadings Total
Variable2) variance
PC I II III IV V VI (%)
1 Cranial length .19 .45 .41 .28 .16 .54 80.00
8 Cranial breadth .27 .11 .13 .06 .83** .04 80.20
17 Basi-bregmatic height .45 .34 .19 .53 .02 .41 81.12
31 Breadth of greater sciatic notch .14 .51 .21 .51 .07 .44 79.22
32 Depth of greater sciatic notch .41 .05 .05 .66 .28 .29 77.50
34(1) Divergence angle of iliac blade .71 .40 .24 .36 .03 .19 89.08 34 Inclination angle of iliac blade .43 .46 .46 .46 .12 .23 88.65
33 Subpubic angle .31 .02 .24 .05 .73* .05 69.74
35 Inclination angle of pelvis .27 .40 .64 .36 .25 .17 86.59
K44 Incl. angle of lumbo-pubic depth .57 .24 .57 .01 .08 .11 72.93
36 Sacral inclination angle .76 .16 .03 .34 .14 .20 78.67
W a-angle (between pub. and ilium) .39 .71 .51 .19 .01 .01 95.28
W b-angle (between pub. and isch.) .69 .32 .10 .18 .22 .06 67.19
W g-angle (between ilium and isch.) .05 .59 .67 .10 .17 .05 83.63
Total contribution (%) 20.73 15.48 14.67 12.34 10.90 6.58 80.70
Cumulative proportion (%) 20.73 36.22 50.88 63.22 74.12 80.70 80.70
1) The sample size is 26. The number of the principal components shown here was so determined that the cumula- tive proportion of the variances of the principal components exceeded 80%.
2) See the second footnote to Table 1.
*P0.05; **P0.01; ***P0.001, by a two-tailed bootstrap test.
Table 15. Solution obtained through the normal varimax rotation of the first six principal components for the cor- relation matrix on the fourth set of neurocranial and pelvic measurements from Japanese males.1)
Factor loadings Variable2)
Fac I II III IV V VI
1 Cranial length .21 .19 .07 .02 .07 .84**
8 Cranial breadth .12 .30 .15 .02 .79 .23
17 Basi-bregmatic height .39 .06 .21 .18 .05 .76*
31 Breadth of greater sciatic notch .16 .10 .35 .79*** .07 .11
32 Depth of greater sciatic notch .17 .47 .19 .65* .27 .00
34(1) Divergence angle of iliac blade .23 .90*** .05 .00 .07 .11
34 Inclination angle of iliac blade .11 .93*** .03 .00 .09 .04
33 Subpubic angle .10 .20 .14 .02 .78 .12
35 Inclination angle of pelvis .61** .16 .21 .53* .30 .24
K44 Incl. angle of lumbo-pubic depth .83** .00 .16 .06 .08 .12
36 Sacral inclination angle .74 .23 .28 .28 .04 .18
W a-angle (between pub. and ilium) .31 .01 .91** .07 .13 .02
W b-angle (between pub. and isch.) .70 .08 .23 .05 .30 .15
W g-angle (between ilium and isch.) .15 .05 .89* .05 .07 .08
1) The sample size is 26. The cumulative proportion of the variances of the six principal components is 80.70%.
2) See the second footnote to Table 1.
Table 16. Principal component analysis of the correlation matrix on the fourth set of neurocranial and pelvic measurements from Japanese females.1)
Factor loadings Total
Variable2) variance
PC I II III IV V (%)
1 Cranial length .43 .69 .25 .04 .26 79.90
8 Cranial breadth .02 .66 .03 .58 .26 83.97
17 Basi-bregmatic height .47 .28 .39 .55 .16 77.28
31 Breadth of greater sciatic notch .40 .34 .75 .29 .11 92.81
32 Depth of greater sciatic notch .44 .38 .21 .54 .46 88.38
34(1) Divergence angle of iliac blade .86 .24 .09 .05 .03 80.48
34 Inclination angle of iliac blade .72 .23 .14 .05 .51 85.78
33 Subpubic angle .71 .22 .20 .28 .17 69.82
35 Inclination angle of pelvis .55 .32 .48 .22 .40 84.24
K44 Incl. angle of lumbo-pubic depth .88 .05 .13 .31 .15 91.43
36 Sacral inclination angle .81 .33 .02 .00 .12 78.31
W a-angle (between pub. and ilium) .32 .77 .12 .43 .25 95.05
W b-angle (between pub. and isch.) .61 .28 .60 .02 .22 86.27
W g-angle (between ilium and isch.) .13 .84 .29 .38 .07 95.77
Total contribution (%) 33.97 21.43 11.34 11.17 7.05 84.96
Cumulative proportion (%) 33.97 55.41 66.75 77.92 84.96 84.96
1) The sample size is 16. The number of the principal components shown here was so determined that the cumula- tive proportion of the variances of the principal components exceeded 80%.
2) See the second footnote to Table 1.
*P0.05; **P0.01; ***P0.001, by a two-tailed bootstrap test.
Table 17. Solution obtained through the normal varimax rotation of the first five principal components for the correlation matrix on the fourth set of neurocranial and pelvic measurements from Japanese females.1)
Factor loadings Variable2)
Fac I II III IV V
1 Cranial length .34 .70 .07 .30 .31
8 Cranial breadth .14 .30 .11 .85** .02
17 Basi-bregmatic height .30 .15 .05 .78 .22
31 Breadth of greater sciatic notch .03 .29 .91 .06 .10
32 Depth of greater sciatic notch .01 .01 .05 .57 .75*
34(1) Divergence angle of iliac blade .64 .13 .36 .18 .47
34 Inclination angle of iliac blade .35 .16 .24 .01 .81**
33 Subpubic angle .79 .21 .09 .10 .12
35 Inclination angle of pelvis .81 .18 .18 .34 .06
K44 Incl. angle of lumbo-pubic depth .90 .06 .19 .03 .23
36 Sacral inclination angle .59 .40 .28 .06 .44
W a-angle (between pub. and ilium) .11 .86 .43 .05 .11
W b-angle (between pub. and isch.) .36 .31 .77 .12 .15
W g-angle (between ilium and isch.) .14 .94 .15 .04 .19
1) The sample size is 16. The cumulative proportion of the variances of the five principal components is 84.96%.
2) See the second footnote to Table 1.
*P0.05; **P0.01; ***P0.001, by a two-tailed bootstrap test.
most highly correlated with cranial length among the rotated factors extracted there, had relatively high correlations with mandibular length and iliac breadth. Although the statistical significance of the results was not tested at that time, the close connection was confirmed in the present study through the significance tests of the results from both male and female data.
Further, Mizoguchi (1992) applied PCA to the correlation matrix on somatometric data of Japanese males reported by Hoshi and Kouchi (1978), and showed that there was a relatively
significance was not tested. But the result is not inconsistent with the present findings.
The present and the above findings by Mi- zoguchi are also compatible with Mizoguchi’s (1998b) results that cranial length is strongly as- sociated with the sacral breadths at the upper and middle levels.
Both in obstetrics and in anthropology, it has been pointed out that the shapes of the fetal head and the maternal pelvic inlet play important roles when the fetus successfully negotiates the birth canal (Rosenberg, 1992; Rosenberg and Tre-
Table 18. Spearman’s rank correlation coefficients between males and females in the variation pattern of factor loadings on the principal components and/or rotated factors obtained from the first sets of neurocranial and pelvic measurements.1)
Male PC I II III IV V Fac I II III IV V
Female PC I .85*** — — — — — — — — .57*
II — — .63* — — — — .65** — —
III — — — — — — — — — —
IV — .85*** — — — .64* .67** — — .53*
V — — — — — — — — — —
Fac I .82*** — — — — — — — — —
II — — — — — — — — — —
III — — .63* — — — .55* .58* — —
IV — — — — — — — — — —
V — — .63* — — — — — — .60*
1)Only those rank correlation coefficients significant at the 5% level are listed here. The signs of rank correlation coefficients are removed because the signs of factor loadings are reversible. The original factor loadings are listed in Tables 2, 3, 4 and 5.
*P0.05; **P0.01; ***P0.001, by a two-tailed test.
Table 19. Spearman’s rank correlation coefficients between males and females in the variation pattern of factor loadings on the principal components and/or rotated factors obtained from the second sets of neurocranial and pelvic measurements.1)
Male PC I II III IV V Fac I II III IV V
Female PC I .89*** .58* — — — .78*** .52* — — —
II — .81*** — — — .57* .66** — — .67**
III — — — .66** — — — — .51* —
IV — — — — — — — — — —
Fac I .66** .58* — — — .64** — — .63** —
II — .79*** — — — — .70** — — .85***
III — — .55* — — — .53* .60* — —
IV — — — — — — — — — —
1) Only those rank correlation coefficients significant at the 5% level are listed here. The signs of rank correlation coefficients are removed because the signs of factor loadings are reversible. The original factor loadings are listed in Tables 6, 7, 8 and 9.
*P0.05; **P0.01; ***P0.001, by a two-tailed test.
the sagittal direction and that of the maternal pelvic inlet exists in the transverse direction.
Therefore, when the fetal head enters the mater- nal pelvic inlet, its sagittal axis is aligned with the maternal transverse axis. From this fact, it is expected that there is a high correlation between the fetal head and the maternal pelvic dimen- sions.
The above findings by the present author, how- ever, are based on the data from the same adult individuals, not from fetuses and their mothers.
Nevertheless, strong associations were found be-
should this be interpreted?
The shape of the fetal neurocranium must be determined by both maternal and paternal genes.
But, independent of whether they derive from its mother or father, those genes which produce such a cranial shape as does not fit the shape of its mother’s pelvis are weeded out. Namely, the cra- nial shapes of all living newborns must be within the variation of the shapes of mothers’ pelves.
On the other hand, those mothers whose pelvic shape does not fit a possible shape of the fetal neurocranium cannot have children, and the
Table 20. Spearman’s rank correlation coefficients between males and females in the variation pattern of factor loadings on the principal components and/or rotated factors obtained from the third sets of neurocranial and pelvic measurements.1)
Male PC I II III IV V Fac I II III IV V
Female PC I .83*** — — — — .76*** — — — —
II .58* — — — — — — — — —
III — — — — — — .71** — — —
IV — — — — — — — — .60* —
V — — .56* .59* — .61* — — — —
Fac I .76*** — — .51* — .94*** .50* — — —
II .54* — — — — — — — — —
III — — — — — — — — — —
IV — — — — — — .52* — — —
V — .66** — — — — .63** — — —
1) Only those rank correlation coefficients significant at the 5% level are listed here. The signs of rank correlation coefficients are removed because the signs of factor loadings are reversible. The original factor loadings are listed in Tables 10, 11, 12 and 13.
*P0.05; **P0.01; ***P0.001, by a two-tailed test.
Table 21. Spearman’s rank correlation coefficients between males and females in the variation pattern of factor loadings on the principal components and/or rotated factors obtained from the fourth sets of neurocranial and pelvic measurements.1)
Male PC I II III IV V VI Fac I II III IV V VI
Female PC I .56* — — — — — — — — — — —
II — .55* — — — — — — — — — —
III — — — — — .60* — — — — — —
IV — — — — — — — — — .61* — —
V — — — — — — — — — — — —
Fac I .57* — — — — — — — — — — —
II — — — — — — — — — .54* — —
III — — — — — .60* — — — .54* — —
IV — — — — — — — — — — .54* —
V — — — — — — — — — — — —
1) Only those rank correlation coefficients significant at the 5% level are listed here. The signs of rank correlation coefficients are removed because the signs of factor loadings are reversible. The original factor loadings are listed in Tables 14, 15, 16 and 17.
*P0.05; **P0.01; ***P0.001, by a two-tailed test.
cluded from the gene pool of the population. In other words, apart from the genes concerned with the sexual dimorphism of the pelvis, even boys, as long as they are alive, must also carry the genes that express the same general pelvic shapes as their mothers’ appropriate ones.
After all, as was suggested by Mizoguchi (1998b), it is most likely that the shapes of the neurocranium and pelvis have been formed, mu- tually affecting each other, through the human evolutionary process. Hence, in the modern human population, the close correspondence be- tween the neurocranial and the pelvic forms is fixed as a population characteristic.
Among-population variations
The above-stated analyses are based on within- population variations, not on among-population variations. But brachycephalization is a phenom- enon between a series of populations of different periods in a certain region, in other words, an among-population phenomenon. Here, therefore, some previous analyses of among-population variations in cranial and pelvic measurements are reviewed.
Facchini and Gualdi-Russo (1982) showed the data on secular changes of some anthropometric variables in Bologna, Italy. According to their ta- bles, maximum head length and bicristal breadth seem to have changed in parallel from 1930 to 1982 both in males and in females (Table 22).
This is not inconsistent with the results of the analyses of within-population variations men- tioned above.
Kurisu (1970) reported somatometric data on the male samples from eight native groups in Sarawak, Malaysia. On the basis of the mean val- ues, the present author calculated Spearman’s rank correlation coefficients between head and body measurements (Table 23). As a result, it was found that biiliac breadth was highly signifi- cantly associated with head length (Spearman’s rho 0.86; P 0.01). This is again compatible with the results of the present and previous analyses based on within-population variations.
Brachycephalization and the pelvic shape The above-mentioned studies based on both within-population and among-population varia- tions suggest that pelvic breadth is strongly asso- ciated with cranial length. If so, one of the causes for brachycephalization may have been a secular change in the form of female pelves. But, if it is the case, what did make the pelvic shape change?
That may have been a secular change in the way of walking? Regarding this, much more detailed analyses should be conducted in the future.
Summary and Conclusions
The principal component analyses and the ro- tation of their results on the neurocranium and the pelvis revealed that cranial length and pelvic breadth were strongly associated with each other.
It is inferred from these findings and previous studies based on both within-population and among-population variations that the form of the maternal pelvic inlet has played and still plays an
Table 22. Secular changes of cranial and pelvic measurements in Bologna, Italy.1)
Year of report: 1930 1941 1982
Mean (n) SD Mean (n) SD Mean (n) SD
Maximum head length Male 188 (300) — — 190.0 (267) 6.8
Female 183 (300) — 178 (50) 7.0 180.7 (219) 6.1
Maximum head breadth Male 158 (300) — — 149.1 (267) 6.6
Female 153 (300) — 147 (50) 7.0 142.4 (219) 6.3
Bicristal breadth Male 296 (300) 17 — 328.6 (265) 28.6
important role in determining the neurocranial form in modern human populations, and that one of the causes for brachycephalization may have been a secular change of the pelvic form.
Acknowledgments
I wish to express my gratitude to Professor Maciej Henneberg of the University of Adelaide, Australia, for giving me an opportunity to read an early version of this paper at the symposium organized by him in the 15th International Con- gress of the Anthropological and Ethnological Sciences held in 2003 in Florence, Italy. I would also like to thank Ms. Elizabeth A. Hollar for correcting the English expressions of this manu- script.
This work was partly supported by a Grant-in- Aid for Scientific Research (S) from the Japan Society for the Promotion of Science (Project No. 17107006).
Literature Cited
Abitbol, M. M., 1993. Adjustment of the fetal head and adult pelvis in modern humans. Human Evolution, 8:
167–185.
Factor Analysis Methods). Kyoritsu-Shuppan, Tokyo.
(In Japanese.)
Diaconis, P., and B. Efron, 1983. Computer-intensive methods in statistics. Scientific American, 248: 96–108, 138.
Efron, B., 1979a. Bootstrap methods: Another look at the jackknife. Ann. Statist., 7: 1–26.
Efron, B., 1979b. Computers and the theory of statistics:
Thinking the unthinkable. SIAM Rev., 21: 460–480.
Efron, B., 1982. The Jackknife, the Bootstrap and Other Resampling Plans.Society for Industrial and Applied Mathematics, Philadelphia.
Facchini, F., and E. Gualdi-Russo, 1982. Secular anthro- pometric changes in a sample of Italian adults. J. Hum.
Evol., 11: 703–714.
Hoshi, H., and M. Kouchi, 1978. Anthropometry of adult male Japanese with remarks on correlation coefficients.
Acta Anatomica Nipponica, 53: 238–247. (In Japanese with English summary.)
Kiyono, K., 1929. Jinkotsu sokutei-hyou (Measurement methods for human bones). In: Kokogaku Koza I.
Yuzankaku, Tokyo. (In Japanese.)
Kurisu, K., 1970. Multivariate statistical analysis on the physical interrelationship of native tribes in Sarawak, Malaysia. Am. J. Phys. Anthrop., 33: 229–233.
Lawley, D. N., and A. E. Maxwell, 1963. Factor Analysis as a Statistical Method.Butterworth, London. (Trans- lated by M. Okamoto, 1970, into Japanese and entitled Inshi-Bunsekiho. Nikkagiren, Tokyo.)
Martin, R., and K. Saller, 1957. Lehrbuch der Anthro- pologie, dritte Aufl., Bd. I. Gustav Fischer Verlag, Table 23. Spearman’s rank correlation coefficients between head and body measurements based on the means in
male samples from eight native groups in Sarawak, Malaysia.1)
Head length Head breadth Length-breadth index
Head breadth .62 — —
Length-breadth index .74* .95*** —
Auricular height .00 .00 .10
Bizygomatic breadth .26 .02 .12
Bigonial breadth .74* .14 .29
Physiognomic facial height .02 .06 .07
Morphological facial height (g-gn) .50 .74* .67
Nose height (g-sn) .02 .50 .57
Nose breadth .31 .26 .12
Stature .12 .36 .38
Trunk length .21 .55 .55
Arm length .31 .67 .67
Leg length .69 .57 .57
Biacromial breadth .57 .02 .17
Biiliac breadth .86** .81* .90**
1) Data source: Kurisu (1970).
*P0.05; **P0.01; ***P0.001.
Miyamoto, H., 1924. Gendai nihonjin jinkotsu no jin- ruigaku-teki kenkyu, Dai-1-bu: Togaikotsu no kenkyu (An anthropological study on the skeletons of modern Japanese, Part 1: A study of skulls). J. Anthrop. Soc.
Nippon, 39: 307–451; Data 1–48. (In Japanese.) Miyamoto, H., 1927. Gendai nihonjin jinkotsu no jin-
ruigaku-teki kenkyu, Dai-3-bu: Kotsuban no kenkyu (Anthropologische Untersuchungen über das Skelett der rezenten Japaner, III. Teil: Das Becken). J. Anthrop.
Soc. Nippon, 42: 197–222, 241–272. (In Japanese with German title.)
Mizoguchi, Y., 1992. An interpretation of brachycephal- ization based on the analysis of correlations between cranial and postcranial measurements. In: T. Brown and S. Molnar (eds.), Craniofacial Variation in Pacific Pop- ulations, pp. 1–19. Anthropology and Genetics Labora- tory, Department of Dentistry, the University of Ade- laide, Adelaide.
Mizoguchi, Y., 1993. Overall associations between dental size and foodstuff intakes in modern human popula- tions. Homo, 44: 37–73.
Mizoguchi, Y., 1994. Morphological covariation between the neurocranium and the lumbar vertebrae: Toward the solution of the brachycephalization problem. Bull.
Natn. Sci. Mus., Tokyo, Ser. D, 20: 47–61.
Mizoguchi, Y., 1995. Structural covariation between the neurocranium and the cervical vertebrae: Toward the solution of the brachycephalization problem. Bull.
Natn. Sci. Mus., Tokyo, Ser. D, 21: 11–35.
Mizoguchi, Y., 1996. Varimax rotation of the principal components extracted from the correlations between the neurocranium and the cervical vertebrae: Toward the solution of the brachycephalization problem. Bull.
Natn. Sci. Mus., Tokyo, Ser. D, 22: 27–44.
Mizoguchi, Y., 1997. Associations in sagittal length ob- served between the neurocranium and the thoracic ver- tebrae: Toward the solution of the brachycephalization problem. Bull. Natn. Sci. Mus., Tokyo, Ser. D, 23:
29–60.
Mizoguchi, Y., 1998a. Covariations of the neurocranium with the cervical, thoracic and lumbar vertebrae and the sacrum: Toward the solution of the brachycephalization problem. Bull. Natn. Sci. Mus., Tokyo, Ser. D, 24:
19–48.
Mizoguchi, Y., 1998b. Significant association between cranial length and sacral breadth: Toward the solution of the brachycephalization problem. Anthropol. Sci., 106 (Suppl.): 147–160.
Mizoguchi, Y., 1999. Strong covariation between costal chord and cranial length: Toward the solution of the
and scapular measurements: Toward the solution of the brachycephalization problem. Bull. Natn. Sci. Mus., Tokyo, Ser. D, 26: 17–30.
Mizoguchi, Y., 2001. Strong associations between cranial length and humeral measurements: Toward the solution of the brachycephalization problem. Bull. Natn. Sci.
Mus., Tokyo, Ser. D, 27: 19–36.
Mizoguchi, Y., 2002. Associations between neurocranial and ulnar/radial measurements: Toward the solution of the brachycephalization problem. Bull. Natn. Sci. Mus., Tokyo, Ser. D, 28: 1–14.
Mizoguchi, Y., 2003a. A possible cause for brachycephal- ization inferred from significant associations between cranial length and pelvic measurements. In: XV ICAES 2K3, Humankind/Nature Interaction: Past, Present and Future, Florence(Italy), July 5th–12th, 2003, Abstract Book, Vol. 1, p. 163. International Union of Anthropo- logical and Ethnological Sciences.
Mizoguchi, Y., 2003b. Significant associations between cranial length and femoral measurements: Toward the solution of the brachycephalization problem. Bull.
Natn. Sci. Mus., Tokyo, Ser. D, 29: 11–23.
Mizoguchi, Y., 2003c. Associations between the neurocra- nium and the leg bones: Toward the solution of the brachycephalization problem. Bull. Natn. Sci. Mus., Tokyo, Ser. D, 29: 25–39.
Mizoguchi, Y., 2004. Associations between the neurocra- nium and the foot bones: Toward the solution of the brachycephalization problem. Bull. Natn. Sci. Mus., Tokyo, Ser. D, 30: 9–36.
Okuno, T., T. Haga, K. Yajima, C. Okuno, S. Hashimoto and Y. Furukawa, 1976. Zoku-Tahenryo-Kaisekiho (Multivariate Analysis Methods, Part 2). Nikkagiren, Tokyo. (In Japanese.)
Okuno, T., H. Kume, T. Haga and T. Yoshizawa, 1971.
Tahenryo-Kaisekiho (Multivariate Analysis Methods).
Nikkagiren, Tokyo. (In Japanese.)
Rosenberg, K.R., 1992. The evolution of modern human childbirth. Yearbook of Physical Anthropology, 35:
89–124.
Rosenberg, K., and W. Trevathan, 1996. Bipedalism and human birth: The obstetrical dilemma revisited. Evolu- tionary Anthropology, 4: 161–168.
Siegel, S., 1956. Nonparametric Statistics for the Behav- ioral Sciences. McGraw-Hill Kogakusha, Tokyo.
Tabata, T., 1930. Kotsuban kenkyu hoi, Dai-1: Nihonjin kankotsu no jiku-kaku ni tsuite (A supplementary study of the pelvis, Part 1: On the angles between the axes of the Japanese hip bone). J. Anthrop. Soc. Nippon, 45 (Suppl. 8): 863–869. (In Japanese.)