Why is the Northern End
of the California Current System
So Productive?
B y B a r B a r a M . H i C k E y a N d N E i l S . B a N a S
S P E C i a l i S S U E O N C O a S ta l O C E a N P r O C E S S E S
E C O S y S t E M r E S P O N S E
This article has been published in Oceanography, Volume 21, Number 4, a quarterly journal of The Oceanography Society. Copyright 2008 by The Oceanography Society. all rights reserved. Permission is granted to copy this article for use in teaching and research. republication, systemmatic rep or collective redistirbution of any portion of this article by photocopy machine, reposting, or other means is permitted only with the approval of The Oceanography Society. Send all correspondence to: info@tos.org or Th e Oceanography Society, PO Box 1931, rockville, Md 20849-1931, USa
aBStr aCt. Although scientists have long believed that, in an eastern boundary current system, alongcoast wind stress is responsible for the upwelling of deep nutrients that initiates phytoplankton blooms, the
California Current System (CCS) presents a challenge to this idea. Seasonally averaged chlorophyll concentrations are several times higher along the Washington/southern British Columbia coast than off northern California, where alongcoast wind stress is several times greater. The high chlorophyll concentration is reflected in higher trophic levels, such as zooplankton and fish density in the northern CCS. This article discusses potential reasons for this apparent paradox. The analysis suggests that the northern CCS has several mechanisms that can produce upwelled nutrient concentrations comparable to those in regions with much greater wind stress, including a persistent nutrient supply through the dynamics of the Strait of Juan de Fuca and local upwelling enhancement by submarine canyons. Large-scale upwelling resulting from coastal-trapped waves forced in the areas with stronger wind stress is also likely an important factor, as is iron input by the Columbia River. In addition, in contrast to other parts of the CCS, the high- productivity northern latitudes have numerous physical features that give phytoplankton blooms time to develop fully and to be retained on the shelf, including wide shelves, coastlines without large capes, a large bank, wind intermittency, and density fronts related to the Columbia River.
dOES PrOdUCtiVity diffEr aCrOSS rEgiONS iN tHE CalifOrNia CUrrENt SyStEM?
Overall biological productivity in the California Current System (CCS), a system of currents that flow along the western boundary of the United States and southern Canadian Pacific coast (Figure 1), is generally attributed to seasonal upwelling of nutrient-rich deep waters to the continental shelf, as in other eastern boundary systems (Hill et al., 1998). This upwelling is caused primarily by the stress of winds blowing equa- torward on the ocean’s surface next to the coastal boundary. When the deeper water with higher nutrient concentration upwells, phytoplankton in the upwelling layers are exposed to light and begin to grow, resulting in a “bloom” (a high con- centration of phytoplankton) (MacIsaac et al., 1985). It might be expected that overall productivity along any eastern boundary coast would be correlated with the strength of the alongcoast wind stress at a given location. In the CCS, this relationship does not hold: seasonally averaged coastal chlorophyll concentra- tions increase fivefold from northern California to southern Vancouver Island, counter to the magnitude of the
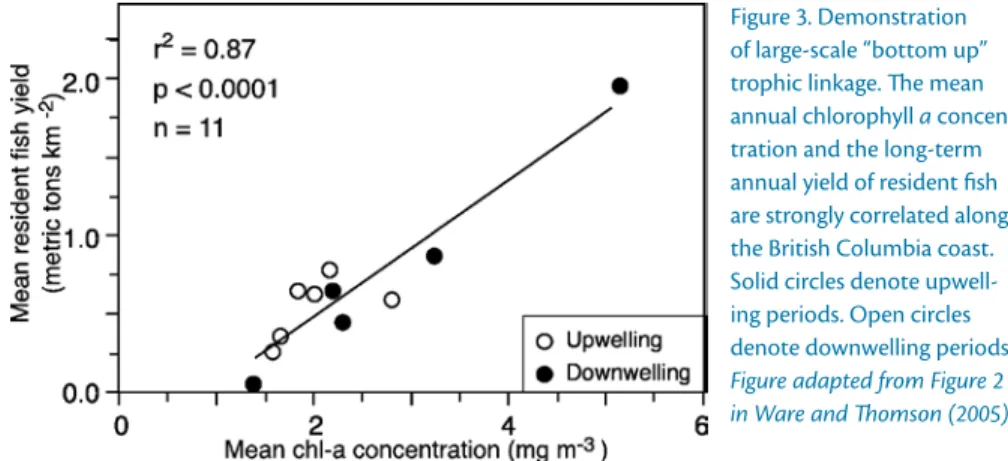
alongshelf wind stress, which decreases by a factor of eight over this region (Figure 2; see also Hickey and Banas, 2003; Ware and Thomson, 2005). High chlorophyll concentrations in the north- ern CCS are reflected in higher trophic levels, such as zooplankton biomass and fish stocks (“bottom-up control”), in the Washington/British Columbia region (Ware and Thomson, 2005; Figure 3).
One important oceanic difference among regions in the CCS is the degree of influence of freshwater (i.e., water
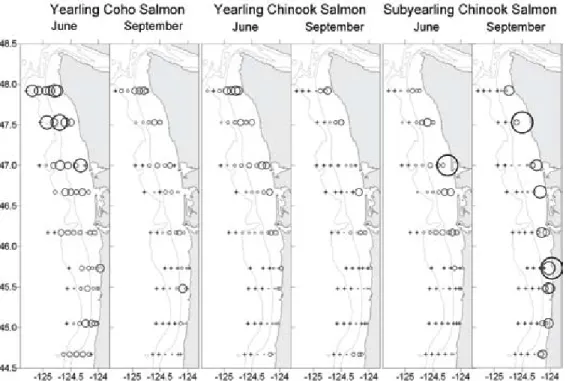
input by rivers and estuaries and ener- getic tidal currents associated with these features; Figure 1). These freshwater sources affect stratification, light, circula- tion, nutrient supply, and phytoplankton retention in coastal waters. Juvenile salmon are generally more highly con- centrated in regions affected by river plumes (Figure 4). The distribution of the annual return of bird colonies to sites along the Washington coast sug- gests that birds may find areas most influenced by freshwater most attractive.
Near the Juan de Fuca Strait, as well as farther south near the plume from the Columbia River, colonies returned in most years studied (80–100% colony return; Figure 5). This paper explores the potential causes of the large-scale alongcoast chlorophyll gradient in the CCS in light of two recent observational programs that studied the regions most influenced by freshwater: River Influences on Shelf Ecosystems (RISE, a Coastal Ocean Processes [CoOP]
project) focused on the Columbia River;
and Ecology and Oceanography of Harmful Algal Blooms Pacific Northwest (ECOHAB PNW) focused on the Strait of Juan de Fuca effluent.
Barbara M. Hickey ([email protected]) is Professor, School of Oceanography, University of Washington, Seattle, WA, USA. Neil S. Banas is Oceanographer, Applied Physics Laboratory, University of Washington, Seattle, WA, USA.
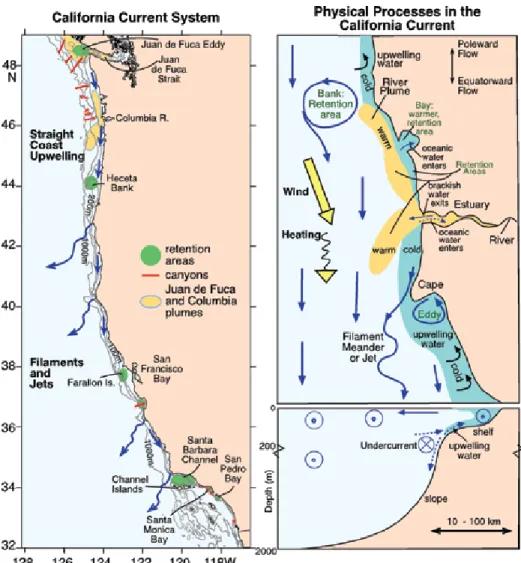
figure 1. Primary physical processes in the California Current System (CCS) in summer.
(left) a map of the CCS with bottom topography and typical surface currents (blue arrows), show- ing the location of submarine canyons (red), regions with longer than average residence times (green, “retention areas”), and primary sources of freshwater (yellow, the Strait of Juan de fuca and the Columbia river). The Columbia river plume is depicted in the bi-directional pattern frequently seen in the summer season. regions where upwelling is primarily two dimensional (“straight coast upwelling”) are differentiated from those farther south that are more three dimensional (“filaments and jets”). (right) a cartoon show- ing typical circulation patterns for an arbitrary subregion of the CCS in plan view (upper) and cross section (lower). in the cross section, circles with dots indicate equatorward flow; circles with crosses indicate poleward flow. retention areas over banks, behind capes, and within bays and estuaries are noted in green text. Upwelling water next to the coast is shown as darker blue.
Note that river plumes are generally warmer than coastal waters in summer.
tHE CCS aNd lOCal WiNd- driVEN UPWElliNg
The California Current is a ~ 1000-km- wide, sluggish current that forms the eastern limb of the North Pacific gyre, spanning the Pacific coast from
~ 20°N to ~ 50°N (Hickey, 1979, 1998).
Superimposed on that mean flow, nar- rower equatorward jets induced by the equatorward alongshelf wind stress develop seasonally on the shelf, spread- ing seaward over the shelf and slope as the season progresses (Strub and James, 2000). Isopycnals begin to tilt upward toward the coast following the “spring transition” (Huyer et al., 1979; Huyer, 1983; Strub and James, 1988), resulting in the upward movement of deeper, nutrient-rich water, and this upward movement continues throughout the season (Hickey et al., 2006) (Figure 1).
Thus, nutrients, which have higher con- centrations deeper in the water column, are lifted to upper layers of the continen- tal shelf where they can be used by phy- toplankton. Recent measurements show that in addition to vertical movement of nutrients due to upwelling, vertical mixing can enhance nitrate flux into the euphotic zone by as much as 25%
(Hales et al., 2005). A poleward under- current (the “California Undercurrent”) develops over the continental slope as upwelling continues (Figure 1, lower right panel). The development of the undercurrent is important in that once it is present, flow in the bottom boundary layer (~10 m from the bottom) changes from onshore (in which it can provide nutrient-rich water to the shelf) to off- shore (in which it can remove nutrient- depleted water from the shelf).
These seasonal patterns are inter- rupted or their amplitudes modified at
intervals of 2–20 d when the wind along the shelf reverses direction (Hickey, 1998; Barth et al., 2007). The frequency of interruption changes significantly along the coast, from almost no inter- ruptions (i.e., steady equatorward winds)
figure 2. Seasonal and interannual variation of coastal chlorophyll concentration versus latitude in the CCS. data were derived from several years of SeaWifS satellite data and averaged from the coastline seaward to 100 km. This averaging distance captures the majority of seasonal chlorophyll variability (Henson and Thomas, 2007). The figure depicts the strong latitudinal gradients that are the focus of this paper: higher chlorophyll concentrations are observed in the northern CCS. Contours are 0.25 (dark blue), 0.5, 1.0, 2.0, 3.0, and 5.0 (red) mg chl m-3. Maximum chlorophyll is located well north of the Columbia river entrance, and the Strait of Juan de fuca has a low particulate load, so that coastal particulates are not expected to have significantly biased these patterns. The patterns as well as magnitudes in the northern CCS (3–6 mg m-3) are consistent with extensive historical in situ chlorophyll measurements (landry et al., 1989). Figure courtesy of Andrew Thomas, University of Maine; see also Legaard and Thomas, 2006
off California to frequent interruptions off Washington (Figure 6d, showing the percentage of days with equatorward winds as a function of latitude). The seasonal coastal jet over the middle and outer shelf and upper slope rarely
figure 3. demonstration of large-scale “bottom up”
trophic linkage. The mean annual chlorophyll a concen- tration and the long-term annual yield of resident fish are strongly correlated along the British Columbia coast.
Solid circles denote upwell- ing periods. Open circles denote downwelling periods.
Figure adapted from Figure 2 in Ware and Thomson (2005)
figure 5. Patterns of colony stability for the Common Murre along the northern Washington coast (data are from the region between the black arrows), plotted on a satellite-derived image of sea surface temperature for July 4, 2007. The freshwa- ter plume from the Strait of Juan de fuca is seen as a cold feature emanating from the Strait; the plume from the Columbia river is seen as a warm feature all along the Washington/Oregon coast.
The Columbia river plume on this date extends much farther along the coast than is typical for this month. The highest percent of colony occupa- tion occurs near or at the two ends of the region sampled, suggesting a relationship between colony stability and location of freshwater plumes. Satellite aVHrr data are from the NOaa Coastwatch program. Unpublished bird colony data courtesy of Julia Parrish and the US Fish and Wildlife Service, Washington Outer Coast Refuge
figure 4. average number of juvenile salmon per km towed during seasonal cruises over a six-year period. The fish were using a 100-m-long NOrdiC 246 rope trawl with a 20 m x 30 m mouth opening. The size of the circles is proportional to the number of fish caught per km towed. The largest circle indicates >26 fish per km; the + sign indicates that no fish were caught in the tow. The illustration indicates that most young salmon prefer more northern habitat; in particular, they prefer the region north of the Columbia river entrance (just north of 46°N), a region frequently occupied by the Columbia plume in spring and early summer. fall Chinook are an exception. Figure cour- tesy of Bill Peterson and Ed Casillas; data in part from Fisher et al. (2007)
��� ���
��� ���
�
�
�
�
� �
��
�
�
�
�
�
�
�
�
�
� �
��
�
�
�
�
�
�
�
�
�
� �
��
�
�
�
�
�
�
�
�
�
� �
��
�
�
�
�
�
reverses direction from equatorward to poleward during the upwelling season (Huyer et al., 1979; MacFadyen et al., 2008), although its amplitude is modi- fied by local wind dynamics. The jet is controlled by pressure differences due to sloping isopycnals and sea surface height, and the Coriolis force (Earth’s rotational tendency). In contrast, currents on the inner shelf (~ 30 m bottom depth or less), which are controlled by surface and bot- tom friction, reverse from equatorward to poleward a few hours after the wind reverses. In the northern reaches of the CCS, much of the variability in alongshelf currents over the middle and outer shelf is a result of propagating disturbances
generated by winds south of a given loca- tion (Battisti and Hickey, 1984). Near the sea surface and near the seafloor at all locations across the shelf and slope, fric- tion is also important. Surface frictional currents change direction from onshore to offshore when winds change from poleward (“downwelling-favorable”) to equatorward (“upwelling-favorable”).
If winds blow equatorward along a straight coastline, at equilibrium, the depth at the source and the amount of upwelled water should be roughly proportional to the strength and dura- tion of the winds divided by the Coriolis parameter (two times Earth’s rotation rate times the sine of the latitude) and
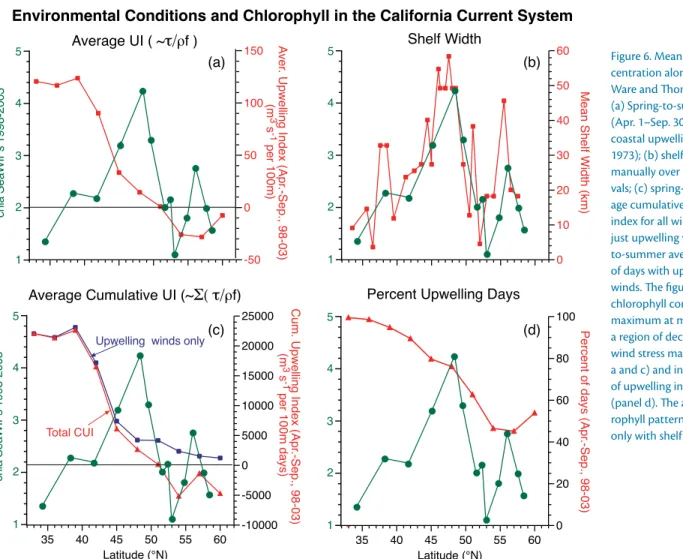
density (Hill et al., 1998). As mentioned above, alongshelf winds are not con- stant along the coast: maximum wind stress magnitude occurs off northern California and the alongcoast differ- ence between Washington (~ 48°N) and northern California (~ 42°N) is about a factor of eight (Figure 6a). The factor of eight might possibly be mitigated in northern latitudes by the duration of upwelling winds if those winds were more persistent. But in spring off the Washington coast, upwelling winds typi- cally occur only one-half to two-thirds of the time, and actual downwelling winds also occur (Figure 6d).
figure 6. Mean chlorophyll con- centration along the coast (from Ware and Thomson, 2005) and (a) Spring-to-summer average (apr. 1–Sep. 30, over 1998–2003) coastal upwelling index (Bakun, 1973); (b) shelf width averaged manually over one-degree inter- vals; (c) spring-to-summer aver- age cumulative coastal upwelling index for all winds (CUi) and for just upwelling winds; and spring- to-summer average percentage of days with upwelling-favorable winds. The figure shows that chlorophyll concentration is a maximum at mid latitudes, in a region of declining upwelling wind stress magnitude (panels a and c) and increasing degree of upwelling intermittency (panel d). The alongcoast chlo- rophyll pattern is well correlated only with shelf width (panel b).
iS Nitr atE SUPPly fOr PriMary PrOdUCtiVity SiMilar OVEr tHE CCS?
In spite of these alongcoast differences in wind forcing, nitrate supplied to the sea surface is indeed similar over the CCS from California to Vancouver Island. (In the CCS, nitrate, silicate, and phosphate have very similar spatial and temporal seasonal patterns as shown in Figures 1.14–1.22 in Landry et al.
[1989]. We use “nutrients” to describe the macronutrients nitrate, nitrite, sili- cate, and phosphate; we use “nitrate” to describe nitrate and nitrite together.) Values of 20–25 µM nitrate are typi- cally reported in waters upwelled to the surface over the inner shelf by early summer (see MacFadyen et al., 2008, for Washington/Vancouver Island values;
see Huyer et al., 2005, for central Oregon and northern California). Minimum temperatures of shelf bottom water over this latitudinal range are essentially iden- tical as well (Geier et al., 2006).
HOW iS Nitr atE SUPPly aBlE tO OVErCOME a faCtOr Of EigHt diffErENCE iN WiNd StrESS OVEr tHE CCS?
remote Wind forcing
Seasonal changes in water properties can propagate poleward from the region where winds caused the disturbance (“remote wind forcing”) as a baroclinic (density-related) wave (McCreary et al., 1987). In support of this model-generated idea, observational studies have attrib- uted the spring transition in part to remote wind forcing (Strub et al., 1987;
Hickey et al., 2006). Analyses of seasonal changes in the northern CCS in 2005 provide convincing evidence that remote wind forcing continues to be important
for large-scale upwelling of water proper- ties in the northern CCS throughout the upwelling season (Hickey et al., 2006;
Pierce et al., 2006).
Still, these analyses provide, at most, a partial answer to the question. Although remote wind forcing might be sufficient to ensure that the source depth of water that upwells to the northern shelves is similar to that in regions with stronger and more persistent local wind forcing, this mechanism does not necessarily result in delivery of the deeper water and associated nutrients to the euphotic zone where the nutrients can be used by the phytoplankton. Figure 6d shows that local upwelling winds are intermittent at northern latitudes and thus isopy- cnals are upwelled to the surface near the coast only intermittently. Also, the
presence of large amounts of freshwater increases stratification at northern lati- tudes much of the time, further inhibit- ing upwelling (Hickey et al., 2005).
Fortuitously, the northern CCS has other mechanisms, such as estuarine and tidal dynamics, that help move nutrients to the euphotic zone.
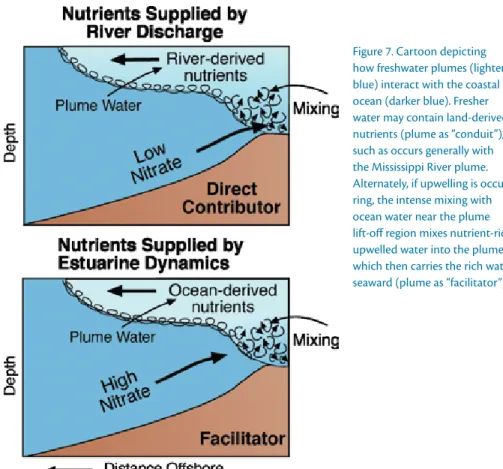
Major estuaries and associated river plumes in the CCS occur in its northern end (Figure 1). River plumes can alter nutrient supply as a conduit of land- derived nutrients from watersheds to the ocean, like the Mississippi River.
Alternately, they can act as a facilitator, entraining coastal upwelling-derived nutrients into the euphotic layer and distributing them out over the con- tinental shelf or slope in the plume (Figure 7). The northern CCS has two
figure 7. Cartoon depicting how freshwater plumes (lighter blue) interact with the coastal ocean (darker blue). fresher water may contain land-derived nutrients (plume as “conduit”), such as occurs generally with the Mississippi river plume.
alternately, if upwelling is occur- ring, the intense mixing with ocean water near the plume lift-off region mixes nutrient-rich upwelled water into the plume, which then carries the rich water seaward (plume as “facilitator”).
massive freshwater sources: the effluent from the Strait of Juan de Fuca, whose freshwater originates in the Fraser River and the rivers of Puget Sound, and the Columbia River, the second largest river in the continental United States. The Columbia outflow is half an order of magnitude smaller than the outflow from the Strait of Juan de Fuca (1.4 x 10⁴ m3 s-1 vs. 105 m3 s-1; Hickey et al., 1991, 2008).
However, the salinity deficit of the freshwater transferred to the coastal ocean is much larger than that of the strait (~ 10–20 vs. 31.5 practical salinity units [psu]; Hickey et al., 2005, 2008);
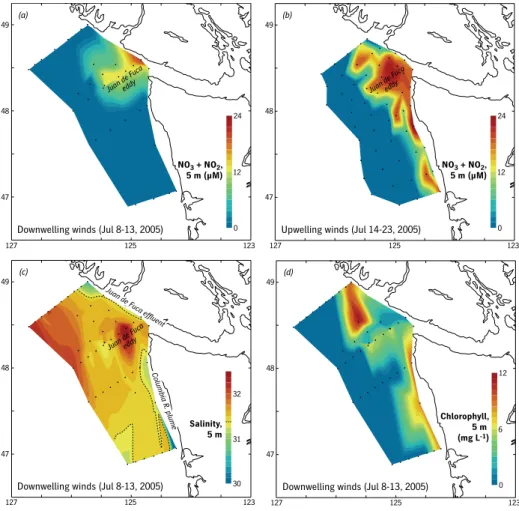
thus, effects of the Columbia River on local stratification and circulation (but not necessarily on macronutrients) can exceed those of the strait. During the delayed spring transition of 2005, rela- tively high values of chlorophyll were observed in the vicinity of both these freshwater features, in contrast to other regions (Figure 8d).
the Juan de fuca Strait Outflow Nutrients exiting the Juan de Fuca Strait are essentially all derived from the same water source that is upwelled in the rest of the CCS (Mackas et al., 1980). The water is drawn up the Juan de Fuca canyon and enters the strait to compensate for the loss of mass of the outflowing water, because the strait is an estuary. This nutrient-rich water is subsequently entrained into outflowing strait water and thus provides a mas- sive, relatively steady nutrient source to the northern CCS (Mackas et al., 1980;
Denman et al., 1981; MacFadyen et al., 2008). The difference between nitrate supplied by straight-coast, wind-driven upwelling and by the Juan de Fuca Strait can be seen by comparing surface
nitrate during a period of downwelling and subsequent upwelling (Figures 8a and 8b). Nitrate continues to emerge from the strait but is absent along the coast during the period of downwelling winds (see also MacFadyen et al., 2008).
The Juan de Fuca region has three other
unique advantages as a nutrient source over regions supplied by upwelling along a straight coastline. First, its strong cur- rents transport nutrients offshore at least four times farther than water upwelled at the coast (~ 60 km vs. 15 km offshore).
Second, it retains them locally due to the
figure 8. Upper panels compare contoured maps of nitrate plus nitrite during downwelling-favorable (a) and subsequent upwelling-favorable (b) winds along the southern Vancouver island/Washington coast at a depth of 5 m. Station locations are indicated with black dots and no smoothing has been done. The con- trast between the nitrate supply along the open coast, which disappears during periods of downwelling winds, and in the Juan de fuca region, where supply is governed by estuarine/strait dynamics, is shown explicitly. in addition to a more persistent nutrient supply, the nutrients are transported offshore by the strait effluent and the offshore Juan de fuca eddy, a distance several times greater than by wind-driven transport in the coastal upwelling zone. lower panels compare 5-m salinity (c) and chlorophyll a (d) dur- ing a period of downwelling in early July 2005. Chlorophyll concentration is elevated in the two regions most influenced by freshwater (dark blue areas, offshore of the strait and in the Columbia river plume) even though winds were downwelling-favorable. Nitrate concentration remained high offshore of the strait as shown in figure 8a. This was the period of delayed upwelling when chlorophyll, primary produc- tivity (kudela et al., 2006), and other marine populations (e.g., Mackas et al., 2006; Newell and Cowles, 2006) failed in some regions. Unpublished nitrate and chlorophyll-a data from Bill Cochlan, San Francisco State University, ECOHAB PNW program. See MacFadyen et al. (2008) for more details.
Juan de Fuca eddy (Figures 1 and 8), a major topographic feature in this area (see later discussion of retention). These physical advantages are enhanced by diminished utilization by phytoplank- ton as water emerges from the strait (MacFadyen et al., 2008). The source waters for phytoplankton in the strait are always deep (100–200 m) so that plank- ton density is low, in contrast to phy- toplankton upwelled close to the coast on the wide, highly retentive northern shelves. While transiting the strait, phy- toplankton are light limited due to vigor- ous vertical mixing, so that growth is minimal. Thus, several days are required to initiate blooms that significantly draw down nutrients. The third advantage is that because the outflow from the strait occurs over the upper 100 m (Hickey et al., 1991), high nutrient concentra- tions (nitrate > 25 µM; MacFadyen et al., 2008) are provided much deeper in the water column than occurs with the ~ 10–20-m-thick offshore surface Ekman layer produced by wind-driven upwelling. Local usage of these nutrients usually depletes the upper 10 m of the water column. However, the remainder
of the water column is exported equa- torward to Washington and Oregon in the coastal jet, providing a rich source of nutrients to the ecosystems of those shelves.
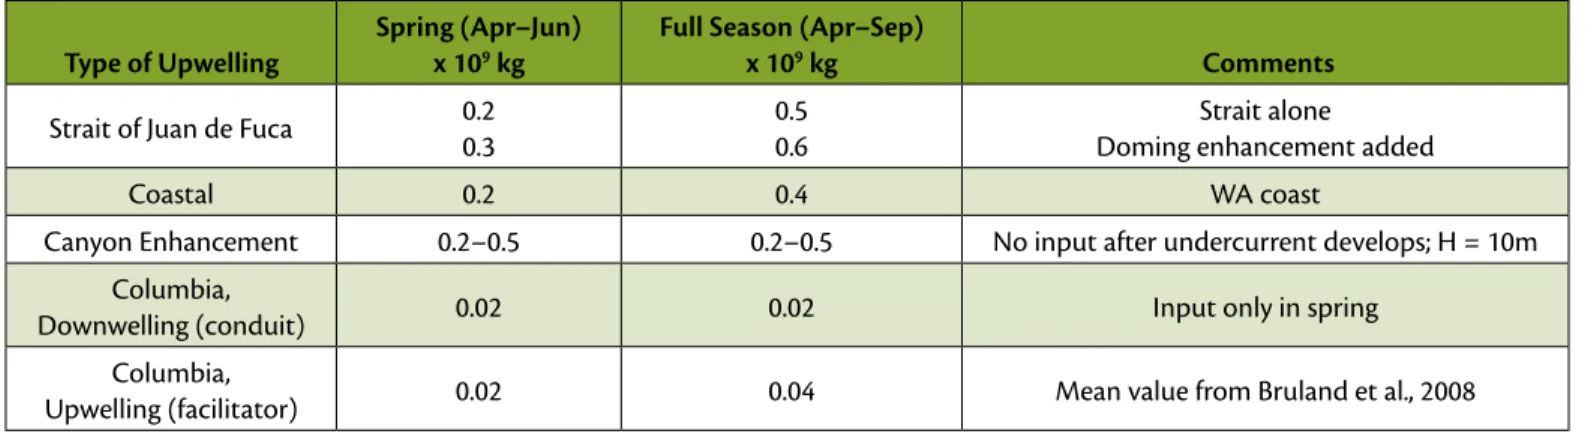
To obtain an order of magnitude seasonal estimate of nitrate input by the Strait of Juan de Fuca, we used a flux of 50 kg nitrate s-1 (Mackas et al.,1980).
The flux was multiplied by the appro- priate number of days in the April to June period (spring) and for the full April through September upwelling season (upper value in Table 1). As the season progresses, doming beneath the Juan de Fuca eddy is itself a source of upwelling to the base of the pycnocline (MacFadyen et al., 2008). To include that effect, estimates were increased by 25%, using the estimates of cross-isopycnal nitrate flux derived from microstructure measurements off Oregon (Hales et al., 2005) (lower value in Table 1).
For comparison, we estimated nitrate contributed by upwelling due to local winds along the Washington coast by assuming a two-dimensional balance such that the wind-driven offshore flux in the surface layer is balanced by an
onshore upwelling flux (as in Denman et al., 1981). A cumulative upwelling index was used to compute the mass input over spring alone and over the full season (as seen in Figure 6). Following Hickey et al. (2006), only upwelling- favorable wind stress values were included because wind reversals do not appear to reverse currents in the bottom boundary layer over the middle and outer shelf. The upwelling distance used was the entire coast from the Columbia River to the Strait of Juan de Fuca. For a conservative estimate, the upwelling nitrate concentration was assumed to be 30 µM (see nitrate time series in Hickey et al., 2006).
Results show that in spring, nitrate supplied by outflow from the ~ 20-km- wide Strait of Juan de Fuca contributes roughly the same (or more) nitrate to the 220-km-long southern Vancouver Island/Washington shelf as local coastal upwelling, a doubling of available nitrate.
The significance of nitrate output by the strait is consistent with Crawford and Dewey (1989), who showed that the strait was the dominant source of nutrients for the Vancouver Island coast.
table 1. Order of magnitude estimates of nitrate input to the southern Vancouver island/Washington shelf by a variety of sources.
Type of Upwelling Spring (Apr–Jun)
x 109 kg Full Season (Apr–Sep)
x 109 kg Comments
Strait of Juan de fuca 0.2 0.3
0.5 0.6
Strait alone doming enhancement added
Coastal 0.2 0.4 Wa coast
Canyon Enhancement 0.2–0.5 0.2–0.5 No input after undercurrent develops; H = 10m
Columbia,
downwelling (conduit) 0.02 0.02 input only in spring
Columbia,
Upwelling (facilitator) 0.02 0.04 Mean value from Bruland et al., 2008
Nitrate provided by the strait is thus sub- stantial, and would allow phytoplankton to continue blooming when nitrate is depleted in regions without this alternate nitrate source, as occurs during periods of persistent downwelling winds such as in spring 2005.
the Columbia river Plume The Columbia River plume was histori- cally reported to be oriented southwest of the river mouth in summer (Barnes et al., 1972). However, recent work shows that the plume is present more than 50% of the time north of the river mouth, and frequently has branches both north and south of the river mouth at the same time in summer (Figure 1) (Garcia-Berdeal et al., 2002; Hickey et al., 2005, 2008). The plume from the Columbia River can be both a nutrient conduit and a facilitator (Figure 7). Most nutrients derived from local watersheds are used inside the Columbia River estu- ary in the summer growing season and are not exported out to the continental shelf (Conomos et al., 1972). However, in spring and early summer during periods of high rainfall, moderate concentrations of nitrate (~ 5–18 µM) can be supplied directly to the coastal ocean (Bruland et al., 2008). This nutrient supply may help sustain local ecosystems during periods of weak or no upwelling, or late transitions to spring conditions, as occurred in 2005 (Figure 8d).
Significant entrainment of shelf water occurs where the plume separates from the bottom (the plume “lift off” region) and exits the river mouth, and also occurs just inside the estuary (Figure 7) (McCabe et al., 2008; Bruland et al., 2008). If upwelling has been occur- ring on the nearby shelf, the nutrient-
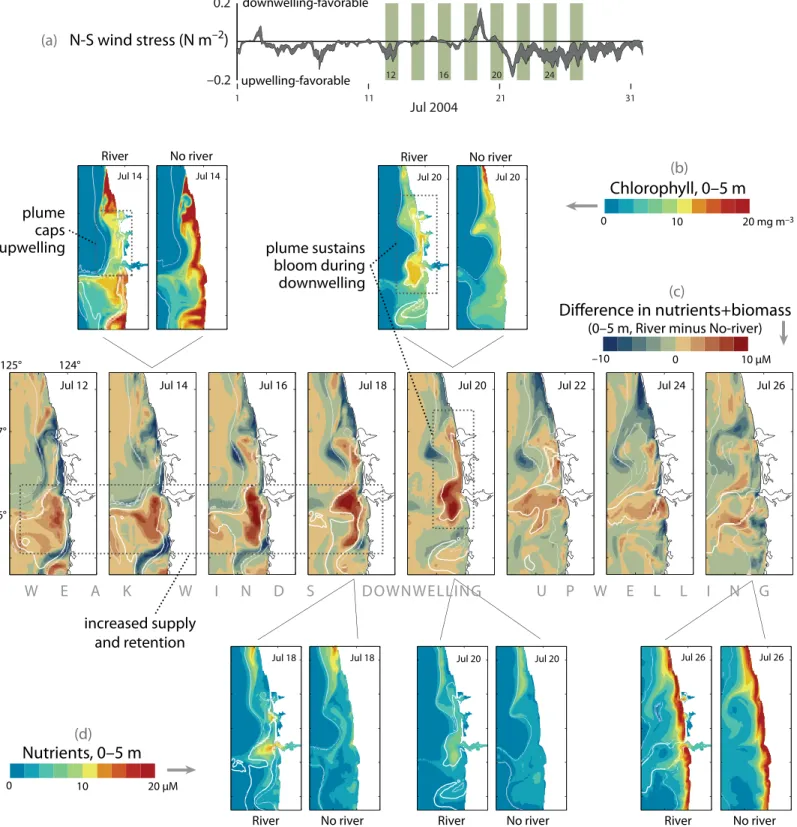
rich upwelled shelf water is mixed or entrained into the outflowing Columbia River water, similar to the process that entrains much deeper nutrients into Juan de Fuca Strait. Model results (Banas et al., in review; MacCready et al., 2008) suggest that the amount of nitrate mixed into the coastal water exceeds that which would be upwelled by wind-driven upwelling along a coast without a plume or an estuary. This result is captured in a plot showing the difference in total nutrients (biomass plus nitrate) as well as nitrate and chlorophyll maps on selected dates between two model runs, one with, and one without the Columbia River estuary and its plume (Figure 9).
During a period of weak or intermittent upwelling (July 12–18), nitrate is much higher near the river mouth when the riverflow and estuary are included in the model (Figure 9d); total nitrate shows a ~10 µM increase in the plume area throughout this period. The enhanced nitrate supply is due to a combination of freshwater and tidal dynamics; note the smaller, corresponding positive anomaly in nitrate at the mouth of the estuary just north of the Columbia estu- ary (Figure 9d, July 18), which has strong tides but negligible summer river input (set to zero in the model).
During the modeled downwelling event July 18–20 (Figure 9a), the excess plume-facilitated nitrate supports a phytoplankton bloom near the Columbia mouth and along the Washington coast (Figure 9b, July 20), whereas in the no-river case, nitrate and biomass both decline quickly during downwelling (Figures 9b and 9d, July 20). These plume effects are strongest under weak- to-moderate upwelling; during periods of strong, sustained upwelling-favorable
winds (July 21–26), the plume is blown offshore and southwest, and nitrate supply varies little between model cases (Figure 9d, July 26).
The presence of a river plume over a shelf does not always increase local nitrate or total nutrient supply. The increased stratification can impede upwelling of new nitrate from deeper layers (Hickey et al., 2005), as shown in model runs. During weak, variable upwelling (July 12–17), the plume partially caps nutrient supply and reduces primary production along the Washington coast in comparison with the no-river case, causing a deficit in biomass (Figure 9b, July 14) and total nitrogen (Figure 9c).
For comparison with other sources in Table 1, seasonal nitrate input by the Columbia River plume was estimated both for downwelling-favorable winds, in which entrainment into the plume was ignored but watershed-derived nitrate exiting the estuary was counted, and for upwelling-favorable winds, in which riverine nitrate was assumed to be zero but the nitrate from upwelled water on the shelf is mixed or entrained into the outward moving plume near its lift off location. Ranges for nitrate obtained on RISE cruises were taken from Bruland et al. (2008): 5–18 µM in river water during downwelling periods and ~ 20 µM in plume water during upwelling periods. Values were mul- tiplied by the typical spring riverflow (~ 104 m3 s−1) and by the number of days of downwelling or upwelling, respec- tively. Because river input of nitrate only occurs under substantial storms, we assumed that no direct river contribu- tion occurs after June.
Perhaps surprisingly, nitrate supply
Jul 12 Jul 14 Jul 16 Jul 18 Jul 20 Jul 22 Jul 24 Jul 26
46°
47°
124°
125° –10 0 10 µM
Difference in nutrients+biomass
(0–5 m, River minus No-river)
0 10 20 µM
Nutrients, 0–5 m
0 10 20 mg m–3
Chlorophyll, 0–5 m N-S wind stress (N m–2)
0.2
–0.2
Jul 2004
1 11 21 31
12 16 20 24
River No river River No river
Jul 14 Jul 14 Jul 20 Jul 20
River No river River No river River No river
Jul 18 Jul 18 Jul 20 Jul 20 Jul 26 Jul 26
(a)
(b)
(c)
(d)
downwelling-favorable
upwelling-favorable
plume
upwellingcaps plume sustains
bloom during downwelling
increased supply and retention
W E A K W I N D S DOWNWELLING U P W E L L I N G
figure 9. timeline of nutrients and biomass in the surface layer (0–5-m average) from July 2004, from an ecosystem model case (see Banas et al., in review;
MacCready et al., 2008) with the Columbia river plume included (“river”), and a “No-river” case in which riverflow = 0 and the Columbia river estuary and Washington small bays are replaced with an unbroken coastline. river nitrate is set to zero. Each snapshot is a 25-h tidal average. Contours of salinity are shown in white (thicker, 30 practical salinity units [psu]; thinner, 31.5 psu) to mark the location of the plume. North-south wind stress is given in (a). The main timeline (c) shows the difference between model cases in nutrients + biomass (both in nitrogen units); snapshots of chlorophyll (b) and nutrients (d) are also shown to highlight key features. during weak, variable upwelling (July 12–17), the plume partially caps nutrient supply and primary production along the Washington coast, causing a deficit in biomass (b, July 14). at the same time, however, the plume also causes increased supply and retention of nutrients in the plume south of the river mouth during this period (c, July 12–18; d, July 18). during the downwelling event July 18–20 (a), the excess plume-derived nutrients support a phytoplankton bloom near the Columbia mouth and along the Washington coast (b, July 20), whereas in the no-river case, nutrients and biomass both decline quickly during downwelling (b, d, July 20). These plume effects are strongest under weak-to-moderate upwelling: during strong, sustained upwelling (July 21–26), the plume is blown offshore and the nutrient supply varies little between model cases (d, July 26).
by the Columbia River and its plume, both as a conduit from the river itself and as a facilitator of upwelling-supplied nitrate, is an order of magnitude smaller than that from all other sources (Table 1) for the region as a whole. If we restrict our attention to the river mouth, the nitrate supplied by mixing of upwelled water into the plume at lift off (Bruland et al., 2008) suggests a half order of magnitude enhancement over straight coast upwelling (2.5 vs. 0.5 kg s-1, for a Columbia River mouth width of 4 km).
This estimated enhancement is also con- sistent with patterns shown in Figure 9.
The small overall contribution of the Columbia River in comparison with, for example, the Strait of Juan de Fuca, is due primarily to the small river and plume volumes, in comparison to the other sources. Still, despite the relatively small contributions on a seasonal basis, the Columbia River can be important as a local source during periods of down- welling or weak upwelling winds.
Iron is vital for phytoplankton blooms in an upwelling system, and iron supply may contribute to productivity differ- ences along the CCS (Chase et al., 2005).
Recent measurements indicate that even off the Oregon coast, phytoplankton growth is not iron limited (Chase et al., 2005), although iron can be a limiting nutrient off California (Hutchins and Bruland, 1998). RISE studies show that iron is never limiting on the Washington coast (Bruland et al., 2008). Not only is the plume from the Columbia River heavily laden with iron, but iron from the Columbia plume is also deposited in sediment along both the Washington and Oregon coasts. The iron-laden sediment can be mixed into bottom water and thus added to the already nitrate-rich water.
Submarine Canyons
Like river plumes, submarine canyons are not distributed uniformly over the CCS—the majority of canyons occur in the northern CCS (Figure 1). Upwelling is enhanced on the southern sides of these canyons (Allen, 1996; Hickey, 1997; She and Klinck, 2000), forced by the cross-shelf pressure gradient asso- ciated with the equatorward flowing coastal jet. This enhancement would not be expected once the poleward under- current sets up seasonally. Although the water originating in canyons does not break the sea surface locally, this upwelled water moves onshore in the bottom boundary layer over the shelf as it moves equatorward in the shelf jet (Crawford and Dewey, 1989). This water reaches the coast at some location south of a particular canyon, where it would require local wind forcing to upwell it into the euphotic zone.
We estimated the seasonal contribu- tion by submarine canyons to nitrate over the shelf bottom using results in Hickey (1997) to scale the thickness (~10 m), temperature (7–7.5°C), and velocity (~ 10 cm s-1) of the upwelling layer. Temperature was converted to nitrate (~ 35 µM in this temperature range) using a relationship obtained from multiple ECOHAB PNW and RISE cruises (r2 = 0.8). The length of the downstream (equatorward) side of each canyon was measured manually. To pro- vide a range of possible input, estimates were made for two coastline intervals:
all canyons between 46°N and 50°N, and canyons south of Juan de Fuca canyon only (Juan de Fuca canyon is open ended and thus has unique canyon dynamics).
Input was estimated to occur only from April to June, before the poleward
undercurrent develops, and only during upwelling periods, because the currents that impinge on the canyon at canyon depth may reverse to poleward during downwelling events (Hickey, 1997).
Therefore, resulting values were multi- plied by the average number of days of upwelling in each month.
Results suggest that in spring, nitrate supplied to the shelf bottom due to upwelling enhancement by canyons is roughly the same as (or more than) the amount that local coastal upwell- ing supplies to the southern Vancouver Island/Washington shelf (Table 1).
The canyon enhancement is also com- parable to the nutrient supply by the Strait of Juan de Fuca.
iS rEtENtiON/
CONCENtr atiON Of
PHytOPlaNktON a MaJOr faCtOr iN ExPlaiNiNg alONgCOaSt PrOdUCtiVity StrUCtUrE?
The preceding discussions demonstrate that the northern CCS has delivery methods to the euphotic zone that ensure nutrient concentrations required for primary production at levels similar to other areas in the northern CCS.
But chlorophyll concentrations at the sea surface are about five times higher in the northern CCS than off northern California (Figure 2). This observation suggests that retention of phytoplankton blooms plays an important role in pro- ducing alongcoast chlorophyll patterns.
Indeed, the northern CCS is endowed with a massive eddy persistently sup- plied with nutrients, retentive river plume fronts, a coastline with no major promontories such as cause offshore jets and meanders farther south in the CCS
(Strub et al., 1991; Barth and Smith, 1996), and wide shelves (see Figure 1).
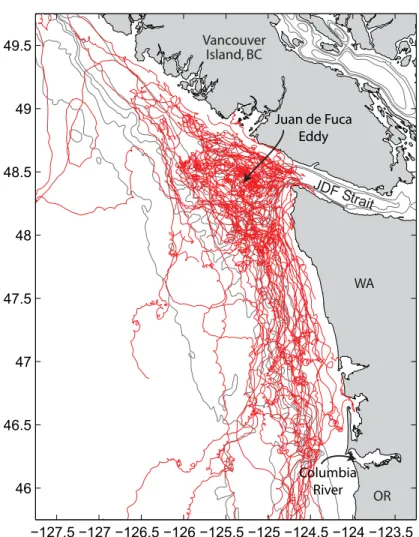
Surface drifters deployed in summer in the high-chlorophyll northern end of the CCS under a variety of wind condi- tions (Figure 10) demonstrate that the Washington shelf is indeed extremely retentive to surface water movement.
There is little evidence of offshore move- ment in surface Ekman layers during periods of upwelling-favorable winds;
drifter pathways, once free of the Juan de Fuca eddy at the northern end, are controlled primarily by the baroclinic coastal jet. In this region, fronts from the Columbia River are common (Hickey
et al., 2005), and these fronts are gener- ally oriented along the shelf. In general, water is retained on the Washington shelf for at least 10 days under mod- erate upwelling wind conditions (MacFadyen et al., 2008).
Retention is particularly long (up to 32 days have been observed) just offshore of the Strait of Juan de Fuca, in the Juan de Fuca eddy (Figure 10; Freeland and Denman, 1982; MacFadyen et al., 2005, 2008; Foreman et al., 2008). Although bloom concentration is important, we note that bloom maintenance during retention is perhaps more important—
blooms require an ongoing source of nutrients in order to maintain high chlo- rophyll concentrations. The Juan de Fuca eddy region has an almost steady supply of nutrients, as noted previously. Escape from the eddy occurs primarily under upwelling-favorable wind conditions; in the near surface frictional layer, the geo- strophic constraint is broken by friction- ally dominated currents. Filaments with high chlorophyll have been observed emanating from the eddy region equa- torward along the outer Washington shelf and slope along pathways like those shown in Figure 10 (MacFadyen et al., 2008; Trainer et al., in press). The Juan de Fuca eddy region likely provides much of the chlorophyll observed on the Washington shelf. Just below the surface layer, nutrients follow pressure surfaces, flowing generally equatorward in the shelf break jet whether winds are upwelling- or downwelling-favorable.
These waters provide a high-nutrient environment that can sustain subsurface phytoplankton blooms, features com- monly observed on the Washington shelf (Landry et al., 1989). They also are likely the source of waters upwelled along the
−127.5 −127 −126.5 −126 −125.5 −125 −124.5 −124 −123.5 46
46.5 47 47.5 48 48.5 49 49.5
Juan de Fuca Eddy Vancouver
Island, BC
WA
OR JDF Strait
Columbia River
figure 10. an illustration of particle retention on the southern Vancouver island/Washington coast. tracks of 68 surface drifters deployed in summer 2003–2006 during the ECOHaB PNW study. Most drifters were deployed in the Juan de fuca eddy, the region with dense tracks just offshore of the Strait of Juan de fuca. Contour intervals are 100, 150, 250, 500, 1000, and 2000 m.
drifters show little evidence of offshore transport in the surface frictional layer. transit time from the eddy to the Columbia mouth is about 10 days in moderate upwelling winds. few drifters leave the shelf; the few exceptions occur at the northwest end of the region under downwelling wind condi- tions, or at the south end of the region where drifters encountered the plume from the Columbia.
Washington/Oregon coasts in later parts of the upwelling season.
Heceta Bank, off central Oregon, is another retentive region in the northern CCS (Gan and Allen, 2005) where chlo- rophyll concentrations are relatively high (Landry et al., 1989; Spitz et al., 2005;
Henson and Thomas, 2007). Although Heceta Bank and the Juan de Fuca eddy region may have similar retentive prop- erties, Heceta Bank does not have the persistent strait-generated nutrient sup- ply of the more northern feature.
The Columbia River plume also plays a significant role in retention on the southern Washington/northern Oregon shelf. Drifter pathways become more convoluted at about the latitude of the Columbia River mouth, a result of eddies spun off from the recirculating region near the mouth and offshore- tending fronts due to the southwest Columbia plume that develops during periods of upwelling-favorable winds (Figure 10; Banas et al., 2008). Model results (Figure 9) show that the plume can concentrate both nitrate and bio- mass, thus retaining the total resource over the shelf in a localized area much longer than if no plume were pres- ent. This concentration effect occurs during periods when winds change intermittently from downwelling- to upwelling-favorable.
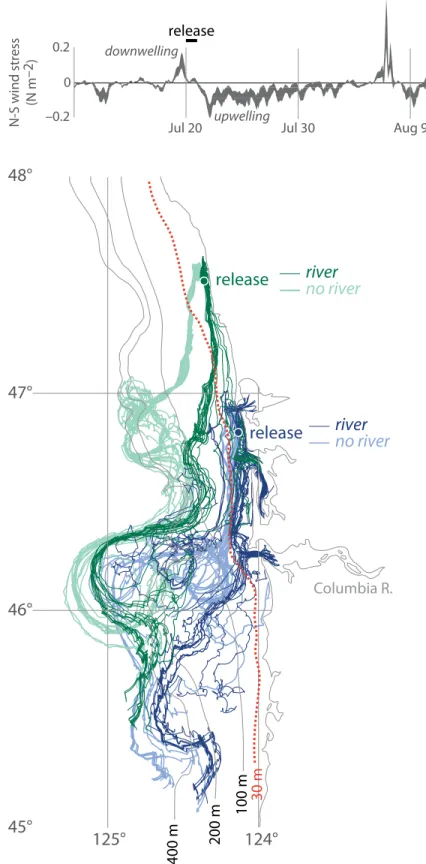
Comparison of modeled surface particle tracks with and without a river plume included shows that surface particles originating on the inner shelf can be episodically retained on the inner shelf in the presence of the Columbia plume (Figure 11). At other times in the upwelling-downwelling cycle, the plume appears to enhance cross-shelf export instead (Banas et al., 2008). Model
45°
46°
47°
48°
125° 124°
100 m200 m
400 m
release
release river no river
river no river
30 m
Columbia R.
Jul 20 upwelling Jul 30 downwelling
0.2 0 N-S wind stress –2(N m) –0.2
Aug 9 release
figure 11. an example of nearshore retention caused by a river plume. The fate of water found on the Washington inner shelf during the onset of a sustained upwelling event, July 20, 2004, shown for two model cases: a base case with the Columbia river included (darker lines) and a case in which the Columbia is turned off and the estuary replaced by unbroken coastline. Particles were released at two locations (47.5°N, 46.83°N) over 25 h on July 20 and tracked using surface velocity fields for 20 d. during this transition from downwelling to upwelling, particles are retained on the inner shelf (landward of the 30-m isobath, dotted red line) several days longer in the presence of the plume.
studies also suggest (Banas et al., 2008) that interactions between the plume and variable winds episodically retard the equatorward advection of biomass from the Washington shelf, so that the plume acts as a retention feature in an along- coast sense as well. Note that all these types of plume-driven retention occur in part as a result of wind intermittency: if the winds were upwelling-favorable only, we would expect the plume to result in excess offshelf transport to the south- west. Nevertheless, as downwelling- favorable winds occur over 30% of the time in this region in an average year (Figure 6d), inner shelf retention of phytoplankton, and resulting changes of patterns of microzooplankton, have important effects on the local ecosystem.
Last, we note that chlorophyll con- centration is strongly related to shelf width along the coast (Figure 6b). The width of the shelf decreases equatorward from ~ 60 km at more northern lati- tudes to ~ 10 km off much of California (Figure 6b). Data in Lentz (1992) and in Hickey (1989) show that wind-driven flow in the near surface layers is similar at most locations: ~ 0.1 m s-1. As winds blow harder, mixed layer depth increases (Lentz, 1992) and flow is distributed over a greater vertical distance. Thus, for the same wind stress along the coast, the residence time of material on the shelf should vary linearly roughly with shelf width. For a typical wind stress, surface residence time would be a week off the Washington coast, but one or two days off northern California in regions with a straight coastline; again, northern regions are favored for bloom retention.
OtHEr iSSUES affECtiNg alONgCOaSt CHlOrOPHyll CONCENtr atiONS
Shelf Shape and depth of Upwelled Water
In general, shelves are broader and flatter at northern latitudes (Figure 6b); note that width and steepness are strongly correlated by their geology. Allen et al.
(1995) show that the depth from which shelf water is derived during upwell- ing depends critically on bottom slope and the width of the shelf. Over steeper shelves (e.g., off California), much of the flow that compensates for the wind- driven offshore flow in the surface fric- tional layer (the “return flow”) originates from the central water column rather than from the bottom boundary layer.
Because nutrients increase with depth in the water column, water originating deeper in the water column would tend to have higher nutrient concentrations than that originating from shallower depths. We might therefore expect water upwelled in the compensating flow over broader, steeper shelves (such as occur off Washington and southern British Columbia) to originate deeper and thus to have higher nutrient concentration than upwelled water over narrower, steeper shelves (such as occur off much of Oregon and California). Although the Allen et al. (1995) modeling result described above suggests a mechanism to help explain the correlation between shelf width and chlorophyll seen in Figure 6b, the modeled cross-shelf cir- culation pattern is not supported by field observations. In particular, the majority of the return flow in upwelling regions occurs well above the bottom boundary layer independent of shelf morphology as shown by Smith (1981) for both the
CCS and the Peruvian upwelling systems.
Off the Washington shelf, the strongest return flow is typically observed at a depth of about 10–15 m (Hickey, 1989).
Bloom time Scales Versus Wind intermittency
Intermittency is a critical component of resulting biological patterns. Off central California, maximum phytoplankton productivity is observed when wind vari- ability matches phytoplankton bloom time scales, with three to seven days of relaxation being optimal and diatoms dominating the population (Wilkerson et al., 2006; Botsford et al., 2006). When winds are stronger, new production is less than the theoretical maximum, consistent with substantial export from the shelf as well as increased mixed layer depth and reduced light exposure (Dugdale et al., 2006). Stronger winds reduce transit time across the shelf to fewer than five days so that blooms cannot fully develop before they are exported offshelf and coastal waters are increasingly influenced by detritus (Kudela et al., 2006). Because the duration and strength of upwelling- favorable winds decreases poleward over the CCS (Figure 6d), wind time scales again are most optimal for growth in the northern CCS.
SUMMary aNd diSCUSSiON Chlorophyll concentration along the CCS is strongly correlated with shelf width (Figure 6b). If retentive banks are included in the wide shelf category, shelf width likely is more important overall than river plumes for retention in the northern CCS, and comparable in effect to the absence of large coastal promonto- ries. Yet no chlorophyll would collect on a wide shelf if the appropriate nutrients
were not available to fuel a bloom.
Thus, in addition to a wide shelf and no large capes, to attain high productivity, nutrients must be upwelled onto the northern CCS shelf in concentrations comparable to or exceeding those in the central and southern CCS. Moreover, those nutrients need to be injected into the euphotic zone to be used by the phytoplankton, and ultimately, to affect higher trophic levels.
The discussion presented in this arti- cle suggests that these two requirements are met by different processes in the northern and southern CCS. Upwelling of deep isopycnals occurs in all parts of the CCS to distances more than 100 km from the coast and depths greater than 200 m from the sea surface. In northern latitudes, this large-scale upwelling is likely forced at least in part by the winds off northern California, with the dis- turbance traveling poleward as a wave, and is enhanced by submarine canyon upwelling. Nutrients upwelled into bot- tom waters by these processes as well as by local wind upwelling are moved into surface layers by estuarine dynamics and enhanced tidal mixing near estuaries, each of which inputs nitrate at levels comparable to local coastal upwelling.
The Strait of Juan de Fuca and canyon upwelling provide nitrate at levels com- parable to or exceeding that of local wind-driven coastal upwelling, almost an order of magnitude greater than nitrate supplied by the Columbia River plume.
The nutrient supply from the strait is more persistent, extends farther offshore, and extends deeper in the water column than nutrients supplied by traditional coastal upwelling. However, during periods with significant downwelling, contributions from the Columbia River
supply sufficient nitrate to fuel the eco- system until upwelling conditions return.
Off northern and central California, where upwelling-favorable winds are strong and persistent, upwelling forced by local winds near the coastline brings the needed nutrients to the euphotic zone. Our recipe for understanding and/
or modeling the CCS ecosystem includes the following as essential elements:
• The Strait of Juan de Fuca with its tidal dynamics and its freshwater
• The Columbia River with its tidal dynamics, nutrients, and freshwater
• Submarine canyons with high topo- graphic resolution
• Alongcoast wind structure to capture remote wind forcing
These conclusions can be used to specu- late on potential effects of global warm- ing in the northern CCS. For example, as air temperature rises, we might expect less riverflow in both the Fraser and Columbia Rivers, because the summer effluent in both rivers is derived from snowmelt. A decline in Fraser River outflow would cause a decline in the outflow from the Strait of Juan de Fuca, and hence a decline in turbulent mixing in the strait. Both effects would suggest a decline in nutrient supply to the north- ern CCS and perhaps a decline in the strength of the eddy offshore of the Strait of Juan de Fuca, hence less local retention of both nutrients and phytoplankton.
Thus, the upstream source of nutrients and phytoplankton for the Washington/
Oregon shelf could be substantially diminished. Weaker Columbia River out- flow would cause the Columbia plume to contribute less to both nutrient supply and retention on the Washington shelf, reducing its usefulness as a buffer for the
local ecosystem during spring periods of intermittent winds.
A final caveat: our predictions are based on the best existing information and synthetic knowledge. These predic- tions should be viewed only as a begin- ning. Much work clearly remains to be done to provide a more realistic basis for predicting changes in the productivity of the CCS over the next several decades.
aCkNOWlEdgEMENtS
Barbara Hickey would particularly like to thank one of her mentors, Joe Reid, who suggested that much of this mate- rial, the content of an invited Sverdrup Lecture at an Ocean Sciences meeting, should be written up as a paper. We would also like to thank several col- leagues who generously shared data or figures that helped make many impor- tant points: Bill Cochlan at San Francisco State University provided nitrate and chlorophyll data for Figure 8; Parker MacCready graciously provided the Columbia River plume region hydrody- namic model underlying results shown in Figures 9 and 11. Andrew Thomas at the University of Maine provided satellite-derived chlorophyll data and Figure 3; Julia Parrish at the University of Washington and the US Fish and Wildlife Service, Washington Outer Coast Refuge provided the bird colony figure (Figure 5). Bill Peterson and Ed Casillas at the National Ocean and Atmospheric Administration (NOAA) and Joe Fisher at Oregon State University graciously provided the juvenile salmon distributions (Figure 4). Nancy Kachel assisted in analysis and figure graphics;
Susan Geier assisted in editing; Amy MacFadyen provided the drifter track figure. This analysis was supported by
grants to B. Hickey from NSF and from the Center for Sponsored Coastal Ocean Research of NOAA: OCE-0239089 (NSF), the Coastal Ocean Processes RISE project; NA17OP2789 (NOAA) and OCE-0234587 (NSF), ECOHAB PNW;
OCE0001034 (NSF) and NA17RJ1232 (NOAA), GLOBEC Northeast Pacific CCS. Drifter, nitrate, and chlorophyll data were collected under the ECOHAB PNW grants. Support for Banas was provided by the RISE grant compo- nent to Parker MacCready. This is contribution #41, 23, 300, and 609 of the RISE, ECOHAB PNW, ECOHAB and GLOBEC programs, respectively.
The statements, findings, conclusions, and recommendations are those of the authors and do not necessarily reflect the views of NSF, NOAA, or the Department of Commerce.
rEfErENCES
Allen, S.E. 1996. Topographically generated, subiner- tial flows within a finite length canyon. Journal of Physical Oceanography 26:1,608–1,632.
Allen, J.S., P.A. Newberger, and J. Frederiuk. 1995.
Upwelling circulation on the Oregon Continental Shelf. Part I. Response to idealized forcing. Journal of Physical Oceanography 25:1,843–1,866.
Bakun, A. 1973. Coastal upwelling indices, west coast of North America, 1946–71. NOAA Technical Report NMFS Special Scientific Report, Fisheries-671, US Dept. of Commerce, Washington DC. 103 pp.
Banas, N.S., E.J. Lessard, R.M. Kudela, P. MacCready, T.D. Peterson, B.M. Hickey, and E. Frame. In review. Planktonic growth and grazing in the Columbia River plume region: A biophysical model study.
Banas, N.S., P. MacCready, and B.M. Hickey. 2008.
The Columbia River plume as cross-shelf exporter and along-coast barrier. Continental Shelf Research doi:10.1016/j.csr.2008.03.011.
Barnes, C.A., A.C. Duxbury, and B.-A. Morse.
1972. Circulation and selected properties of the Columbia River effluent at sea. Pp. 5–80 in The Columbia River Estuary and Adjacent Ocean Waters, A.T. Pruter and D.L. Alverson, eds., University of Washington Press, Seattle, WA.
Barth, J.A., and R.L. Smith. 1996. Separation of a coastal upwelling jet and pathways for cross-
shelf exchange: A Lagrangian perspective. Eos Transactions, American Geophysical Union, Ocean Sciences Meeting Supplement 77(3):130, OS130.
Barth, J.A., B.A. Menge, J. Lubchenco, F. Chan, J.M. Bane, A.R. Kirincich, M.A. McManus, K.J.
Nielsen, S.D. Pierce, and L. Washburn. 2007.
Delayed upwelling alters nearshore coastal ocean ecosystems in the Northern California Current.
Proceedings of the National Academy of Sciences of the United States of America 104(10):3,719–3,724.
Battisti, D., and B.M. Hickey. 1984. Application of remote wind-forced coastal trapped wave theory to the Oregon and Washington coasts. Journal of Physical Oceanography 14(5):887–903.
Botsford, L.W., C.A. Lawrence, E.P. Dever, A. Hastings, and J.L. Largier. 2006. Effects of variable winds on biological productivity on continental shelves in coastal upwelling systems. Deep-Sea Research Part II 53(25–26):3,116–3,140: doi:10.1016/j.
dsr2.2006.07.011.
Bruland, K.W., M.C. Lohan, A.M. Aguilar-Islas, G.J.
Smith, B. Sohst, and A. Baptista. 2008. Factors influencing the chemistry of the near-field Columbia River Plume: Nitrate, silicic acid, dis- solved Fe and dissolved Mn. Journal of Geophysical Research doi:10.1029/2007JC004702.
Chase, Z., B. Hales, and T. Cowles. 2005. Distribution and variability of iron input to Oregon waters during the upwelling season. Journal of Geophysical Research 110(C10S12): doi:10.1029/2004JC002590.
Conomos, T.J., M.G. Gross, C.A. Barnes, and F.A.
Richards. 1972. River-ocean nutrient relations in summer. Pp. 151–175 in The Columbia River Estuary and Adjacent Ocean Waters, A.T. Pruter and D.L. Alverson, eds, University of Washington Press, Seattle, WA.
Crawford, W.R., and R.K. Dewey. 1989. Turbulence and mixing: Sources of nutrients on the Vancouver Island continental shelf. Atmosphere–Ocean 27(2):428–442.
Denman, K.L., D.L. Mackas, H.J. Freeland, M.J. Austin, and S.H. Hill. 1981. Persistent upwelling and mesoscale zones of high productivity off the west coast of Vancouver Island, Canada. Pp. 514–521 in Coastal Upwelling. F.A. Richards, ed., American Geophysical Union, Washington, DC.
Dugdale, R.C., F.P. Wilkerson, A. Marchi, and V.E.
Hogue. 2006. Nutrient controls on new production in the Bodega Bay, California, coastal upwelling plume. Deep-Sea Research Part II 53(25–26):3,049–
3,062: doi:10.1016/j.dsr2.2006.07.009.
Fisher, J., A. Ammann, J. Orsi, J. Piccolo, M. Trudel, C. Bucher, J. Harding, J. Morris, R. Brodeur, E.
Casillas, and others. 2007. Regional comparisons of distribution and abundance of juvenile salmon along the West Coast of North America. American Fishery Society Symposium 57:31–80.
Foreman, M.G.G., W. Callendar, A. MacFadyen, B.M.
Hickey, R.E. Thompson, and E. Di Lorenzo. 2008.
Modeling the generation of the Juan de Fuca Eddy.
Journal of Geophysical Research 113(C03006):
doi:10.1029/2006JC004082.
Freeland, H.J., and K.L. Denman. 1982. A topographi- cally controlled upwelling center off southern Vancouver Island. Journal of Marine Research 40:1,069–1,093.
Gan, J., and J.S. Allen. 2005. Modeling upwelling circu- lation off the Oregon coast. Journal of Geophysical Research 110(C10S07): doi:10.1029/2004JC002692.
Garcia-Berdeal, I., B.M. Hickey, and M. Kawase.
2002. Influence of wind stress and ambi- ent flow on a high discharge river plume.
Journal of Geophysical Research 107(C9):3,130:
doi:10/1029/2001JC000932
Geier, S.L., B.M. Hickey, S.R. Ramp, P.M. Kosro, N.B. Kachel, and F. Bahr. 2006. Interannual vari- ability in water properties and velocity in the U.S.
Pacific Northwest coastal zone. Eos Transactions, American Geophysical Union, Ocean Sciences Meeting Supplement 87(36):121, OS36D-23.
Hales, B., J.N. Moum, P. Covert, and A. Perlin.
2005. Irreversible nitrate fluxes due to tur- bulent mixing in a coastal upwelling system.
Journal of Geophysical Research 110(C10S11):
doi:10.1029/2004JC002685.
Henson, S.A., and A.C. Thomas. 2007. Phytoplankton scales of variability in the California Current system: 2. Latitudinal variability. Journal of Geophysical Research 112(C07018):
doi:10.1029/2006JC004040.
Hickey, B.M. 1979. The California Current system—
Hypotheses and facts. Progress in Oceanography 8:191–279.
Hickey, B.M. 1989. Patterns and processes of shelf and slope circulation. Pp. 41–115 in Coastal Oceanography of Washington and Oregon. M.R.
Landry and B.M. Hickey, eds, Elsevier Science, Amsterdam, The Netherlands.
Hickey, B.M. 1997. Response of a narrow submarine canyon to strong wind forcing. Journal of Physical Oceanography 27(5):697–726.
Hickey, B.M. 1998. Coastal Oceanography of Western North America from the tip of Baja California to Vancouver Island. Pp. 345–393 in The Sea, Volume 11. K.H. Brink and A.R. Robinson, eds., Wiley and Sons, Inc., New York, NY.
Hickey, B.M., and N.S. Banas. 2003. Oceanography of the Pacific Northwest coastal ocean and estuaries with application to coastal ecosystems. Estuaries 26(48):1,010–1,031.
Hickey, B., S. Geier, N. Kachel, and A. MacFadyen.
2005. A bi-directional river plume: The Columbia in summer. Continental Shelf Research 25(14):1,631–1,656.
Hickey, B., A. MacFadyen, W. Cochlan, R. Kudela, K.
Bruland, and C. Trick. 2006. Evolution of chemi- cal, biological and physical water properties in the northern California current in 2005: Remote or local wind forcing? Geophysical Research Letters 33(L22S02): doi:10.1029/2006GL026782.