PAPER
Special Section on Recent Progress in Electromagnetic Theory and Its ApplicationModel-Based Compressive Sensing Applied to Landmine Detection by GPR
Riafeni KARLINA†a),Nonmember andMotoyuki SATO††,Member
SUMMARY We propose an effective technique for estimation of tar- gets by ground penetrating radar (GPR) using model-based compressive sensing (CS). We demonstrate the technique’s performance by applying it to detection of buried landmines. The conventional CS algorithm en- ables the reconstruction of sparse subsurface images using much reduced measurement by exploiting its sparsity. However, for landmine detection purposes, CS faces some challenges because the landmine is not exactly a point target and also faces high level clutter from the propagation in the medium. By exploiting the physical characteristics of the landmine using model-based CS, the probability of landmine detection can be increased.
Using a small pixel size, the landmine reflection in the image is represented by several pixels grouped in a three dimensional plane. This block structure can be used in the model based CS processing for imaging the buried land- mine. The evaluation using laboratory data and datasets obtained from an actual mine field in Cambodia shows that the model-based CS gives better reconstruction of landmine images than conventional CS.
key words: compressive sensing (CS), stepped frequency continuous wave (SFCW), ground penetrating radar (GPR), Nyquist theorem, model based CS
1. Introduction
Landmine clearing remains an important issue in several places around the world. Ground penetrating radar (GPR) is one of the techniques that have been developed to facili- tate the mine clearing process. GPR works by transmitting an electromagnetic wave and analyzing the reflected wave to acquire information about subsurface features. Such infor- mation may include the distance, material, size, shape and other parameters of the reflecting feature, which can be used to distinguish a landmine signal from the reflections of other objects.
To achieve good landmine detection performance with GPR, the GPR measurement has to satisfy several require- ments given by the Nyquist sampling theorem. The GPR data has to be acquired at equally spaced observation points with spacing less than or equal to one half of the minimum wavelength of the GPR signal. To achieve high range res- olution, the GPR signal needs a large bandwidth resulting in a large amount of data that must be collected and ana- lyzed. If the measurement violates these requirements, the GPR image will have poor resolution and may generate arti- facts in the image. The poor resolution will make it difficult
Manuscript received April 1, 2015.
Manuscript revised July 11, 2015.
†The author is with Graduate School of Environmental Studies, Tohoku University, Sendai-shi, 980–8576 Japan.
††The author is with Center of Northeast Asian Studies, Tohoku University, Sendai-shi, 980–8576 Japan.
a) E-mail: [email protected] DOI: 10.1587/transele.E99.C.44
to differentiate the landmine reflection from that generated by another object in the subsurface.
In this study, we analyze the utility of applying an emerging technology; compressive sensing (CS) to land- mine detection. Compressive sensing is an advanced sig- nal processing technique which enables sparse signal recon- struction from a very small set of measurement data in the transform domain. In the case of landmine detection, the landmines are usually spread over a very large area. There- fore, a smaller GPR measurement area will contain a small number of landmines, which makes it a sparse problem that should be able to be solved by CS.
The theory behind CS has been presented in a num- ber of papers[1]–[4] and has been applied to several ap- plications, including through-wall radar imaging[5], [6], synthetic aperture radar (SAR) systems[7], and GPR sys- tems[8]–[12]. The implementation of CS for a stepped frequency continuous wave (SFCW) GPR system has been demonstrated by Gurbuz et al[8] and Suksmonoet al[9].
These studies demonstrated through simulation and experi- ment that using much reduced measurement, CS can recover a radar image with higher resolution and less clutter than the conventional image reconstruction method. Several inter- esting approaches to further increasing the performance of a CS-based system have also been published, such as the use of a radon transform for line structure detection in a GPR system[10] and a method to remove ground reflection in GPR system[11].
The previous work on GPR referenced above has shown that CS can be used to successfully reconstruct GPR images, even though GPR has some problems such as the strong reflection from the ground surface, high level clutter from the propagation in the medium, poorly known param- eters (e.g. wave velocity), and off-grid targets.
Unfortunately, in landmine detection, there is an addi- tional problem with CS image reconstruction caused by the size of the landmine which is usually much larger than the resolution of the system. Thus, landmine detection is not a truly sparse problem. As will be discussed in Sect. 5 below, CS processing may reconstruct artifacts in the GPR image where no target exists. It is also found that CS cannot ac- curately reconstruct the shape of the landmine, which can cause difficulty in recognizing the reflection of a landmine in a real application. Therefore, we present a study with a motivation to increase the accuracy of CS-based imaging for landmine detection by GPR, using a model-based CS tech- nique which works by exploiting the known shape and size Copyright c2016 The Institute of Electronics, Information and Communication Engineers
of the landmine.
Model-based CS is originally proposed by Baraniuket al[13]. This technique works by exploiting the special char- acteristics of a sparse signal. Model-based CS can improve the performance of CS by allowing only some configuration of non-zero components of the signal, and rejecting solu- tions which violate the signal model that has been defined.
The processing of the landmine data shows that the proposed model-based CS can give better visualization of the land- mine and remove artifacts from the CS solution.
This study also evaluates landmine detection by CS using data sets acquired at a real landmine field in Cam- bodia. The data was acquired by using ALIS (Advanced Landmine Imaging System) developed by Tohoku Univer- sity, Japan[14]–[19]. ALIS is a dual sensor system, con- sisting of a metal detector and handheld GPR system. The handheld GPR sensor system collects data at random loca- tions, controlled by the human operator. The collected data is usually sparse in the spatial domain. We consider this handheld GPR system a suitable data acquisition method for landmine detection by CS, since it is easy to control the data distribution in the two dimensional measurement area. The processed results using these data sets confirm the superior- ity of model-based CS over conventional CS processing.
2. Conventional CS-GPR System
The 3D subsurface images from GPR measurements can be reconstructed by dividing the observed area into a set of pix- els with desired resolution. The value of each pixel can be calculated by processing the data received at all antenna po- sitions and all frequency bands, using Fourier-based SAR processing as shown in (1).
p(xp,yp,zp)= 1 NyaNaxM
Nay−1 ya=0
Nax−1 xa=0
M−1
m=0
sr(xa,ya,m) exp(−j2πfmra,p/v)
(1) Here p(xp,yp,zp) is the estimation of electromagnetic re- flectivity of an object located at pixel (xp,yp,zp) in the GPR image, where the spatial coordinates are 0≤ xp ≤Nxp−1, 0 ≤ yp ≤ Nyp −1, and 0 ≤ zp ≤ Nzp −1. In Eq. (1), sr(xa,ya,m) is the signal received at the (xa,ya) position of the antenna and them-th frequency point,Nxais the number of observation points along the x axis;Nyais the number of observation points along the y axis;Mis the number of fre- quency points;ra,pis the propagation distance between the transmitter antenna at position (xa,ya) to the pixel at posi- tion (xp,yp,zp) and from the pixel to the receiver antenna at position (xa+d,ya); anddis the separation distance between the transmitter and receiver antenna.
If there is an object located at a pixel, thepvalue at that pixel will be high, otherwisepwill be zero. If the size of the subsurface object is very small compared to the whole area, then only small number of pvalues will be high. In this case, pis a sparse variable, and we can apply CS to this
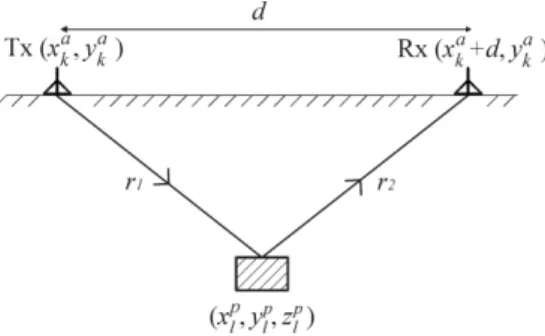
Fig. 1 Coordinate definition of the antennas and the buried target in GPR imaging
image reconstruction problem.
The CS problem can be formulated from the SAR pro- cessing given by (1). In a GPR system, the data is sparse in the spatial domain, as represented with a three-dimensional p matrix. The measurement is performed in the space- frequency domain, given by the three dimensional sr ma- trix. To define the representation basis, sr andpshould be modified to be 1-column vectors by concatenating columns.
From the relation betweensrandp, the representation basis Ψcan be derived as shown in (5).
sr=Ψp (2)
ψk,l=exp(2πfkrk,l/v) (3) for 0 ≤k ≤ K−1 and 0 ≤l ≤L−1, withK = NyaNaxM being the number of full measurement data in the spatial- frequency domain, and L = NypNxpNzp the total number of pixels in the image. In the equation, fkis the frequency of the signal corresponding to the k-th row of the vector sr, andrk,lis the two way travel time between the Tx antenna at (xak,yak) to the pixel located at (xlp,ylp,zpl) and from the pixel to the Rx antenna at (xak+d,yak), as shown in Fig. 1.
In the foregoing, (xak,yak) is the position of the Tx an- tenna corresponding to the k-th row of the vector sr, and (xpl,ylp,zlp) is the position of the pixel corresponding to the l-th row of the vector p.
The sampling process is performed by applying the sampling matrixΦto thesrmatrix, resulting in the vector y, as shown in (4).
y=Φsr=ΦΨp=Ap (4)
The CS algorithm finds the solution of the equation by ex- ploiting the sparsity of vector p. Beside the signal sparsity, the incoherency betweenΦandΨis a fundamental princi- ple in CS theory[1]–[4]. However, it has been shown that the random matrices are incoherent with any fixed basisΨ with high probability. This theory leads to easy implemen- tation of CS in real applications, because we only need to do random sampling during the measurement.
3. Model-Based CS-GPR for Landmine Detection Baraniuket alproposed model-based compressive sensing
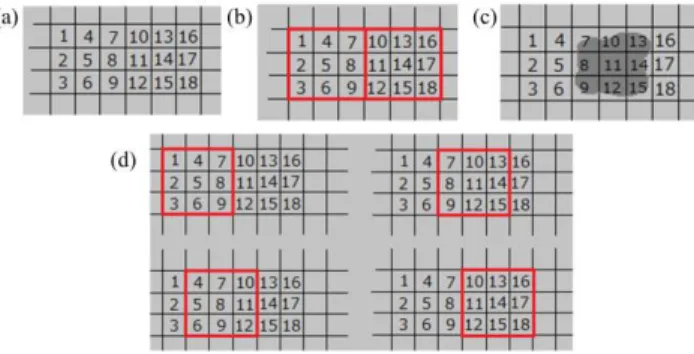
Fig. 2 Blocking process in GPR imaging by model-based CS algorithm.
(a) Some pixels in a GPR image. (b). Blocking process in original al- gorithm. (c). Example of target position in GPR image, which can not be perfectly defined by the blocks in the original algorithm. (d) Proposed overlapped blocking process; the target in Fig. 2 (c) can be represented by the second block.
which exploits the special characteristics of the signal to fur- ther increase the performance of a CS system; this is done by reducing the number of degrees of freedom of a sparse signal by permitting only certain configurations of the large and zero/small coefficients[13]. It is shown in this study that model-based CS can reduce the number of measurements re- quired to stably recover a signal and better differentiate true signal information from recovery artifacts, which leads to a more robust recovery.
3.1 Original Block Sparse Model
This study focuses on the implementation of CS for land- mine detection using a GPR system. Since landmines are typically much larger than the resolution of a GPR system, the landmine will be represented by several pixels grouped together in the GPR image. For this case, the model-based CS for a block sparse signal is implemented.
The Baraniuket alstudy defined a block sparse signal as a signal vector x ∈ JN, with J andN integers. This signal can be reshaped into aJ×NmatrixX. SignalXin a block sparse model has entire columns as zeros or nonze- ros. The measure of sparsity forXis its number of nonzero columns, which defines the block sparsity level (K) of the signal. Mathematically, Baraniuket al[13]defined the set ofK-block sparse signalsas
SK ={X=[x1. . .xN]∈ J×Nsuch that
xn=0 fornΩ,Ω⊆ {1, . . . ,N},|Ω|=K} (5) Using this definition of block sparse signal, it is important to know how to divide the sparse signal so that the non-zero components will be grouped correctly and do not mix with the zero components. However, in the case of GPR imaging, the exact location of the target is unknown. Therefore, it is difficult to divide the imaging area into blocks that would put the target exactly inside one block, even though the tar- get size and the pixel size are known. Figure 2 shows an illustration of the blocking process in GPR imaging. Fig- ure 2 (a) shows a portion of the two dimensional GPR im- age showing 18 pixels. Suppose a target is modeled by a 3x3
pixel cube. The model-based algorithm requires that these 18 pixels are divided into 2 blocks of 3x3 pixels as shown in Fig. 2 (b), then the block sparse set is defined in (7), withxn
as the pixel value at then-th pixel:
x={x1,x2, . . . ,x18} (6)
XT =
x1,x2,x3,x4,x5,x6,x7,x8,x9 x10,x11,x12,x13,x14,x15,x16,x17,x18
(7)
3.2 Proposed Block Sparse Model
According to the definition of the block sparse signal given in (9), the target should be located either in the first block given by the first column ofXor in the second block given by the second column ofX. Therefore, if the target is located in the middle of these two blocks, as shown in Fig. 2 (c), the target cannot be perfectly represented by any block, which will be a problem during the model-based CS processing.
In this study, we propose a blocking process where the imaging area will be divided into several overlapped blocks.
Therefore we do not need to know the exact location of the target in the image. The blocks which contain the target will have highest signal proxy, and the blocks which partially contain object can have lower signal proxy and can be elim- inated from the CS solution using the known sparsity level during the subsequent processing. This blocking process is shown in Fig. 2 (d), which shows four overlapped blocks in the imaging area. In this case, the block sparse set is given by (8).
XT =
⎧⎪⎪⎪⎪⎪⎨
⎪⎪⎪⎪⎪
⎩
x1,x2,x3,x4,x5,x6,x7,x8,x9
x4,x5,x6,x7,x8,x9,x10,x11,x12 x7,x8,x9,x10,x11,x12,x13,x14,x15
x10,x11,x12,x13,x14,x15,x16,x17,x18
⎫⎪⎪⎪⎪⎪⎬
⎪⎪⎪⎪⎪
⎭
(8)
By using this configuration, the target illustrated in Fig. 2 (c) can be perfectly defined by the third column of the block set X.
In this study on landmine detection, the purpose is to reconstruct a three dimensional GPR image. Ideally, the model should be the same size with the real size of the land- mine, but in this study we will simplify the model to reduce the computation complexity. The landmine is modeled as a cube represented by a 3x3x3 group of pixels, as shown in Fig. 3, withn0being the index of the center pixel, andn1to n26 giving the index of the surrounding pixels in three di- mensional planes. Therefore, the member of each block can be written as
Index={n0,n1,n2, . . . ,n26} (9)
3.3 Model-Based CoSaMP Algorithm
To find the CS solution, we use a model-based version of compressed sampling matching pursuit (CoSaMP) as pro- posed in[13]. This algorithm is modified from the CoSaMP algorithm developed by Needellet al[20],[21]. The struc- ture shown in Fig. 3 is used in step 3 of the algorithm. The
Fig. 3 Landmine and the landmine model used for model-based CS pro- cessing. (a) PMN-2 landmine buried in the experiment site. (b) The 3x3x3 model of landmine. (c) The index of each pixel in the 3x3x3 landmine model
algorithm works via iteration as follows:
1) Initialize residual r = y, t = 0, and su pp = ∅, with su pp(orsupport) shows the location of nonzero com- ponents ofp.
2) Sett=t+1 and calculate signal proxy for each pixel.
xp=ATrt−1 (10)
3) Calculate signal proxy for each block structure, and de- rive the new supports by selecting 2K largest signal proxies, withKas a predefined block sparsity level.
xpBlock(n)=
Indexxp(n|Index)
xpBlock(n)=xp(n0)+xp(n1)+. . .+xp(n26) (11) λt=supp (xpBlock(2K)) (12) 4) Merge the support with the previously estimated sup-
port from last iteration.
su ppt =su ppt−1∪λt (13) 5) Form signal estimateb
b(su ppt)=Asuppt+y (14)
b(su ppt)C =0 (15)
6) Prune signal estimate by selecting theKlargest com- ponent ofb
pt =b(K) (16)
7) Calculate the new residual
rt=y−Apt (17)
8) If the new residual satisfies the halting crriterion, the algorithm terminates. Otherwise, goback to step 2.
It is important to note that in the model-based CS algorithm, the block sparsity levelKis required. In GPR imaging, the block sparsity level provides an estimation of the number of targets that exist in the imaging area.
4. Laboratory Experiment
4.1 Experimental Setup
A laboratory experiment was conducted to acquire regular grid data to detect a PMN-2 landmine buried in dry sand.
The experiment was conducted by performing data acquisi- tion in a two dimensional plane. Two spiral antennas, sepa- rated by 9 cm, were used. The antenna movement was con- trolled by a mechanical positioner to acquire data along a perfectly regular grid.
A vector network analyzer (VNA by Anritsu) was used to generate the step frequency signal and record the re- flected signal. The SFCW signal uses a frequency range from 10 MHz to 6 GHz, with 137 frequency points and a 43.72 MHz frequency step. The data was collected on a flat ground surface at 61 observation points in the xandydi- rections, with a 1 cm separation between two consecutive observation points. The total number of observation points in the two dimensional area was 3721 points.
Before performing sampling for CS processing, the Nyquist criterion of spatial sampling for this experiment is calculated asλmin/2 which is 1 cm. This result shows that the measurement setup is the same with the Nyquist crite- rion. To acquire a high quality GPR image, this requirement should be satisfied.
Before CS processing, the measurement data in the spatial and frequency domain were sampled. In this study, 10% sampling was performed on the observation points, and 50% sampling on the frequency data. The total sample used was 5% of the full measurement dataset, with 372 random observation points and 69 random frequency data for each observation point.
A pixel size of 1x1x1 cm was used for the GPR imag- ing. The diameter of a PMN-2 landmine is 12 cm and the height is 5 cm. Considering these two parameters, the land- mine should be represented by about 12x12x5 pixels. Ide- ally, the model for model-based CS should be the same as the size of the object. However, in this work we use a sim- plified landmine model of a cube of 3x3x3 pixels.
4.2 Imaging Results
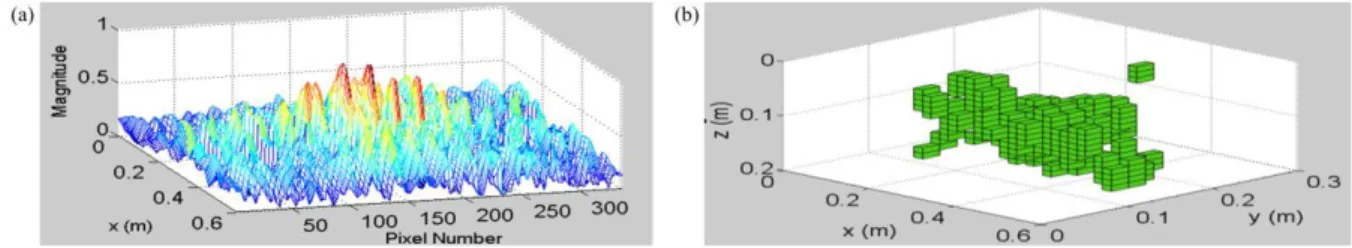
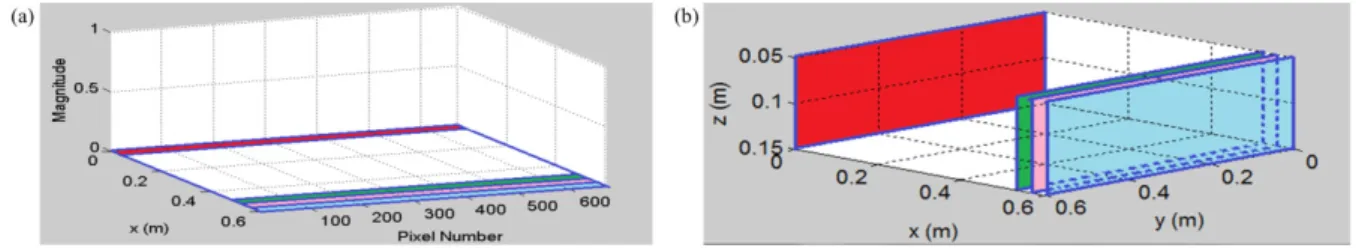
In order to show the quality of the image reconstruction, two images are used. The correlation between them is il- lustrated in Fig. 4. To show the location of the buried target in the observation area, a 3D image as shown in Fig. 4 (b) is needed. A pixel with magnitude larger than the defined imaging threshold will be imaged as a small cube at the cor- responding location of the pixel. However, this figure can- not include the magnitude information of each pixel in the imaging area. Therefore, information of the sidelobe level and the clutter level of the image, which is important to com- pare the quality of image reconstruction, will be lost.
Therefore, we use a 2D image as shown in Fig. 4 (a).
This figure shows the normalized magnitude of each pixel
Fig. 4 Two images used to evaluate the image reconstruction results. (a). Magnitude plot to show the normalized magnitude of each pixel in each vertical slice. (b) 3D image showing only the pixels for which normalized magnitudes exceeded the threshold value
Fig. 5 The reconstructed landmine image using 100% data by Fourier Based SAR processing. (a) The magnitude of each pixel. (b) 3D image showing the location of the landmine in the imaging area, imaging threshold=0.5.
Fig. 6 The reconstructed landmine image using 10% of the spatial data by conventional CS processing (Bayesian RVM algorithm). (a) The magnitude of each pixel. (b) 3D image showing the location of the landmine in the imaging area. This figure contains some high peaks in the wrong locations.
in each vertical slice of Fig. 4 (b), which is marked with dif- ferent colors. Each vertical slice contains 671 pixels located in a 2D vertical plane (61 pixels by 11 pixels). The magni- tude of these pixels is shown on the z axis in Fig. 4 (a).
An imaging threshold is needed only for conventional SAR imaging, because this method produces an image which contains clutter all over the imaging area. The 3D image is reconstructed by placing a cube at the location of a pixel with a value higher than the defined threshold. In this paper, the imaging threshold is defined to be 0.5, which means that only pixels with magnitude larger than half of the maximum magnitude will be shown in the 3D image. As for CS imaging, most of the pixels have zero values. Therefore, all the non-zero pixels can be imaged in the 3D image.
Figure 5 shows the reconstructed GPR image using conventional full measurement with SAR processing. The landmine reflection is visible at a depth of 12 cm, repre- sented by several pixels grouped together in the three di- mensional planes.
Figure 6 shows the CS reconstruction of the GPR im- age using a 2% sample of the data and the Bayesian RVM
algorithm[22]–[24]. This algorithm does not require knowl- edge of the sparsity of the signal, but it does need a rough estimation of the noise level in the measurement. The figure shows weak reflection around the location of the landmine, and there are several high magnitude peaks in other regions where no target exists. These false detected peaks may yield an incorrect interpretation during the real measurement.
Figure 7 shows the reconstructed GPR image using model-based CS with the proposed model, in which. the block sparsity levelKis assumed. Since only one landmine exists in the imaging area, thenK =1. Figure 7 shows that even though the landmine model is much smaller than the size of the real PMN-2 landmine, the landmine reflection is reconstructed at the correct position, with no false detected peaks at other locations. Compared to conventional SAR imaging shown by Fig. 4, the GPR image reconstructed by model-based CS contains less clutter and has better resolu- tion. More importantly, this image is generated using only 10% of the spatial sample, which will reduce the data ac- quisition time significantly in a real measurement. Using handheld GPR sensor system as proposed in Sect. 5, the data
Fig. 7 The reconstructed landmine image using 10% of the spatial data by model based CS process- ing. (a) the magnitude of each pixel. (b) 3D image showing the location of the landmine in the imaging area.
acquisition time can be reduced from 8 hours to less than 5 minutes.
Another advantage of using CS processing is the shorter processing time as a result of the reduction of spatial and frequency data to process. CPU time needed to generate Fig. 5 is about 7 hours, while Fig. 6 needs about 3 minutes and Fig. 7 needs less than 1 minutes.
5. Evaluation Using Data Sets from a Real Landmine Field in Cambodia
5.1 Handheld GPR Sensor System
Tohoku University, Japan has been developing a dual sensor system, the Advanced Landmine Imaging System (ALIS) since 2002[14]–[19]. An impulse GPR sensor system is part of ALIS. The antenna is scanned manually by the op- erator, as shown in Fig. 8 (a). As a result, the scanning po- sition is located randomly in the two dimensional plane. In one scanning position, the GPR system records the reflected wave and the CCD camera captures the image of the current scanning position. The procedure of landmine detection us- ing ALIS can be explained in the following steps. First, the deminar tries to find a single MD response by the sound.
Then, the deminer scans the area using the handheld GPR system and performs signal processing. By following this procedure, the GPR image produced by ALIS system al- ways has K = 1. Therefore, by using ALIS system, the problem of estimating the value of K can be solved.
5.2 Measurement Setup and Pre-Processing
The data used in this evaluation are from an actual ALIS dataset acquired in a landmine field in Cambodia where a PMN-2 landmine is buried in sand. ALIS used frequency range of 1-3 GHz, with data acquisition rate was 30 Hz. A cavity-backed spiral antenna was used to transmit and re- ceive circular polarized waves. The GPR system acquired data from a total of 723 observation points, the scanning po- sitions of which are shown in Fig. 8 (b). The GPR system recorded time domain signals at each position in 512 sam- ples. CS works with frequency domain data, so that the raw time domain data from GPR system need to be transformed into frequency domain by FFT. The time delay of the system is estimated to be 9.31 ns and was corrected before FFT. To
Fig. 8 (a) ALIS in operation in Cambodia[16], (b) Recorded scanning position in a field data acquisition using ALIS
avoid ringing in the resulting frequency domain data, the start and end of the time domain signal was truncated us- ing time domain windowing. After this step, FFT was per- formed using 1024 point FFT, with a frequency range from 8.4 MHz to 4.3 GHz.
5.3 Imaging Results
The SAR processing using 100% of the frequency data yielded the reconstructed 3D image as shown in Fig. 9.
Compared to the previous experiment which used dense and regular gridded datasets, the imaging result using conven- tional SAR processing gave a wider sidelobe and higher level of clutter.
The application of CS begins by performing a sampling process in the spatial and frequency domains. To provide conditions consistent with the previous experiments, the sampling process was performed to keep the final amount of data nearly the same. A total of 361 spatial positions (50% of the full spatial data) and 69 frequency points were randomly selected to be used in CS processing. Figure 10 shows the reconstructed image using Bayesian Fast RVM.
The result shows several reconstructed high magnitude pix- els scattered in the three dimensional imaging area. Even though some of the pixels are located where the landmine is, the separated pixels can cause confusion as to whether they are due to an object as large as a landmine, or to three small targets scattered in that positions.
Figure 11 shows the imaging result using model-based CS. In this GPR measurement, there is only one landmine buried in the sand, henceK =1 is used. This result shows
Fig. 9 The reconstructed landmine image from the ALIS datasets using 100% of the data by Fourier- based SAR processing. (a) The magnitude of each pixel. (b) A 3D image which shows the location of the landmine in the imaging area, imaging threshold=0.5.
Fig. 10 The reconstructed landmine image from the ALIS datasets using 50% of the spatial data by conventional CS processing (Bayesian RVM algorithm). (a) The magnitude of each pixel. (b) 3D image showing the location of the landmine in the imaging area.
Fig. 11 The reconstructed landmine image from the ALIS datasets using 50% spatial data by model based CS processing. (a) The magnitude of each pixel. (b) 3D image showing the location of the landmine in the imaging area.
the reconstructed landmine reflection at the correct location.
Compared to the conventional CS processing, the model- based CS resulted in a compact reconstructed image of the landmine, which gives better perception about the buried target.
6. Conclusion
We proposed model-based CS processing which exploits the block sparse structure in the GPR image for landmine detec- tion. The landmine was modeled according to a block sparse structure where the high magnitude peaks are grouped to- gether in the three dimensional image. The solution was found by defining some overlapping blocks in the three- dimensional imaging area. The model-based CoSaMP al- gorithm was used to determine the block from which the landmine reflection had come. From the data processing results, the model-based CS was observed to reconstruct a more accurate landmine reflection then the conventional CS processing.
The implementation of CS processing to a handheld
GPR sensor system has also been presented. The hand- held system is considered suitable to provide the sparse and random spatial data for a CS-based GPR system. Another advantage in using this system is that the problem of esti- mating the block sparsity level can be eliminated, since it is likely that the GPR system will image only one landmine at a time. The experiment in the real landmine field con- firms that by exploiting the physical characteristics of the landmine through the model-based CS, the quality of the CS imaging can be improved.
Acknowledgments
This work was supported by JSPS Grant-in -Aid for Scien- tific Research (A) 26249058.
References
[1] D.L. Donoho, “Compressed sensing,” IEEE Trans. Inf. Theory, vol.52, no.4, pp.1289–1306, 2006.
[2] E.J. Candes, J. Romberg, and T. Tao, “Robust uncertainty princi- ples: Exact signal reconstruction from highly incomplete frequency
information,” IEEE Trans. Inf. Theory, vol.52, pp.489–509, 2006.
[3] R. Baraniuk, “Compressive sensing,” IEEE Signal Process. Mag., vol.24, no.4, pp.118–121, July 2007.
[4] E.J. Cand`es and W.B. Michael, “An introduction to compressive sensing,” IEEE Signal Process. Mag., vol.25, no.2, pp.21–30, March 2008.
[5] Y.-S. Yoon and M.G. Amin, “Compressed sensing technique for high-resolution radar imaging,” Proc. SPIE, vol.6968, pp.696 81A.1– 696 81A.10, May 2008.
[6] Q. Huang, L. Qu, B. Wu, and G. Fang, “UWB Through-Wall Imag- ing Based on Compressive Sensing,” IEEE Trans. Geosci. Remote Sens., vol.48, no.3, pp.1408–1415, March 2010.
[7] X. Zhu and R. Bamler, “Tomographic SAR inversion by L1 norm regularization—The compressive sensing approach,” IEEE Trans.
Geosci. Remote Sens., vol.48, no.10, pp.3839–3846, Oct. 2010.
[8] A.C. Gurbuz, J.H. McClellan, and W.R. Scott, “A Compres- sive Sensing Data Acquisition and Imaging Method for Stepped Frequency GPRs,” IEEE Trans. Signal Process., vol.57, no.7, pp.2640–2650, July 2009.
[9] A.B. Suksmono, E. Bharata, A.A. Lestari, A.G. Yarovoy, and A.P. Ligthart, “Compressive Stepped-Frequency Continuous-Wave Ground-Penetrating Radar,” IEEE Geosci. Remote Sens. Lett., vol.7, no.4, pp.665–669, Oct. 2010.
[10] A.C. Gurbuz, J.H. McClellan, J. Romberg, and W.R. Scott, “Com- pressive Sensing of Parameterized Shapes in Images,” in ICASSP, pp.1949–1952, 2008.
[11] M.A.C. Tuncer and A.C. Gurbuz, “Ground Reflection Removal in Compressive Sensing Ground Penetrating Radars,” IEEE Geosci.
Remote Sens. Lett., vol.9, no.1, pp.23–27, Jan. 2012.
[12] M.A.C. Tuncer and A.C. Gurbuz, “Analysis of orthogonal matching pursuit based subsurface imaging for compressive ground penetrat- ing radars,” Turk. J. Elec. Eng. & Comp. Sci., vol.20, no.6, pp.979–
989, 2012.
[13] R.G. Baraniuk, V. Cevher, M.F. Duarte, and C. Hegde, “Model Based Compressive Sensing,” IEEE Trans. Inf. Theory, vol.56, no.4, pp.1982–2001, April 2010.
[14] M. Sato, “Deployment of GPR system ALIS for humanitarian dem- ining in Cambodia,” Proc. 13th International Conference on Ground Penetrating Radar, Lecce, Italy, June 2010.
[15] X. Feng and M. Sato, “Hand-held GPR Imaging Using Migration for Irregular Data,” IEEE J. Sel. Topics Appl. Earth Observ. Remote Sens. (JSTARS), vol.4, no.4, pp.799–803, Dec. 2011.
[16] X. Feng, M. Sato, and C. Liu, “Subsurface Imaging Using a Hand- held GPR MD System,” IEEE Geosci. Remote Sens. Lett., vol.9, no.4, pp.659–662, July 2012.
[17] M. Sato, Y. Yokota, and K. Takahashi, “ALIS: GPR System for Hu- manitarian Demining and Its Deployment in Cambodia,” Journal of the Korean Institute of Electromagnetic Engineering and Science,”
vol.12, no.1, pp.56–62, 2012.
[18] http://www.alis.jp/
[19] M. Sato, “Dual Sensor ALIS Evaluation Test in Afghanistan,” IEEE Geoscience and Remote Sensing Society Newsletter, pp.22–27, 2005.
[20] D. Needell, Topics in Compressed Sensing, Ph.D dissertation, Dept.
Math., Univ. California, Davis, 2009.
[21] D. Needell and J.A. Tropp, “CoSaMP: Iterative signal recovery from incomplete and inaccurate samples,” Appl. Computat. Harmon.
Anal., vol.26, no.3, pp.301–321, May 2009.
[22] M.E. Tipping and A.C. Faul, “Fast marginal likelihood maximiza- tion for sparse Bayesian models,” Proc. 9th Int. Workshop Artificial Intelligence and Statistics, C.M. Bishop and B.J. Frey, Eds., 2003 [Online]. Available: http://citeseer.ist.psu.edu/611465.html [23] C. Faul and M.E. Tipping, “Analysis of sparse Bayesian learning,”
in Advances in Neural Information Processing Systems (NIPS 14), T.G. Dietterich, S. Becker, and Z. Ghahramani, Eds., 2002, pp.383–
389 [Online]. Available: http://citeseer.ist.psu.edu/ faul01analysis.html
[24] M.E. Tipping, “Sparse Bayesian learning and the relevance vector machine,” J. Mach. Learn. Res., vol.1, pp.211–244, 2001.
Riafeni Karlina received the B.S. and M.S. degrees in Electrical Engineering from Bandung Institute of Technology in 2007 and 2009, respectively. She received PhD in 2013 from Graduate School of Environmental Stud- ies, Tohoku University, Japan. Her research in- terest is in signal processing, ground penetrating radar, and compressive sensing.
Motoyuki Sato received the B.E., M.E de- grees, and Dr. Eng. degree in information en- gineering from the Tohoku University, Sendai, Japan, in 1980, 1982 and 1985, respectively.
Since 1997 he is a professor at Tohoku Uni- versity and a distinguished professor of Tohoku University since 2007, and he was the Director of Center for Northeast Asian Studies, Tohoku University during 2009–2013. From 1988 to 1989, he was a visiting researcher at the Fed- eral German Institute for Geoscience and Natu- ral Resources (BGR) in Hannover, Germany. His current interests include transient electromagnetics and antennas, radar polarimetry, ground pene- trating radar (GPR), borehole radar, electromagnetic induction sensing, in- terferometric and polarimetric SAR. He has conducted the development of GPR sensors for humanitarian demining, and his sensor ALIS which is a hand-held dual sensor, has detected more than 80 mines in mine fields in Cambodia since May 2009. He is a visiting Professor at Jilin University, China, Delft University of Technology, The Netherlands, and Mongolian University of Science and Technology. He is the Chair of the Technical Committee on Electromagnetic Theory in Electronics Society of the IEICE since 2015. He was the technical chair of GPR96 and the general chairper- son of IGARSS2011 and a Fellow of IEEE.

![Fig. 8 (a) ALIS in operation in Cambodia[16], (b) Recorded scanning position in a field data acquisition using ALIS](https://thumb-ap.123doks.com/thumbv2/123deta/5624425.1500033/6.892.466.818.326.497/alis-operation-cambodia-recorded-scanning-position-field-acquisition.webp)