R&D Intensity and Domestic and Cross‑Border M&A of Japanese Firms before Domestic M&A Deregulation
著者 TAKECHI Kazutaka
出版者 Institute of Comparative Economic Studies, Hosei University
journal or
publication title
Working Paper
volume 133
page range 1‑19
year 2007‑11‑12
URL http://hdl.handle.net/10114/3983
R&D Intensity and Domestic and Cross-Border M&A of Japanese Firms before Domestic M&A Deregulation ∗
Kazutaka Takechi
†November 2, 2007
Abstract
In this paper, we examine the determinants of M&A whilst focusing on R&D before the deregu- lation of domestic M&A transactions in Japan. Firms’ growth strategies and the institutional differ- ences between domestic and international M&A reveal the determinants of differences in M&A. Our estimates show that domestic M&A activities are weakly related to R&D, which suggests that techno- logical progress has no effect on domestic M&A. For international M&A, firms’ R&D activities have a significantly positive effect, which implies that a firm’s own technology is important for absorbing foreign technology or for competing in a host country.
Keywords: Domestic M&A, Cross-border M&A, R&D JEL codes: F23, G34, L19
∗I would like to thank Makoto Kawamura, Yutaka Suzuki, Koichi Takeda, Akiko Tamura, and the seminar participants at Hosei University. Financial support for this research was provided by a Grant-in-Aid for Scientific Research by the Japan Society for the Promotion of Sciences (No.18730175,19330066 )
†Faculty of Economics, Hosei University. Address: 4342 Aihara-machi, Machida-shi, Tokyo, Japan 194-0298. E-mail:
1 Introduction
In technology-intensive industries, R&D and M&A activities are prominent. Innovations can be con- ducted within a firm through R&D. Alternatively, technology can be acquired through M&A. Because the motivation for M&A is technology acquisition, M&A activities can act as a substitute for R&D. This creates a negative link between R&D and M&A (see Blonigen and Taylor (2000) for the U.S. case).
However, at the same time, absorptive capacity is required to utilize technology (Cohen and Levinthal (1989)). Acquiring firms must increase their employees’ skills by initiating their own R&D. Moreover, when considering cross-border M&A, firms might have to use their own technological advantages to compete in foreign markets. This is referred to in the direct investment literature as “ownership advan- tage” (Dunning (1981)). As a result, cross-border M&A and R&D might have a positive correlation (see, for example, Brainard (1997)). Therefore, it is not clear how R&D activities are related to domestic and cross-border M&A. Hence, this relationship is an empirical issue.
When considering Japanese M&A activities, one must bear in mind that the differences between the domestic and cross-border M&A environments faced by Japanese firms were significant before the late 1990s when M&A regulations began to be liberalized. In Japan, domestic M&A was limited because of the regulations, the extensive webs of corporate cross-shareholdings, and social norms. Thus, there were few hostile takeovers (Milhaupt and West (2001)). Therefore, firms might have been unable to engage aggressively in M&A activities to access technology. There were no such restrictions in foreign coun- tries such as the U.S. Kogut and Chang (1991) and Blonigen (1997) suggest that Japanese firms’ direct investment in the U.S. is motivated by the desire to acquire technology. Hence, Japanese firms might engage in international M&A activities in order to access not only production capacity and distribution services, but also superior technology.
In this paper, we address the question of how Japanese R&D activities are related to domestic and cross-border M&A. We use data on the R&D and M&A of large Japanese electronics firms. The elec- tronics industry is active in M&A and R&D and large firms are the main players in these activities. To highlight the technology access aspects of M&A and the differences between domestic and international M&A, we use data relating to the period before M&A was deregulated in Japan. In 1997, firms were allowed to have pure financial holding companies. This represented the beginning of the deregulation of M&A. In 1999, the Commercial Code was changed to introduce share-for-share exchanges between companies. In 2001, the Commercial Code was revised to enable companies to separate business units more easily (see Milhaupt and West (2001)). Without these institutional reforms, it was difficult for tech- nologically active firms to use domestic M&A to access technology. Thus, at that time, firms may have been more motivated to engage in international M&A.
We contribute to the literature by empirically investigating the relationship between R&D and domes- tic and cross-border M&A. Out estimates show that while R&D intensity is weakly related to domestic M&A, it is positively related to U.S. M&A. In the M&A literature, Hall (1987) finds an insignificant effect of R&D on M&A activities, and Blonigen and Taylor (2000) find that in the U.S. electronic and electrical equipment industries, R&D intensity and M&A are negatively correlated. Our results are con- sistent with these findings. Our estimation results suggest that firm technology has little relation to domestic M&A activities because of regulations and that firms cannot follow the strategy of “making or buying” technology for domestic M&A. Studies of international M&A use country-level or industry-level data to investigate the determinants of cross-border M&A (see, for example, Di Giovanni (2005)), but these studies typically ignore R&D. One notable exception is the study of Bertrand and Zuniga (2006), who find that international M&A has a positive effect on R&D in medium-technology industries. Our
results also indicate the importance of M&A destinations, with R&D-intensive firms being more likely to acquire U.S. firms.
Our study also contributes to the direct investment literature, in which R&D intensity is considered to be an important determinant of direct investment. For example, while Kogut and Chang (1991) find that R&D has no significant effect on acquisitions in the U.S. based on industry-level data, Brainard (1997) and Kogut and Chang (1996) find that R&D-intensive firms tend to invest abroad. Our empirical results confirm that the firm’s own R&D is important for international business.
This paper is organized as follows. In the next section, we describe the data set. In Section 3, we develop our models and estimation methods. In Section 4, we report our empirical results. The final section concludes the paper.
2 Data
We have compiled data on M&A, R&D, and firm characteristics for publicly listed Japanese electronics firms. Data on M&A are provided by the Nihon Kigyo no M&A Databook 1988–2002 (M&A Databook of Japanese Firms in 1988–2002) by Recof (in Japanese). The databook covers both domestic and in- ternational M&A. It contains the names of acquiring and targeted firms, dates, industries, countries (for international M&A), and the amounts paid for acquisition (if available) in each year. M&A includes mergers, acquisitions, partial acquisitions, and equity increases. The publisher collected data through media releases on M&A announcements. Because information on the value of acquisitions is not nec- essarily available, we derived annual counts of M&As for the count data estimations. For multinomial logit estimation, we constructed an index of whether a firm engaged in M&A activity; this index reports
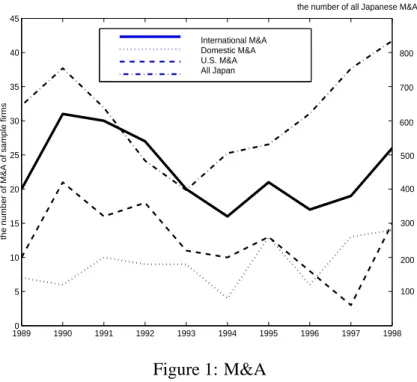
19890 1990 1991 1992 1993 1994 1995 1996 1997 1998 5
10 15 20 25 30 35 40 45
the number of M&A of sample firms
International M&A Domestic M&A U.S. M&A All Japan
800
700
600
500 the number of all Japanese M&A
400
300
200
100
Figure 1: M&A
whether firms did not engage in M&A, engaged in only domestic M&A, engaged in international M&A, or engaged in both domestic and international M&A.
In total, 91 domestic M&As and 227 international M&As between 1989 and 1998 are represented in the sample. More than half (125 out of 227) of the international M&As took place in the U.S.
Hence, the number of domestic M&As and U.S. M&As are similar. Other destinations include Australia, Brazil, Canada, China, Denmark, Finland, France, Greece, Germany, Hong Kong, India, Indonesia, Italy, Malaysia, the Netherlands, Pakistan, Poland, Portugal, Singapore, South Korea, Spain, Sweden, Switzer- land, Taiwan, Thailand, and the U.K. Figure 1 presents time-series data on the number of M&As over the sample period. The pattern of Japanese M&A is similar to that of the sampled firms. There was a downward trend in the mid-1990s and then an upward trend in the late 1990s. Hence, it is reasonable to suggest that the M&A activities of the sampled firms are similar to those of Japanese firms.
For R&D, the data source is the Japan Company Handbook (several issues) published by Toyo Keizai.
Because the accounting R&D input data on firms in the electronics industry are considered noisy data
(Griliches and Mairesse (1985)), we collected the data from the aforementioned handbook, as also used by, for example, Branstetter (2000). The handbook indicates yearly R&D spending. The data period is from 1989 to 1998. Given that we concentrate on the electronics industry, we have used a sample of 141 publicly traded firms; this provides 1410 observations. We used this sample size to obtain a balanced panel because of missing data. The data on R&D spending relate only to parent firms’ R&D spending, because our data set is nonconsolidated.
For other covariates, such as the number of employees, total assets, total debt, sales, and raw material purchases, we used data from the Nikkei Economic Electronic Database (NEEDS). These financial data are used to control for observable firm heterogeneity. Table 1 reports the summary statistics. Our sample data exhibit substantial variation; for example, the number of employees ranges from 96 to 81,488. This means that we are dealing with heterogeneous firms. The financial data correspond to firms’ fiscal years, which may differ from the calendar year, as in Blonigen and Taylor (2000). Hence, we compiled M&A data that correspond to each firm’s fiscal year.
Table 1: Summary Statistics
Mean St.d. Min Max
Sales (million yen) 275,271 714,112 4,118 4,994,719
Employees 5,368 12,207 96 81,488
R&D (million yen) 22,296 66,984 24 480,500 Number of firms=141
period 1989–1998
Table 2 reports annual M&A, R&D intensity, and the debt–assets ratio. We used total assets as the denominator of R&D intensity. Over the sample period, in Japan, the R&D–GDP ratio was about 2.8 percent (Indicators of Science and Technology, 2002, Ministry of Education, Culture, Sports, Science, and Technology). Thus, the R&D intensity of our sample was about double the national level. We used
the debt–assets ratio to control for the corporate financial aspects of M&A. Highly indebted firms might be unable to acquire other firms because of financial constraints. Given that Klein, Peek, and Rosengren (2002) show that the credit crunch in the Japanese bank loan market is related to decreases in direct investment, this might be important not only for domestic M&A but also for international M&A.
Table 2: M&A, R&D, and Debt–Assets ratio
#Int’l M&A Domestic M&A #U.S. M&A R&D intensity debt–assets ratio
1989 20 7 10 0.0432 0.559
1990 31 6 21 0.045 0.545
1991 30 10 16 0.0454 0.545
1992 27 9 18 0.0475 0.541
1993 20 9 11 0.04771 0.537
1994 16 4 10 0.0464 0.534
1995 21 13 13 0.0456 0.539
1996 17 6 8 0.0465 0.54
1997 19 13 3 0.0491 0.534
1998 26 14 15 0.051 0.516
The information on targeted firms is limited. We can identify the name and the industry, and in some cases, can also identify the amount of money required for acquisition. However, because of data limitations, our study concentrates on acquiring firms’ characteristics and their decisions.
3 Empirical Models
In this section, we consider a firm’s M&A decision problem. In each period, firms decide whether to engage in M&A; a decision that depends on the payoffs involved. We assume that firms choose between:
1) not engaging in M&A; 2) engaging only in domestic M&A; 3) engaging only in U.S. M&A; and 4) engaging in both domestic and U.S. M&A. Hence, the problem for firm i in period t is to maximize the sum of its discounted future profits: maxYi EP∞
t=1βt−1π(Yit,Xit), where E is the expectation operator, β
is a discount factor, π(·,·) is a profit function, Yi = {Yit}∞t=1, and Yit = { no M&A, domestic M&A, U.S.
M&A, both domestic and U.S. M&A}. Then, the Bellman equation is W = max{Vn,Vd,Vu,Vdu}, where Vj = π( j,Xit)+βEW(Yit+1,Xit+1), and Vn,Vd,Vu,and Vdu correspond to no M&A, domestic M&A, U.S.
M&A, and both domestic and U.S. M&A, respectively. For example, if the value of engaging in domestic M&A exceeds the value of behaving otherwise, Vd > Vn,Vd > Vu, and Vd > Vdu,then the firm chooses to engage in domestic M&A.
Instead of solving this dynamic programming problem, we adopt a reduced form approach in order to examine the relationship between R&D intensity and M&A. We use the following specification to express Vjfor firm i in period t:
Vi jt =xitβj+i jt
=β0 jln R&DINTit+β1 jln Debt/Assetit+β2 jln Cap/Labit+β3 jln Employmentit+β4 jProductivityit +δTime Dummiest+i jt, j=n,d, f,and d f,
wherei jtis an error term. R&DINT is R&D intensity. Total assets is the denominator of R&D intensity.
The following is the list of covariates used to control for the standard determinants of M&A and direct investment, with the expected signs of their coefficients in parentheses.
• M&A
– Debt/Assets: total debt divided by total assets is used to capture financial constraints (−:
highly indebted firms are unable to engage in M&A activities).
• Direct Investment
– Cap/Lab: total assets divided by the number of employees is used to control for capital in-
tensity (+: capital-intensive firms have ownership advantages;−: firms with more equipment are less likely to invest abroad).
• Both M&A and Direct Investment
– Productivity: sales minus raw material purchases divided by the number of employees is used
to control for labor productivity (+: productive firms tend to engage in M&A and foreign direct investment).
– Employment: the number of employees is used to control for the size of the firm (+: large
firms tend to engage in M&A and foreign direct investment).
In the estimating equations, because the inclusion of both the exchange rate and the time dummies may create a multicollinearity problem, we include only the time dummies. The time dummies are not merely control variables. They capture common time effects, such as those arising from exchange rate shocks associated with the Asian currency crisis and those arising from macroeconomic shocks associated with the recession in Japan.
The firm’s decision problem is formulated by specifying a discrete choice model, such as a multi- nomial logit model. Given that the standard multinomial logit model exhibits the independence from irrelevant alternatives property, we use a panel data mixed logit model to avoid this problem. The pa- rameters (βj) are assumed to have normal distributions. Then, ifi jt has an independent and identically distributed extreme value distribution, the choice probability is given by:
P(Yit = j|xit)=exp(xitβj)/[ X
h=n,d,u,du
exp(xitβh)] for j= n,d, f, or d f.
The contribution to the likelihood function is Li = R
Πt=Tt=1P(Yit = j|xit) f (β)dβ,where f (·) is the normal density function (see Train (2002)). This panel data mixed logit specification can be used to analyze the firm’s decision of whether not to engage in M&A activities, to engage in domestic M&A, to engage in U.S. M&A, or to engage in both domestic and U.S. M&A.
Following previous studies, because the M&A data are count data and there are many zero obser- vations, for reference, we also use the count data estimation method (see Hausman, Hall, and Griliches (1984) and Blonigen (1997)). We estimate a Poisson regression model. Consider a Poisson process with λitin which the number of M&As is assumed to follow the Poisson distribution. The probability is ex- pressed by Pr(Zit|xi)= exp(−λiteµi)(λiteµi)Zit/Zit!, where Zitis the number of M&As,λit = xitβ, andµiis a firm-specific effect. We estimate the joint probability of Zi1, . . . ,ZiT by using maximum likelihood. For our data, because there is substantial heterogeneity between firms engaging in domestic and U.S. M&A, it is crucial to control for firm heterogeneity. To control for firm-specific effects, we estimate a fixed-effects Poisson regression. We use within-groups estimation for domestic M&A and use generalized method of moments (GMM) estimation for cross-border M&A. For GMM, we employ the quasi-differences estima- tion procedure used by Blundell, Griffith and Windmeijer (2002). In the count data specification, unlike in the multinomial logit specification, we can only analyze the relationship between R&D intensity and one type of M&A. We use either the number of domestic M&As or the number of U.S. M&As as the dependent variable.
4 Results
First, we estimate the Poisson regression model. Then, we estimate the panel mixed logit models, in which the M&A decision is treated as a simultaneous choice between no M&A, domestic M&A, U.S.
M&A, and both domestic and U.S. M&A.
4.1 Count Data Model Estimation
Table 3 reports the results from the Poisson regression. We use counts for domestic M&A and U.S. M&A as dependent variables.
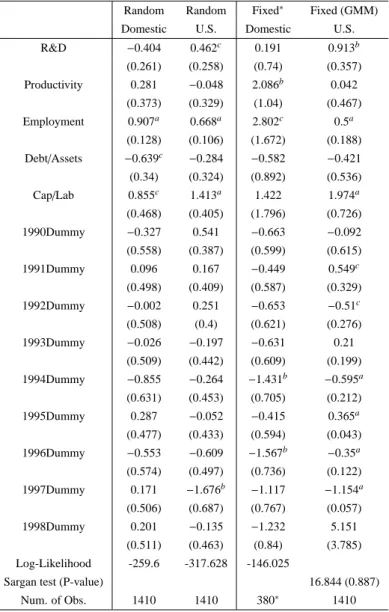
Columns 1 and 2 report the results from the random-effects model. Column 1 shows that domestic M&A is not correlated with R&D intensity; the point estimate is negative. This result might be a con- sequence of the domestic M&A market environment. Firms with active R&D might not freely engage in domestic M&A activities. Column 2 shows that the relationship between U.S. M&A and R&D is positive and significant. The effect on U.S. M&A indicates that firms are required to have technological advantages or absorption capacities for technology.
These results suggest that domestic and U.S. M&A are motivated by different factors. However, this result might be explained by unobservable shocks. If there is a heterogeneous shock to R&D and to the U.S. M&A market, then R&D and U.S. M&A may be correlated without there being an economic relationship between the variables. Although we control for all firms experiencing common time shocks through the use of the time dummies, it is possible that unobservable heterogeneity remains. Hence, we estimate a fixed-effects model. Columns 3 and 4 of Table 3 report the fixed-effects estimation results.
As in the random-effects model, R&D is unrelated to domestic M&A but positively affects U.S. M&A.
Therefore, the finding of a positive relationship between R&D and U.S. M&A activities is robust. This is consistent with the finding of Branstetter (2000) that technology spills over through direct investment in the U.S. To absorb technology, firms must be R&D intensive.
With fixed effects controlled for, time effects are significant. For U.S. M&A, there were negative time shocks in 1992, 1994, 1996, and 1997, and there were positive shocks in 1991 and 1995. In the random- effects model, only the shock for 1997 is significant. This suggests that common year effects and those of unobservable heterogeneity cannot be disentangled in the random-effects specification. Therefore, it is important to control for firm-specific effects.
Productivity, the number of employees, the debt–assets ratio, and the capital–labor ratio have similar effects on domestic and U.S. M&A. Column 3 of Table 3 indicates that productivity has a positive effect on domestic M&A. While R&D is not significantly related to domestic M&A, firms must necessarily be productive to be capable of engaging in M&A activities. With regard to the firm size, it has been documented that large firms tend to engage in M&A activities. Firm size, as measured by the number of employees, positively affects M&A. Column 1 of Table 3 shows that the debt–assets ratio is negatively correlated with domestic M&A. This implies that financial difficulties restrict firms’ M&A activities. The coefficient of the capital–labor ratio is significantly positive, except in the fixed-effects model of domestic M&A. This suggests that firms are required to have technological knowledge, which is related to capital intensity. Ownership advantages imply that capital-intensive firms as well as R&D-intensive firms can invest abroad.
4.2 Panel Mixed Logit Estimation
In the count data estimation, we found no evidence of a relationship between domestic M&A and R&D, but found evidence of a positive relationship between U.S. M&A and R&D. However, this does not necessarily mean that R&D is unrelated to domestic M&A. This finding may have arisen because we cannot take the U.S. M&A decision into account when modeling the domestic M&A decision.
In this section, we estimate mixed logit models that allow decisions about domestic and U.S. M&A to be made simultaneously. This specification has the advantage that it takes into account simultaneous decisions about domestic and U.S. M&A. Table 4 reports the estimation results. The three columns correspond to the decisions to engage in domestic M&A, in U.S. M&A, and in both domestic and U.S.
M&A, respectively. Because the base choice is not to engage in M&A, the results are interpreted relative to this comparison group. The reported coefficients are the mean values of the estimated parameters.
Given that our interest is in the effect of R&D on the choice between domestic M&A and U.S. M&A, we focus on the estimation results relating to the choices of domestic M&A only and U.S. M&A only (see columns 1 and 2).
Column 1 of Table 4 reports the results relating to the domestic M&A decision. R&D has no effect on domestic M&A, which is consistent with the findings from the previous specification. Column 2 relates to the U.S. M&A decision. The results support the ownership advantage or absorption capacity hypothesis for cross-border M&A. R&D-intensive firms tend to engage in international M&A activities but tend not to engage in domestic M&A activities. Thus, firms’ M&A strategies depend on whether M&A is domestic or international. Firms do not simply engage in M&A; rather, they might use domestic M&A to save effort in developing technology whilst using their own technology to absorb foreign technology or to operate in foreign markets.
The estimated effects of the other covariates are similar those in the count data model. Column 1 of Table 4 shows that the debt–assets ratio has a significantly negative effect on domestic M&A. The higher is a firm’s debt–assets ratio, the less likely is the firm to engage in M&A. This finding is consistent with the financial constraints hypothesis. Debt also significantly affects U.S. M&A (see column 2). The determinants of direct investment significantly affect U.S. M&A. Column 2 show that the capital–labor ratio is positively correlated with M&A. This might indicate the effect of ownership advantages. Firms that are more capital intensive might have technology that is better suited to competing in foreign markets.
Thus, capital-intensive firms are more able to engage in international M&A activities.
Firm size is an important determinant of M&A. Although firm size does not significantly affect U.S.
M&A., its effect is otherwise significant and positive. This implies that large firms tend to engage in M&A. The finding that productivity negatively affects U.S. M&A is perverse. However, considering the estimated effect of R&D intensity, firms’ growth strategies may explain this result. A firm that invests in developing future technological advantages may have low productivity because its resources are being devoted to innovation. We find that R&D affects U.S. M&A positively. Therefore, the positive effect of R&D and the negative effect of productivity might reflect firms’ strategies.
In summary, important findings are conveyed by the results reported in this section and those from the count data models. Although domestic M&A is not related to R&D, U.S. M&A is positively related to R&D. This confirms that taking domestic and international M&A into account is important for identifying the effects of R&D on M&A decisions. The standard determinants of M&A and direct investment have explanatory power: the debt–assets ratio negatively affects M&A, and capital-intensive firms are more likely to engage in U.S. M&A. These results are robust to changes in the empirical specification.
5 Conclusion
In this paper, we showed that although there is a weak relationship between domestic M&A and R&D, there is a positive relationship between U.S. M&A and R&D. This suggests that domestic and interna- tional M&A are determined by different factors. Firms choose whether to engage in domestic or U.S.
M&A. Before domestic M&A was deregulated in Japan, institutional regulations and social norms may have constrained firms’ M&A strategies. For U.S. M&A, firms’ absorption capacities and ownership advantages are important.
Our results have important implications for the relationship between productivity and firms’ deci- sions to serve foreign markets. It has been shown that although highly productive firms tend to export, exporters do not necessarily become productive (Clerides, Lach, and Tybout (1998) and Bernard and Jensen (1999)). If R&D and future productivity are positively correlated, our results imply that firms en- gaging in U.S. M&A activities will become highly productive. However, as Clerides, Lach, and Tybout (1998) finds among exporters, servicing foreign markets does not, in itself, improve firms’ productivity.
Therefore, it is important to consider the dynamics of M&A and R&D when analyzing productivity. This requires future research.
References
Bernard, A. B., Jensen, J. B., 1999. Exceptional exporter performance: cause, effect, or both? Journal of International Economics, 47, pp. 1–25.
Bertrand, O., Zuniga, P., 2006. R&D and M&A: are cross-border M&A different? An investigation on OECD countries, International Journal of Industrial Organization, 24, pp. 401–423.
Blonigen, B. A., 1997. Firm-specific assets and the link between exchange rates and foreign direct investment, American Economic Review, 87, pp. 447–465.
Blonigen, B. A., Taylor, C. T., 2000. R&D intensity and acquisitions in high-technology industries: evi- dence from the US electronic and electrical equipment industries. Journal of Industrial Economics, 48, pp. 47–70.
Brainard, S. L., 1997. An empirical assessment of the proximity-concentration trade-offbetween multi- national sales and trade, American Economic Review, 87, pp. 520–544.
Blundell, R., Griffith R., Windmeijer, F., 2002. Individual effects and dynamics in count data models, Journal of Econometrics, 108, pp. 113–131.
Branstetter, L., 2000. Is foreign direct investment a channel of knowledge spillovers? Evidence from Japan’s FDI in the United States, NBER working paper 8015.
Clerides, S. K., Lach, S., Tybout, J. R., 1998. Is learning by exporting important? Micro-dynamic evidence from Colombia, Mexico, and Morocco, Quarterly Journal of Economics, 113, pp. 903–
947.
Cohen, W. M., Levinthal, D. A., 1989. Innovation and learning: the two faces of R&D, Economic Journal, 99, pp. 569–596.
Di Giovanni, J., 2005. What drives capital flows? The case of cross-border M&A activity and financial deepening, Journal of International Economics, 65, pp. 127–149.
Dunning, J., 1981. International production and the multinational enterprise, George Allen and Unwin, London.
Griliches, Z., Mairesse, J., 1985. R&D and productivity growth: comparing Japanese and U.S. manufac- turing firms, NBER working paper 1778.
Hall, B. H., 1987. The effect of takeover activity on corporate research and development, in Auerbach, A. J. ed., Corporate takeovers: causes and consequences, University of Chicago Press, Chicago.
Hausman, J., Hall, B. H., Griliches, Z., 1984. Econometric models for count data with an application to the patents-R&D relationship, Econometrica, 52, pp. 909–938.
Klein, M. W., Peek, J., Rosengren, E. S., 2002. Troubled banks, impaired foreign direct investment: the role of relative access to credit, American Economic Review, 92, pp. 664–682.
Kogut, B., Chang, S. J., 1991. Technological capabilities and Japanese foreign direct investment in the United States, Review of Economics and Statistics, 73, pp. 401–413.
Kogut, B., Chang, S. J., 1996. Platform investments and volatile exchange rates: direct investment in the U.S. by Japanese electronic companies. Review of Economics and Statistics, 79, pp. 221–231.
Milhaupt, C. J., West, M. D., 2001. Institutional change and M&A in Japan: diversity through deals, Columbia Law School, The Center of Law and Economic Studies working paper 193.
Train, K., 2002. Discrete choice methods with simulation, Cambridge University Press, Cambridge, U.K.
Table 3: Count Data Model Estimation
Random Random Fixed∗ Fixed (GMM)
Domestic U.S. Domestic U.S.
R&D −0.404 0.462c 0.191 0.913b
(0.261) (0.258) (0.74) (0.357)
Productivity 0.281 −0.048 2.086b 0.042
(0.373) (0.329) (1.04) (0.467) Employment 0.907a 0.668a 2.802c 0.5a
(0.128) (0.106) (1.672) (0.188) Debt/Assets −0.639c −0.284 −0.582 −0.421 (0.34) (0.324) (0.892) (0.536)
Cap/Lab 0.855c 1.413a 1.422 1.974a
(0.468) (0.405) (1.796) (0.726)
1990Dummy −0.327 0.541 −0.663 −0.092
(0.558) (0.387) (0.599) (0.615)
1991Dummy 0.096 0.167 −0.449 0.549c
(0.498) (0.409) (0.587) (0.329)
1992Dummy −0.002 0.251 −0.653 −0.51c
(0.508) (0.4) (0.621) (0.276)
1993Dummy −0.026 −0.197 −0.631 0.21
(0.509) (0.442) (0.609) (0.199) 1994Dummy −0.855 −0.264 −1.431b −0.595a (0.631) (0.453) (0.705) (0.212)
1995Dummy 0.287 −0.052 −0.415 0.365a
(0.477) (0.433) (0.594) (0.043)
1996Dummy −0.553 −0.609 −1.567b −0.35a
(0.574) (0.497) (0.736) (0.122)
1997Dummy 0.171 −1.676b −1.117 −1.154a
(0.506) (0.687) (0.767) (0.057)
1998Dummy 0.201 −0.135 −1.232 5.151
(0.511) (0.463) (0.84) (3.785) Log-Likelihood -259.6 -317.628 -146.025
Sargan test (P-value) 16.844 (0.887)
Num. of Obs. 1410 1410 380∗ 1410
The numbers in the parentheses are standard errors. The superscriptsa,b, andcindicate statistical significance at the 1 percent, 5 percent, and 10 percent levels, respectively.∗: In the fixed-effects Poisson model, 1,030 zero observations were excluded due to all zero outcomes. For GMM, the instruments are R&Dt−2,R&Dt−3,Productivityt−2, Productivityt−3, and the time dummies.
Table 4: Panel Mixed Logit Estimation
Panel Mixed Logit
Domestic International Both
R&D 0.1 1.02a 1.061b
(0.263) (0.26) (0.478)
Productivity 0.333 −0.628c 0.597
(0.348) (0.327) (0.552)
Employees 0.955a 0.197 1.327a
(0.114) (0.124) (0.22)
Debt −0.901a −0.625c −0.05
(0.308) (0.319) (0.354)
Cap/Lab 0.611 1.74a 2.145a
(0.417) (0.38) (0.667)
1990Dummy −0.562 0.203 2.64a
(0.626) (0.392) (0.384)
1991Dummy −0.031 −0.409 1.05a
(0.524) (0.507) (0.204)
1992Dummy −0.149 0.002 −0.139
(0.463) (0.423) (0.33)
1993Dummy 0.144 −0.112 1.142a
(0.503) (0.425) (0.241)
1994Dummy −1.015b −1.142b −3.619a
(0.48) (0.463) (0.865)
1995Dummy 0.113 −0.846 2.249a
(0.535) (0.53) (0.472)
1996Dummy −1.047c −1.354a 0.647
(0.575) (0.526) (0.832)
1997Dummy −0.432 −11.685a 0.942
(0.524) (0.967) (0.613)
1998Dummy 0.19 −0.291 2.14a
(0.556) (0.492) (0.355)
Constant −18.991a −16.791a −27.012a
(2.2) (1.933) (4.514)
Log-Likelihood −1022.959 Num. of obs. 1410
The numbers in parentheses are standard errors. The superscriptsa,b, andcindicate statistical significance at the 1 percent, 5 percent, and 10 percent levels, respectively.