Ph.D. THESIS
Study on Neutron Attenuation
in Concrete and Steel for Shielding Design of High Energy Hadron Accelerator
Supervisors
Prof. Keisuke Maehata Prof. Nobuhiro Shigyo
Kyushu University, Graduate School of Engineering
Department of Applied Quantum Physics and Nuclear Engineering
Eunji Lee
Contents
Abstract i
Acknowledgements ii
1 Introduction 1
1.1 Interaction of neutrons . . . 2
1.1.1 Low energy neutron interactions . . . 3
1.1.2 High energy neutron interactions . . . 4
1.1.3 Neutron cross section . . . 4
1.1.4 Neutron attenuation . . . 6
1.2 Shielding design of high energy hadron accelerator facilities . . 8
1.2.1 Möyer model . . . 8
1.2.2 Monte Carlo codes . . . 9
1.3 Status of experimental data . . . 12
1.3.1 Experimental facilities and data . . . 12
1.3.2 Instrumentation for neutron spectrum measurement . . 15
1.4 Objective of this thesis . . . 20
2 Evaluation of uncertainty for unfolding method 22 2.1 Experiment . . . 23
2.1.1 Experimental setup . . . 23
2.1.2 Experiment circuit . . . 30
2.2 Data analysis . . . 34
2.2.1 Discrimination of neutron events . . . 34
2.2.2 Neutron detection efficiency and response function . . . 37
2.2.3 Time-of-flight method . . . 41
2.2.4 Unfolding method . . . 45
2.3 Results and discussions . . . 59
3 Shielding experiment at CHARM/CSBF 67
3.1 Overview of CHARM facility . . . 67
3.1.1 Beam parameters and instrumentation . . . 70
3.1.2 Targets . . . 70
3.2 CSBF . . . 73
3.2.1 Composition of concrete and steel . . . 73
3.3 Measurement of neutron activation in CSBF . . . 77
3.4 Measurement of Neutron Energy Spectra by NE213 scintillator 79 3.4.1 Experimental setup . . . 79
3.4.2 Electronics circuit . . . 80
3.4.3 Data analysis . . . 83
3.4.4 Uncertainty . . . 90
3.5 Measurement of Neutron Energy Spectra by Bonner spheres spectrometer . . . 91
3.5.1 Experimental setup . . . 91
3.5.2 Electronics circuit . . . 92
3.5.3 Data analysis . . . 95
4 Computer simulation 103 4.1 Simulation codes . . . 104
4.1.1 PHITS . . . 104
4.1.2 Fluka . . . 106
4.2 Geometry for simulation . . . 109
4.2.1 Geometry of CHARM/CSBF . . . 109
4.2.2 Full geometry . . . 111
4.2.3 Simplified geometry . . . 113
4.3 Calculation . . . 116
4.4 Result . . . 124
4.4.1 Simplified geometry calculation . . . 124
4.4.2 Full geometry calculation . . . 127
4.4.3 Comparison between PHITS and Fluka . . . 129
5 Results and discussions 131 5.1 Evaluation of uncertainty in neutron spectrum measurement . 131 5.2 Neutron energy spectra by shielding experiment . . . 132
5.2.1 Neutron spectra by NE213 scintillator . . . 132
5.2.2 Neutron spectra by BSS . . . 135
5.3 Comparison among experimental data . . . 136
5.3.1 NE213 vs. BSS . . . 136
5.3.2 NE213 vs. activation . . . 138
5.4 Comparisions with simulations . . . 142
5.4.1 NE213 vs. PHITS and Fluka . . . 142
5.4.2 BSS vs. PHITS . . . 145
5.5 Attenuation lengths . . . 147
6 Conclusion 151 References 155 Appendix A 159 Input parameter for PHITS calculation . . . 159
Input parameter for Fluka calculation . . . 160
Abstract
Neutron attenuation in material is one of important processes for radi- ation shielding of a high energy hadron accelerator since significant fraction of dose equivalent to personnel is dominated by neutrons with the energy higher than 20 MeV. The process consists of interactions between shielding material and energetic neutrons generated by successive nuclear reactions of primary and secondary particles. For simplicity, the attenuation process has been described by a single exponential attenuation model based on the results of shielding experiment with assuming spectrum equilibrium. This model has been applied for designing bulk shielding of high energy accel- erator under simple conditions with uniform and thick materials. Recently, the process can be calculated using Monte Carlo (MC) codes with physical models and parameters. The results of the codes should be evaluated with experimental data for correcting ambiguity of the models and parameters, especially for high energy particle interaction. Experimental data that pro- vides not only neutron attenuation but also transition of energy spectrum for various thicknesses of shield are strongly desired since it enables us to dis- cuss spectrum equilibrium and model parameters, in detail.
This thesis aims to obtain experimental data on neutron energy spectra for various thicknesses of common shielding materials to reveal neutron attenu- ation mechanism for energies up to GeV. The methodology to obtain neutron energy spectra through the thick shield was established and applied to mea- surement on neutron attenuation. The data set of neutron energy spectra for various thicknesses of shields and attenuation length for concrete and steel shields were compared with results of MC codes to see differences.
Acknowledgements
The study presented in this dissertation was made possible due to the assistance of a number of people and institutions. I would like to express my sincere gratitude to the following:
To my supervisors of Kyushu university; I would like to thank professor Nobuhiro Shigyo for his precious support that allowed me to pursue study on topics for which I am truly passionate. I would especially like to thank for all of his guidance through this process; discussion, ideas, and feedback have been absolutely invaluable. Without his guidance and encouragement, this study could not be successful.
I express my gratitude to professor Kenji Ishibashi who has retired in 2017, professor Keisuke Maehata who advised and supported me to accom- plish this dissertation as a chair of dissertation committee and professor Naoko Iyomoto.
I would like to co-chair of dissertation committee, professor Nobuo Ikeda and professor Tadahiro Kin.
I am particularly grateful to professor Toshiya Sanami of Japan high en- ergy accelerator research organization (KEK) who is a leader of KEK-CERN shielding experiment program. He gave to me opportunity which made me expressing confidence in my study and meeting other collaborators of his re- search group. He also supervised my study through periodical video meeting during 4 years. Without his continuous guidance, support and encourage- ment, I would not have been able to complete this study.
I would like to thank professor Tsuyoshi Kajimoto of Hiroshima univer- sity for his support in many ways, Dr. Noriaki Nakao of shimizu corporation,
Dr. Hiroshi Yashima of Kyoto university, Dr. Masayuki Hagiwara of KEK, Mr. Takahiro Oyama of KEK and other collaborative member associated with KEK-CERN shielding experiment program.
To my mentor, Dr. Gwang-Min Sun of Korea atomic energy research in- stitute (KAERI), I am deeply indebted to him who laid the gateway for my entering graduate school to Kyushu university and for having introduced me to professor Kenji Ishibashi. I am very lucky to have a mentor who has not only his exceptional proficiencies as a scientist, but also his great personality.
His guidance touched many facets of my life so that I stayed on the right path.
To members of spallation group under professor Nobuhiro Shigyo, both past and present; Mr. Youichi Imahayashi, Mr. Yutaro Itashiki, Mr. Ye Yang, Mr. Koske Imatomi, Mr. Takahiro Mine, Mr. Chihaya Tokumoto and Mr.
Kenta Sugihara for not only constructive scientific discussions we shared, but also performed experiments we partook together. I would especially like to thank Mr. Shogo Izumitani, Mr. Naoki Tokunaga and Mr. Mamoru Kiy- ota. I have been able to accomplish the journal publication because you were supportive.
To all my members in Maehata laboratory, I would like to thank for their help, friendship and their assistance in various ways.
I would like to thank professor Young-You Kim of Kongju university who gave me a lot of advice for my career even after graduation and prayed for me.
Finally, I would especially like to thank my family for the love, support,
1 Introduction
Recently, radiation shield of high energy hadron accelerators, high-intensity spallation neutron sources, and ADS systems has became large and complex structure with increasing the power of accelerators (1).
The radiation shield should be designed to reduce radiation generated through nuclear interactions of incident beam with matter. The radiation are created at high energy hadron accelerator, which promptly creates high energy mixed radiation fields. The radiation fields are characterized by va- riety of secondary particles as neutron, proton, photon, pion, etc. and wide range of energies up to TeV. The energetic particles produce particle showers in matter. Schematic diagram of particle showers by prompt ionizing radia- tion at high energy proton accelerator facility is shown in Fig 1.1.
The radiation fluence and dose outside a shield are dominated by sec- ondary neutrons in the energy range from thermal to GeV and photons. In a case of charged particles, they have a relatively short range, which stops completely in the matter (2). In contrast, high energy neutrons penetrate into a few meters of concrete and primarily contribute to external dose out- side of shield walls. Neutron attenuation in material is important process for radiation shielding of a high energy hadron accelerator since significant fraction of dose equivalent to personnel is dominated by the neutrons the en- ergy of which are more than 20 MeV (3). The attenuation process consists of interactions between shielding material and energetic neutrons generated by successive nuclear reactions of primary and secondary particles. These neu- trons have energies ranging up to the maximum energy of the initial beam and are particularly difficult to attenuate. Therefore, the neutrons are pri- mary concerns for dose to workers, aging of organic materials like insulators, activation of material and radiation triggered failure of electronics.
proton
proton neutron
neutron neutron
β β
γ
γ
γ
Energetic protons
pion
pion β Radioactive
nuclei
Matter
Figure 1.1: Schematic diagram of particle showers by prompt ionizing radia- tion at high energy hadron accelerator facility
1.1 Interaction of neutrons
Neutrons have no charge and therefore cannot occur direct ionization in matter via Coulomb force, which dominates the energy loss mechanism for charged particles and electrons. As a result of the interaction, neutrons may totally disappear and be replaced by secondary radiations, which can cause ionization, so be classified indirect ionizing radiation such as X-rays and γ- rays.
In the attenuation process, neutrons interact with the nucleus, while the γ
result of a neutron collision.
The various types of neutron interactions are occurred according to neu- tron energy ranges. Neutrons are divided into two categories on the basis of their energy and discussed their interaction properties.
1.1.1 Low energy neutron interactions
For low energy neutrons (≤ 20 MeV), the significant interaction in matter is roughly divided into scattering, absorption and neutron-induced nuclear reactions.
Scattering includes elastic scattering and inelastic scattering. Elastic scat- tering [X(n,n)X] is one of the main energy loss mechanism for neutrons up to 1 MeV. The linear momentum and kinetic energy of the system are conserved, however, the neutron can give part of its energy to the recoil nucleus. Inelas- tic scattering [X(n,n0)X∗], means neutron is absorbed by a nucleus and then a compound nucleus is formed emitting a secondary neutron of lower kinetic energy. The nucleus left in an excited state, may decay with aγ-ray emission.
In order that the excitation of the nucleus takes place, the neutron must have energy higher than 1 MeV.
Neutron capture reaction [AZX(n,γ)AZ−1X] is that neutron hits and enters a nucleus, the nucleus get in an excited state and then returns to its ground state by γemission. The capture reaction is more feasible to happen when there are thermal and slow neutrons.
When a neutron is absorbed, the energy of the excitation level of the nu- cleus is high enough to knock away a proton or an αparticle. It is called particle ejection [X(n,x)Y, x = p, α]. The remaining nucleus can continue to be in an excited state and can decay throughγemission. The particle ejection can occur when neutrons are thermal and slow and for light target nucleus.
Fission reaction [(n,f)] can happen when a heavy nucleus absorbs a neu- tron forming a compound nucleus that is excited to such a high energy level
and then is divide into two or more fragments and additionally neutrons.
1.1.2 High energy neutron interactions
In contrast to fission reaction, the spallation of high energy neutrons (20 MeV∼) is not an exothermal process, therefore energetic neutrons are needed to enable spallation reaction. Fig 1.2 shows a schematic diagrams of spalla- tion reaction (4).
The initial collision between the incident particle and the target nucleus leads to a series of direct reactions, which is so-called intra-nuclear cascade, where individual nucleons or small groups of nucleons are ejected from the nucleus. After intra-nuclear cascade, some of high energy hadrons escape as secondary radiation. In the second stage, nuclear de-excitation or evapora- tion takes place, when the excited nucleus relaxes by emitting low energy particles. That is, the energy is released by emitting one or more nucleons or even heavier particles such as neutrons, protons, α particles, light ions, residuals, etc., each with relatively low kinetic energy. This process leaves the nucleus in an excited state that gives off the energy by γ emission.
1.1.3 Neutron cross section
When neutrons have a certain energy, probability per unit path length is a constant for the interaction mechanism. This probability can be expressed in terms of cross sectionσ per nucleus for each interaction. The cross section has units of area and it can be converted into barn [10−28m2].
When the cross section σis multiplied by the number of nuclei N per unit volume, the macroscopic cross section Σ is give by equation 1.1.
Figure 1.2: Schematic diagrams of spallation reaction (4)
section σ. All processes are added the cross sections for each certain interac- tion and are written equation 1.2,
X
tot
= X
scattering
+ X
rad.capture
+ · · ·. (1.2) For example, neutrons have an in/elastic scattering cross sectionPscattering, a radiation capture cross sectionPrad.capture, and so on. The total cross section P
tot is the total probability per unit path length that all type of interactions will be occurred.
Particularly, when considering the cross section of high energy neutrons, the observable characteristic is the total reaction cross section, which is de- fined as the distinction between the total cross section and the total in/elastic cross section as following equation 1.3:
σtot.reaction=σtot−σin/elastic. (1.3) Several semi-empirical expressions and formulas have been derived for the total-elastic or total-inelastic cross sections in equations 1.4and1.5,
σtotal−elastic≈6·A [mb], (1.4)
σtotal−inelastic≈a·A2/3 [mb], (1.5)
whereAis the atomic mass of the target nucleus,a ≈ 30 [mb] forA= 1, and a
≈ 50 [mb] forA> 1(5). This equations are valid for proton or neutron induced spallation reaction.
1.1.4 Neutron attenuation
In a narrow beam attenuation experiment for neutrons, the detected num- ber of neutrons will decrease exponentially with the thickness of matter.
Then the neutron attenuation is derived byequation 1.6, I
I0 =e−Ptott, (1.6)
where I is the detected number of neutrons, I0 is the number of neutrons without matter (initial number) and tis the thickness of matter. Theλ is the neutron mean free path and given by 1/Σtot.
However, in most of the cases neutrons are not narrowly collimated, so the regular shielding simulations involve a broad beam or unfavourable geome-
number of transmitted neutrons and their energy distribution. When consid- ering the rate of reactions induced by neutrons, it is better to use the neutron flux.
Considering neutron velocity ν and the macroscopic cross section Σ for single energy, the interaction frequency for the specific reaction is given as the product νΣ.
Reactions per unit time and volume, called reaction rate density, is given by n(r)νΣ, where n(r) is the neutron number density at the vector position r, and n(r)ν is defined as the neutron flux φ(r) with dimensions of length−2 time−1. Consequently, the reaction rate density is derived by the product of the neutron flux and the macroscopic cross section for a specific reaction, see equation 1.7,
Reaction rate density=φ(r)Σ. (1.7) Equation 1.7 can be converted into an energy-dependent neutron flux φ(r, E) and cross section σ(E) as shown inequation 1.8:
Reaction rate density= Z ∞
0 φ(r, E)σ(E) dE. (1.8)
1.2 Shielding design of high energy hadron accelerator facilities
1.2.1 Möyer model
Shielding design of high energy accelerators has been generally performed by analytical calculations using Möyer model (6),(7), which is based on single exponential attenuation of neutrons and useful to estimate at first.
The concept of Möyer model is based on the spectrum equilibrium, i.e., when neutrons travel deep into shielding material (deep penetration), the distribution of neutron energies does not change for any different thickness of shielding (called spectrum equilibrium). This method is applicable for only the spectrum equilibrium condition, i.e, simple, uniform and thick shielding.
The spectrum equilibrium can be seen for any materials at positions deeper than a certain thickness, and since the energy distribution does not change, neutron attenuation can be written simply independent to neutron energy and represented by only one parameter, attenuation length λ. The Möyer formula is shown in equation 1.9.
𝑥
𝜃𝑟
Incidence Beam Target
Shielding material Detector position
𝑥 cos𝜃
R(r,x)=R0· 1
r2·exp− x cosθ·
ρ
λatt, (1.9)
where R0 is dose as a source term, r is the distance from the source to a shielding calculation position, x is a shielding penetration thickness, ρis a density of shielding material, as shown in Fig 1.3. Attenuation length λatt, the parameter in Möyer model, is calculated by the exponential equation.
The attenuation length depends on the density of shielding material. The neutron attenuation length is shown in Fig 1.4 (8) for mono-energy neutrons in concrete as a function of neutron energy. As can be seen in the figure it reaches a value of about 117 g/cm2 above 200 MeV. When the particle cas- cade through thick shield is carried by mono-energy neutrons above 200 MeV, attenuation length for concrete is equal to the equilibrium for neutrons ener- gies, but decrease rapidly with energies below 200 MeV.
1.2.2 Monte Carlo codes
More detail neutron attenuation can be calculated by three dimensional Monte Carlo (MC) particle transport codes such as PHITS (9), Fluka (10), Geant4 (11), MARS (12) and MCNP (13). These codes are widely used to de- termine the neutron fluxes and dose for different applications with a three dimensional actual and complex geometry.
Simulation methods can be used for engineering design for high energy accelerator shielding with confirmation its validity through extensive bench- marking with experimental data. Thus, for a condition that experimental data have not been provided, estimated neutron fluences with these codes show discrepancies, as shown in Fig 1.5 (14). Uncertainties of MC codes in predictions of neutron energy spectra typically increase with neutron ener- gies, and have to be validated based on experimental benchmark data. Unfor- tunately, the complexity and inherent uncertainty of neutron measurements
Figure 1.4: The variation of the attenuation length for mono-energy neutrons in concrete as a function of neutron energy (8)
increase with energy, which is the main reason for the lack of experimental data for neutron energy spectra above 20 MeV.
Figure 1.5: Discrepancies in neutron energy spectra between MC codes (14)
1.3 Status of experimental data
Estimation of high energy neutron production and transmission through shielding are very important at high energy hadron accelerator facilities be- cause high energy neutrons have high penetrability through shielding and contribute significantly to external dose. Modern MC codes provide reliable predictions of radiation fluences in accelerator facilities even for complicated facility structures. However, accuracies for the production and transmission of secondary neutrons generated by high energy beams, especially above 1 GeV, are not well known because of lack of experimental data. Thus, the experimental data are necessary either for verification of MC codes or esti- mation of the neutron attenuation.
Several experiments were performed to measure high energy neutron spec- trum using various techniques, such as multi-foil activation method, multi- moderator spectrometer (so-called Bonner sphere spectrometer, BSS), time- of-flight (TOF) method with an NE213 liquid scintillator, and an unfolding method with an NE213 liquid scintillator.
1.3.1 Experimental facilities and data
Table 1.1 shows a list of shielding experiments with measuring neutron spectrum above 1 GeV beam energy. The shielding experiment have been carried out for 12 GeV protons at KEK with activation detectors (15), 24 GeV protons at the Brookhaven National Laboratory-Alternating Gradient Syn- chrotron (BNL-AGS) with activation detectors(16), 120 GeV/c mixed beams of protons and pions at the CERN/CERF using Bonner spheres (17),(18) and an NE213 scintillator (3)with the unfolding method, and 120 GeV protons at the FNAL pbar with activation detectors and Bonner spheres (19).
Table 1.1: Summary of shielding experiments with neutron spectrum mea- surement above 1GeV beam energy
(1980)KEK BNL/AGS
(2000) CERN/CERF
(2008) FNAL/Pbar
(2011) CERN/CHARM (2015 ~ )
Particle p+ p+ p+,𝜋+ p+ p+
Energy 12 GeV 24 GeV 120 GeV/c 120 GeV 24 GeV/c
Target Pt Hg Cu Inconel/Cu Cu
Shield [cm]
Conc. 150-250 Iron 0-60 Paraffin 0-90
Conc. 50-500 Iron 25-330
Conc. 80, 160 Iron 40
Conc. 122 Iron 183+
Conc. 0-360 Steel 0-80
Detector Type
NE213
scintillator NE213
scintillator
Activation Activation Activation Activation
Bonner sphere spectrometer
Bonner Sphere spectrometer
Bonner sphere spectrometer
periment program are highest particle energy (24 GeV/c) and the two shield- ing materials (concrete and steel) with various thickness (concrete 0 to 360 cm with 40 cm step and steel 0 to 80 cm with 20 cm step) are used, and results are given as neutron energy spectra outside the shield. The CHARM/CSBF facility has a simple structure of beam line and shielding, and the source term is clearly defined. The data constitute a useful benchmark to verify the accuracy of radiation transport codes.
For example, several experiments with hadron accelerators have been per- formed to obtain the attenuation lengths for concrete and iron (15),(16),(20). If given a value of the precise attenuation lengths for concrete and iron, it would be applicable to shielding design. In Table 1.2, experimental data of attenuation lengths for concrete and iron are given. (Note: All data were measured at 90◦ direction in respect to the incident proton beam.) As shown in Table 1.2, the neutron attenuation length data were dispersed because it
is affected by large uncertainties for high energy neutrons and is limited in available experimental data. Additional experimental data with more detail information are desired to determine attenuation length for spectrum equi- librium condition.
Table 1.2: Experimental data of attenuation lengths for concrete and iron Concrete
Facility Proton energy Detector Density Attenuation length, λ
[GeV] [g/cm3] [g/cm2]
KEK(15) 12 GeV C, Al 3.65 163±7
CERN(20) 25 GeV C, Al 2.35 117±2
BNL/AGS(16) 24 GeV Bi 2.45 90.5
Iron
KEK(15) 12 GeV C, Al 7.08 188±12
CERN(20) 25 GeV C, Al 7.87 147
BNL/AGS(16) 24 GeV Bi 7.74 149
1.3.2 Instrumentation for neutron spectrum measurement
Characteristic of neutron detectors for neutron spectrum measurement are briefly described here.
1. NE213 liquid scintillator
An NE213 liquid scintillator is widely used for neutron measure- ments due to its good pulse shape discrimination and time resolution.
Fig 1.6 illustrates the NE213 liquid scintillator. The liquid scintillator has several advantages like relatively high light output, a reasonably good efficiency for fast neutrons, a fast decay time constants of the light output and it has an additional slow decay components dependent on energy loss density, which can be utilized for discerning the type of par- ticles or radiations.
For this reason, liquid scintillator is suitable for use in a mixedγ-ray and neutron field due to its well-established pulse shape discrimination technique.
NE213 p PM
Neutron
Photon
e-Scintillation light
Figure 1.6: NE213 liquid scintillator
To measure neutron spectrum, the scintillator is used with two meth- ods, time-of-flight (TOF) and unfolding. Fig 1.7 shows the schematic diagram of the both methods.
TOF method has been often applied to measure neutron energy spec- tra. It precisely determines neutron velocity by measuring its flight time, which is defined as time difference between beam pick-up detec- tor and neutron detector signal.
TOF method provide precise neutron energy spectrum from MeV to GeV; however, this method needs a beam trigger signal and constant flight path with certain energy. Therefore, TOF method is not applica- ble in case of shielding experiment conditions by reason of varied flight path and energy in a thick shield.
Unfolding method gives neutron energy spectrum from a few to sev- eral hundreds of MeV with reasonable energy resolution. The unfold- ing method can be used in some situations, e.g. both for the direct and transmitted neutron energy spectrum measurements, without the beam trigger signal. However, this method has raised questionings in terms of the uncertainty in the unfolding process.
L
neutron
!
1) Time-of-Flight (TOF)
2) Unfolding method
Figure 1.7: TOF and unfolding method
2. Activation detectors
Induced radioactivity is applicable to neutron measurement. A sam- ple of such a material is exposed to a fluence of neutrons for a period of time so that the induced radioactivity may be obtained. The mea- sured radioactivities then be employed to deduce information regard- ing the number and energy distribution of neutrons in the radiation fields. Foils or plates of the materials used in this way are called acti- vation detectors.
Activation detectors are applicable in the condition of very high beam intensity, whereas scintillators like an NE213 liquid scintillator re- quire lower beam intensity.
3. Bonner sphere spectrometer (BSS)
A Bonner Sphere spectrometer (BSS) can measure neutron energy spectra in a wide energy range from thermal to 20 MeV or more. BSS has the advantages of high detection efficiency, simple electronics and operation, isotropic response, and photon discrimination. On the other hand, it has disadvantage of poor energy resolution. In addition, initial guess and unfolding process were required to obtain the energy spec- trum from detector response (21),(22). A BSS has been used for shielding experiment since the information of neutron energy spectrum is im- portant. Each sphere has a different response for neutron energy, and the energy giving highest response increases with the sphere diameter.
The energy resolution of BSS is low but enough to see overall energy spectrum. The discrimination with respect to γ-ray and noise is excel- lent with3He gas counter.
γ
γ
27
Al
γ
γ
nat
Bi
Neutron Neutron
𝝰
Figure 1.8: Activation detectors
3
He Gas Counter
Polyethylene Moderate
Neutron
Slowing down…
Figure 1.9: Bonner sphere spectrometer
1.4 Objective of this thesis
As discussed in the former sections, neutron attenuation in material is im- portant process for radiation shielding of a high energy hadron accelerator.
The process consists of interactions between shielding material and energetic neutrons. The attenuation process has been described by single exponen- tial attenuation, Moyer model, based on experimental results with assuming spectrum equilibrium. In additions to this, Monte Carlo (MC) codes with physics models and parameters were developed to calculate the process. The results of the codes should be evaluated using experimental data. For these purpose, experimental data that provides not only neutron attenuation but also transition of energy spectrum are strongly desired since it enables us to discuss spectrum equilibrium and physics model and parameters, in detail.
This thesis aims to obtain experimental data on neutron energy spectra for various thicknesses of common shielding materials, concrete and steel, to reveal neutron attenuation mechanism for energies up to GeV.
An unfolding method with NE213 liquid scintillator (NE213) and Bonner sphere spectrometer (BSS), which covers high energy and middle to low en- ergy regions respectively, were adopted for the spectra measurement. The uncertainty of the unfolding result of NE213 was evaluated experimentally through comparison with that of time of flight (TOF) method for neutrons having similar energy spectrum. The neutron spectra under the shielding experiment were calculated using MC codes of PHITS and Fluka. The com- parison of experimental and calculation results was done to find their differ- ences as a function of neutron energy. The thickness of concrete and steel can be found to obtain spectrum equilibrium. Attenuation coefficient for single exponential attenuation was deduced from the neutron spectrum data.
sults based on various physics models without effects of complex response function due to various nuclear reactions of high energy neutron that is diffi- cult to evaluate experimentally. For these reasons, the experimental data set will help a lot for shielding design of future high energy hadron accelerators.
2 Evaluation of uncertainty for unfolding method
In this chapter, experimental method and result are described to evalu- ate uncertainty of neutron energy spectrum measured by unfolding method which was adopted for shielding experiment described in chapter 3. This re- sults are already summarized and published by author et al. (23).
Unfolding method using NE213 liquid scintillator delivers neutron energy spectrum from a few to several hundreds of MeV with reasonably good en- ergy resolution. The unfolding method can be used both for the source and transmitted neutron measurements. However, this method has raised argu- ments in terms of the uncertainty in the unfolding process. Furthermore, the unfolded spectrum is sensitive to calibration of light output.
In this chapter, the effects of uncertainty of calibration on low light out- put region were examined experimentally. For this purpose, neutron energy spectra determined by Time-of-flight (TOF) method were used as a reference in evaluation of the unfolded spectra. As data of neutron energy spectra, neutron production double-differential cross section (DDX) and thick target neutron yield (TTY) from 100 and 290 MeV/nucleon28Si ion beams on silicon targets were measured at Heavy Ion Medical Accelerator in Chiba (HIMAC), National Institute of Radiological Sciences (NIRS).
2.1 Experiment
2.1.1 Experimental setup
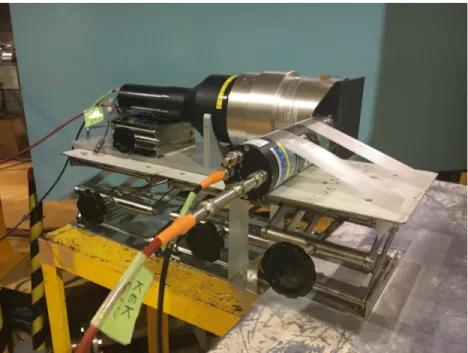
The experimental setup and procedure for TOF measurement were the same as a previous experiment by D. Satoh et al. (24). Fig 2.1 illustrates the experimental setup at the PH2 beam line of Heavy Ion Medical Accelerator in Chiba (HIMAC), National Radiological Science (NIRS).
75° 2.474
m Si Target Si Ion beam
Beamdump
Beam pick up detector (NE102A, 0.5 mm thick)
Veto detector (NE102A, 6 mm thick)
Liquid organic scintillator (NE213, φ 127 mm×127 mm thick)
Figure 2.1: Experimental setup of the PH2 beam line of HIMAC
Beams extracted from the synchrotron. The beams of 28Si ions were set at energies of 100 and 290 MeV/nucleon with a pulse width about 1 sec and each pulse had repetition cycle of 0.3 Hz. The average beam intensity was 3×10⁵ ∼6×10⁵ ions/3.3 s. The beam spot size was less than 10 mm in diame- ter at the target position. The beam passed through a 0.5 mm thick NE102A plastic scintillator as a beam pick-up detector that individually counted the number of incident ions. The output signals of this scintillator were used as trigger (start) signals for the TOF measurement. The beam then hit silicon targets. The targets were 50 mm by 50 mm square, with their thicknesses.
The target thicknesses for DDX were determined that energy loss of the in- cident ions was ∼5% for each beam energy. The targets were placed on the
beam axis being rotated 45◦ to the beam axis in order to reduce the multiple neutron scattering. On the other hand, the thickness of the target for TTYs, called thick target, were thick enough to stop as the beam traverses through the target. Fig 2.2 show photos taken in the PH2 experimental hall of the HIMAC. The thick targets were installed without tilting to the beam axis.
The thicknesses of the targets and densities are listed in Table 2.1.
Table 2.1: Target thicknesses and densities
Ion energy DDX TTY
100 MeV/nucleon 0.5 mm (2.54 g/cm3) 25.0 mm (2.34 g/cm3) 290 MeV/nucleon 3.0 mm (2.38 g/cm3) 50.0 mm (2.33 g/cm3)
DDX Target (a)
(e)
(b)
(c) (d)
Beam pick up detector
(f)
TTY Target
Figure 2.2: Photos taken in the PH2 experimental hall of the HIMAC; (a) PH2 beam line, (b) Phosphor plate for checking beam spot, (c) Image of Beam spot, (d) Beam pick-up detectors, (e) DDX target, (f) TTY target
In order to determine the thickness of the targets, the energy loss of the incident beam in the target and its range were estimated using the Bethe- Bloch formula (25). Fig 2.3 shows the energy loss of28Si in silicon targets for 100 and 290 MeV/nucleon.
For a particle with speedv, chargez (in multiples of the electron charge), and energy E, traveling a distance xinto a target of electron number density n and mean excitation potential I, the relativistic version of the formula is given by the following equation 2.1, in SI units:
−
¿dE dx
À
= 4π mec2·
nz2 β2 ·
µ e2 4πε0
¶2
·
· ln
µ 2mec2β2 I·(1−β2)
−β2
¸
, (2.1)
wherec is the speed of light andε0 is the vacuum permittivity,β=v/c,eand me are the electron charge and rest mass, respectively. Here, the electron density of the material can be calculated by equation 2.2:
n= NA·Z·ρ
A·Mu , (2.2)
whereρ is the density of the material,Zis its atomic number,Ais its relative atomic mass, NA is the Avogadro number andMu is the molar mass constant.
The beam dump was located at 700 cm downstream from the target. The beam dump was made of an aluminum plate (30 cm×30 cm×15 cm) and iron block (100 cm×100 cm×155 cm).
Neutrons were measured using a 12.7 cm long and 12.7 cm in diameter NE213 liquid scintillator. The scintillator was placed at 2.474 m away from the target at 75 degrees with respect to the ion beam axis. A veto detector, a 6 mm in thickness NE102A plastic scintillator, was placed in front of the
0 0.5 1 1.5 2 2.5 Depth [cm]
1 10 102
103
104
105
Deposition Energy [MeV/cm]
0 0.5 1 1.5 2 2.5
Depth [cm]
0 20 40 60 80 100 120
Cumulative Deposition Energy [%]
DDX TTY
0 1 2 3 4 5 6
Depth [cm]
1 10 102
103
104
Deposition Energy [MeV/cm]
0 1 2 3 4 5 6
Depth [cm]
0 20 40 60 80 100 120
Cumulative Deposition Energy [%]
DDX TTY
Figure 2.3: Energy loss of 28Si in silicon targets for 100 (Top) and 290 MeV/nucleon (Bottom)
tor that also scintillated in the veto detector was assumed to be the charged particles (26). Fig 2.4 shows pictures of the detector setup with the NE213 scintillator and veto detector.
Background neutrons were measured separately using an iron shadow bar (25×25×110 cm) that was placed between the target and the NE213 scintilla- tor. The shadow bar removes neutrons coming directly from the target, only allowing background neutrons from room scattering to the neutron detector.
The length of shadow bar was determined to reduce neutrons by less than 1/1000 according to Monte Carlo simulation. About 1/4 to 1/3 of the total beam time were spent measuring the background measurements. Fig 2.5 and 2.6show setups of the foreground and background measurements.
Figure 2.4: Detectors setup with the NE213 scintillator and veto detector
Figure 2.5: Foreground measurement
Figure 2.6: Background measurement
2.1.2 Experiment circuit
Fig 2.7shows the simplified block diagram of electronic circuit used in the experiment; it consisted of standard NIM (27) and VME data taking system.
CAMAC system have been generally used, however, easily affected by the dead time at above counting rate of about a few of 1,000 counts/s. In the other hand, VME system have higher performance for high counting rate and fast switching time than the CAMAC module. The VME module accepts count rate up to about 7,000 counts/s or more without dead time. The abbreviations used in this section for the NIM and VME modules are listed in Table 2.2.
Table 2.2: NIM and VME modules NIM modules
Abbreviation Name
DIV Divider
DL Delay
CFD Constant Fraction Discrimination
G.G. Gate Generator
FAN IN/OUT FAN IN FAN OUT
COIN Coicidence
VME systems
Abbreviation Name
QDC Charge-to-digital converter TDC Time-to-digital converter
Inverse-TOF method was adopted in this experiment. Data of light out- put integrated with specific gate widths, and flight time triggered by coinci-
QDC Event Cancel
QDC Beam Gate
Event Cancel Gate B0 NE213 Veto
DIV DL
DL Scaler (Beam)COIN (2) DL
COIN (1)CFDDIV
G.G. 1
CFDDL Scaler (Event Cancel) DL
TDC Stop DL
FAN IN/OUT300 ns 40 ns40 nsCFD QDC Beam 200 ns 160 ns
QDC Total Gate QDC Veto Gate QDC Slow Gate
FAN IN/OUTTDC Start QDC Total QDC Veto
QDC Slow
DIV
Scaler (NE213)
380 ns 300 ns veto
G.G. 2 G.G. 3 G.G. 4 G.G. 5 G.G. 6
G.G. 7
Figure 2.7: Schematic of the electric circuit for taking data
ate a 40 ns long logic pulse that was then sent to Coin (1). The number of events detected on the neutron detector was obtained by counting the Coin (1) event as real events. The coincidence between CFD and the 300 ns long logic pulse from the beam pick-up detector (B0), generated an output logic pulse. The pulse from Fan-in/out fed into one of G.G.4 to generate 1.2 µs long gate for counting events transferred to the computer. TDC was employed to obtain the time difference between signals of the B0 and the NE213 scin- tillator for TOF measurement. The start signal of the TOF was the NE213 scintillator. The stop was the B0 with a 380 ns delay, which is used at Coin (2) to coincident with the NE213 scintillator. The other outputs of CFD were used for G.G.5 and G.G.6 to generate total gate and slow gate. Two values obtained by integrating a signal using the gates were acquired using QDC.
The total gate, whose width was 200 ns, was for total components of the sig- nal, and the slow gate with 160 ns length and 40 ns delay was for the tail component. Neutron and γ-ray events were separated by pulse shape dis- crimination (PSD) method using QDC values (28). Fig 2.8shows schematic of the PSD method for discrimination of neutron and γ-ray events. Since den- sity of deposition energy of protons is larger than that of electrons, the tail component for neutron event was larger than that of γ-ray when the values of total integrated signal for both events were the same.
Signals were recorded event-by-event. More than 99.9% of events were recorded by the computer during data-acquisition runs.
P u lse H e ig h t
Time
Slow gate Total gate
𝛄-ray
Neutron
Figure 2.8: Schematic of the pulse shape discrimination (PSD) method
2.2 Data analysis
2.2.1 Discrimination of neutron events
Fig 2.9 (a)shows the QDC distribution of the beam pick-up detector. To de- termine the number of ion on the target, the number of events were counted individually according to QDC distribution of the B0 detector. Events that two or more ions were incident simultaneously above 410 ch in the figure, rejected as multiple incident events and gave larger light outputs compared with the single incident events. The beam intensity was controlled to reduce the number of the multiple incident events to be less than around 10 % of that of the single ones.
To select uncharged particles, i.e., neutron and γ-ray events, signal of the veto detector was used. Since charged particles cause large light outputs in the veto detector, and they could be distinguished from those of uncharged particles. Fig 2.9 (b) shows the QDC distribution of the veto detector. A sharp peak around 100 ch by uncharged particles was observed in the lower QDC values region. Uncharged particle events were selected by picking data lower QDC values than 1352 ch.
After applying discrimination of charged and uncharged particles, neutron events were separated from γ-ray using a ratio of QDC values with the total and slow gates. Fig 2.9 (c) shows a graphical scatter plot of QDC values in two gates. Neutrons and γ-rays interact with protons and electrons in the NE213 scintillator, respectively, and are detected through energy deposition of protons and electrons. The threshold level distinguishing neutron events from γ-ray events was set to 1.072 MeVee (MeVee: MeV electron equivalent) that was determined through measurement of the Compton edge of γ-ray from a 60Co source which corresponding to 2.81 MeV in proton energy. The
pulse. The time constant at the output of signal became different due to vari- ations in amplitude and rise time of input pulse, and it leads to time walk.
Fig 2.9 (d) shows time walk of uncharged particles in the TDC and total QDC spectrum. Time walk correction was performed using the scatter plot.
According to this correction, the events with the larger QDC value shifted to the lower TDC value.
QDC [ch]
0 200 400 600 800 1000 1200 1400
Counts
1 10 102
103 detector 0
Single ion incidence Two or more ions incidence
TDC [ch]
4000 4500 5000 5500 6000
QDC [ch]
0 1000 2000 3000 4000
5000 hist2
Entries 64204 Mean x 5409 Mean y 160.7 Std Dev x 696.6 Std Dev y 168.9
1 10 102
103
hist2 Entries 64204 Mean x 5409 Mean y 160.7 Std Dev x 696.6 Std Dev y 168.9 detector 75 degree
Time walk prompt γ-ray
QDC total gate [ch]
0 100 200 300 400 500 600
QDC slow gate [ch]
20 40 60 80 100 120 140 160
0 50 100 150 200 250
PSD
𝛾-ray Neutron
Threshold Level (60Co)
0 1000 2000 3000 4000
QDC [ch]
1 10 102
103
104
105
Counts
Veto 1 Non-charged particle events
Charged particle events
(a) (b)
(c) (d)
Figure 2.9: Data analysis in the case of 100 MeV/u28Si incidence on a Si thin target; (a) QDC distribution of the beam pick-up detector, (b) QDC distribu- tion of the veto detector, (c) Discrimination of neutron and γ-ray events in the lower QDC values area, (d) Time walk of uncharged particles in the TDC and total QDC spectrum
2.2.2 Neutron detection efficiency and response function
The neutron detection efficiency for the TOF method, and a response func- tion for the unfolding method are necessary to determine the absolute mag- nitude and shape of neutron spectra. They were obtained using a computer simulation code SCINFUL-QMD (29), which was modified by Kajimoto et al
(30). The code reproduces the experimental data(31) well across a wide energy range, with the exception of around 150 MeV. The code is able to simulate the deposition energy imparted by the charged particles produced from reactions between neutrons and nuclei in the scintillator. The deposition energy was converted into light output (MeV electron equivalent energy, MeVee) using equation 2.3by Nakao et al. (32):
Le=0.81Ep−2.43¡1.0−exp(−0.20Ep)¢, (2.3)
where Le[MeVee] is light output by electron, and this unit means that the energy applied to the electrons upon incidence of γ-rays corresponding to the amount of luminescence equivalent to that of the neutron energy given in the detector. Ep is deposition energy of recoiled proton. Then the code gives a light output spectrum, called response function, expressed in the unit of electron equivalent energy. The light output spectrum was obtained by the incident particles and normalized for various neutron energies En[MeV].
The detection efficiency ε(En) is obtained by integrating the light output spectrum above the threshold level by using equation 2.4:
ε(En)= Z ∞
Emin
R(En,Le)dEe, (2.4)
where ε(En) is the detection efficiency for En[MeV] neutron, Emin is the threshold level of light output,R(En,Le) is the response function forEn[MeV]
neutron.
Fig 2.10 shows examples of response functions. Neutrons isotropically emitted from a point source 3 m away from the scintillator surface were used as incident neutrons. The neutron energy region between 0 and 1 GeV was divided into 200 steps in a linear interval. The scoring region is same as when calculating the detection efficiency for TOF method.
The detection efficiency was obtained by integrating the response function above a threshold level of light output. In this analysis, the threshold level was set to 1.072 MeVee, which was determined from measurement of the Compton edge of gamma rays from a 60Co source. The light output values, MeVee, at the position of Compton edge were derived from the empirical for- mula proposed by Dietze and Klein(33). Fig 2.11shows the neutron detection efficiency calculated using this threshold level for each beam energy. A peak found at 150 MeV comes from the change in the nuclear reaction model in the code of the SCINFUL original database to Quantum Molecular Dynam- ics (QMD) reaction model (29).
0 20 40 60 80 100
Light output [MeVee]
-4
10
-3
10
-2
10
-1
10 1
Response [n/MeVee/incidence]
En [MeV]
7.943 19.95 50.12 79.43 100.0 199.5
Figure 2.10: Response function
1 10 102 103 Neutron Energy [MeV]
0 0.05 0.1 0.15
0.2 0.25 0.3 0.35
Neutron detection efficiency [counts/neutron]
Co-60 Am-Be
Figure 2.11: Efficiency
2.2.3 Time-of-flight method
Fig 2.12 shows an example of the inverse-TOF spectrum obtained for the thin Si target with 100 MeV/nucleon silicon ion incidence after the charged particle events were excluded. The blue spectrum indicates normal TOF spectrum. The peak of prompt γ-ray appears at 5998 ch of the spectrum.
The horizontal axis is the time difference between the start signal from the NE213 scintillator and the stop one from the beam pick-up detector. The neutron kinetic energy En was determined by the followingequation 2.5:
En=mnc2
1 r
1−³ct L
n−γ+L
´2−1
, (2.5)
where En is the neutron kinetic energy, mnc2 is the rest mass of the neutron, L is the distance from the center of the target to the center of the detector, and tn−γ is the difference between the flight time of the prompt γ-ray and neutron.
The energy resolution of the TOF measurement depends on geometric and time components, and is given by the following equation 2.6:
∆En
En =γ(γ+1) s
µ∆L L
¶2
+ µ∆t
t
¶2
, (2.6)
where ∆En/En denotes the energy resolution, γrefers to the Lorentz factor, the geometrical component ∆L was derived from the thickness of the target and neutron detector, L is the flight path, ∆t is the time resolution, and t is the time-of-flight. The time resolution was estimated by the measurement of the Full Width at Half Maximum (FWHM) of the prompt γ-ray peak.
Fig 2.13 shows four results of the energy resolution for DDXs and TTYs by 100 and 290 MeV/nucleon 28Si ion beams, whose time resolution were
TDC [ch]
3500 4000 4500 5000 5500 6000
Counts
10
210
3counts/time
Prompt 𝛾-ray peak
Neutron + 𝛾-ray
Figure 2.12: Inverse-TOF spectrum from the thin Si target bombarded by 100 MeV/nucleon
0.9 ns (100 MeV/nucleon DDX), 0.5 ns (100 MeV/nucleon TTY), 0.5 ns (290 MeV/nucleon DDX), 0.4 ns (290 MeV/nucleon TTY), respectively, with the flight path length of 2.474 m.
Neutron Energy [MeV]
10 102 103
Energy Resolution [%]
10102
100MeV/u DDX 100MeV/u TTY 290MeV/u DDX 290MeV/u TTY
Figure 2.13: Energy resolutions of TOF spectrum
Table 2.3 shows the energy resolutions as a function of neutron energy.
Energy resolution improves as the neutron energy decreases, so the values listed in Table 2.3 show the upper limits of neutron energy resolution.
The minimum bin width of neutron spectra was set to be equal to or greater than the energy resolution.
After obtaining the neutron TOF spectra, they are converted to energy spectra, using relativistic kinematics. The number of events at each neutron energy is corrected for the energy-dependent neutron detection efficiency.
Neutron energy spectra were converted to DDX d2σ/dEdΩ and TTY using
Table 2.3: Energy resolutions for neutron energies
% for En = 50 % for En = 100 % forEn = 150
100 MeV/u DDX 12.2 19.9 28.4
100 MeV/u TTY 8.7 12.9 17.6
290 MeV/u DDX 8.8 13.3 18.5
290 MeV/u TTY 9.4 12.6 16.5
the following equations 2.7and2.8:
d2σ
dEdΩ(E)= Nn(En)
Nion·ε·ρ·∆Ω·∆E, (2.7)
T TY(E)= Nn(En)
Nion·ε·∆Ω·∆E, (2.8)
where Nn is the number of detected neutrons at the energyEn,ρ is the areal density of the target, Nion is the number of incident ions, ε is the neutron detection efficiency, ∆Ω is the detector solid angle, and ∆E is the energy bin width. The normalized counts obtained from the background data measured with the shadow bars were subtracted from the normalized counts obtained from the foreground data measured without iron shadow bar.
2.2.4 Unfolding method
The dataset used for the TOF data analysis were processed with the follow- ing procedures to deduce neutron energy spectrum using unfolding method:
1) selection of neutron events for a single ion using the same procedure de- scribed in section 2.2.1; 2) calibration of QDC value with the total gate to light output; 3) spectrum unfolding using the RooUnfold package(34) with an iterative Bayesian algorithm. Fig 2.14 (a) DDX and (b)TTY for 100 MeV/u
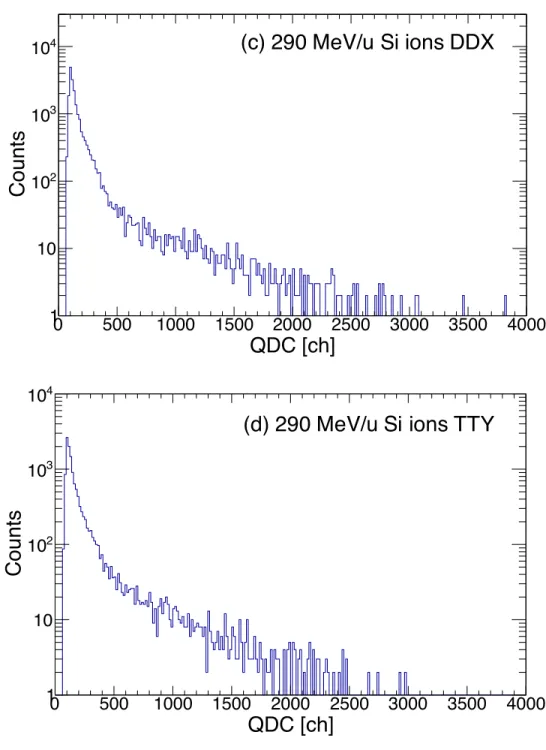
28Si ions and Fig 2.15 (c) DDX and (d) TTY for 290 MeV/u 28Si ions show the QDC distribution of total gate for neutron events.
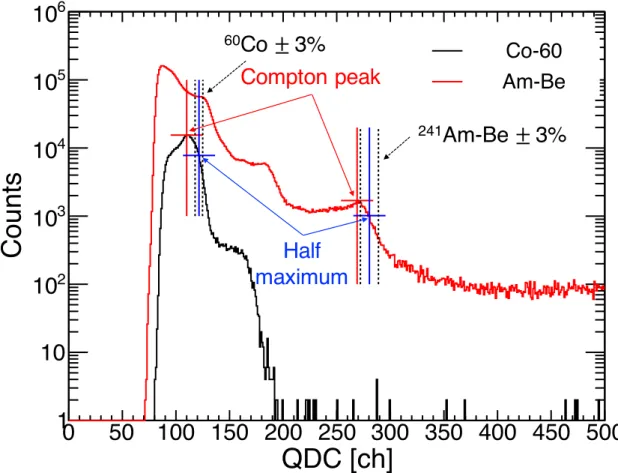
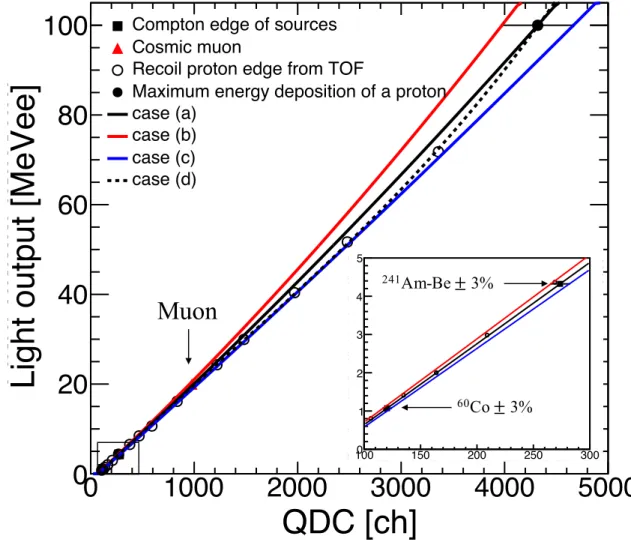
The QDC values were converted into light output in MeVee in prior to the unfolding. For the channel to light output conversion, four calibrations were used. Fig 2.16 shows QDC distributions for γ-rays of 60Co and 241Am- Be sources. Compton edges of γ-rays were observed. The calibration points were channel at half height of the Compton edge and the energy of Compton edge(35). The dashed line inFig 2.16indicates uncertainties for the Compton edges determined from the following procedure.
The illustration for the determination of the Compton edges is shown in Fig 2.17. N0 is the maximum counts around the edge, referred as peak, and X0 is the channel at the half of the maximum counts. The number of events in the distribution changes from 2/3N0 to 1/3N0 when the channel changes 3
% from X0 in case ofγ-rays from 241Am-Be source in Fig 2.17.
The maximum uncertainty in determination of X0 with this assumption is 3 % in this study. For the sufficient statistics, more than 1000 events at the Compton peak were accumulated. The Compton edges of γ-rays have energies of 1.253 MeV (average of 1.173 and 1.333 MeV) of 60Co and 4.439 MeV of241Am-Be sources.
0 500 1000 1500 2000 2500 3000 3500 4000
QDC [ch]
1 10 102
103
104
Counts
(b) 100 MeV/u Si ions TTY
0 500 1000 1500 2000 2500 3000 3500 4000
QDC [ch]
1 10 102
103
104
Counts
(a) 100 MeV/u Si ions DDX
Figure 2.14: QDC distribution of total gate for neutron events for (a) thin and
0 500 1000 1500 2000 2500 3000 3500 4000
QDC [ch]
1 10 102
103
104
Counts
(d) 290 MeV/u Si ions TTY
0 500 1000 1500 2000 2500 3000 3500 4000
QDC [ch]
1 10 102
103
104
Counts
(c) 290 MeV/u Si ions DDX
Figure 2.15: QDC distribution of total gate for neutron events for (a) thin and (b) thick silicon from 290 MeV/nucleon Si ion incidence
0 50 100 150 200 250 300 350 400 450 500
QDC [ch]
1 10 102
103
104
105
106
Counts
Co-60 Am-Be
60Co ± 3%
241Am-Be ± 3%
Compton peak
Half maximum
Figure 2.16: QDC distributions of total gate measured by60Co and for241Am- Be sources
Half maximum, 1/2 N
02/3 N
01/3 N
0Maximum, N
0± 3%
Compton peak X
0C o u n ts (l o g sca le )
QDC [ch]
Figure 2.17: The uncertainty determination of the half maximum position X0
in schematic Compton spectrum