九州大学学術情報リポジトリ
Kyushu University Institutional Repository
高密度下におけるヤクシカ個体群の栄養生態
黒岩, 亜梨花
https://doi.org/10.15017/1831396
出版情報:Kyushu University, 2017, 博士(理学), 課程博士 バージョン:
権利関係:
Nutritional ecology of the Yakushika (Cervus nippon yakushimae) population under high density
Arika Kuroiwa
Graduate school of Systems Life Sciences, Kyushu University
i
Abstract
Over the last decade, the population of Yakushika (Cervus nippon yakushimae) endemic to Yakushima, a small island of 504 km2, has rapidly increased to
approximately 30,000 individuals. Consequently, abundance and biomass of many understory plant species have been decreased. However, Yakushika still maintains high density despite low availability of food in understory vegetation. It remains uncertain how individuals in the high density population of Yakushika obtain nutrients under the food-limited habitats. Here, I tested a hypothesis that the high density population of Yakushika obtains nutrients by eating unpalatable plants and fallen leaves. First, I determined kidney fat index for 76 individuals to confirm whether the high density Yakushika population maintains good nutritional conditions. Second, I identified plant species of stomach contents with next-generation sequencing of the stomach DNA samples and clarified what they ate in food-limited habitats. Third, I experimentally observed deer preference to nine categories of plants: young leaves, mature leaves and fallen leaves of a palatable, a semi-palatable and an unpalatable species. Fourth, I directly observed deer preference to seedlings, fresh leaves or fallen leaves of nine plant species. Yakushika showed a high nutritional status even in the high density area, suggesting that they obtained enough food resources.
ii
In the DNA analysis of stomach contents, there was no significant tendency that the proportion of unpalatable plants increased with deer density. In addition,
between-population dissimilarities of plant species composition in stomach contents in each region significantly varied with season, but not with deer density, suggesting that a similar set of plants are used in both low and high density areas. On the other hand, within-population dissimilarities of plant species composition in stomach contents increased with deer density, suggesting that individuals in higher density populations reduced competition by foraging on different plants as food resources. Choice
experiments in high density areas revealed that Yakushika prefer young leaves to mature or fallen leaves for unpalatable plants. On the other hand, direct observations revealed that individuals in a high density population of Yakushika mainly used mature leaves of unpalatable plant species and sometimes used fallen leaves of unpalatable plant species.
It is presumed that Yakushika prefered young leaves, but started to use mature and fallen leaves. These results suggest that the high density population of Yakushika is maintained under apparently food-limited habitats by using mature and fallen leaves of unpalatable plant species that were not frequently used before.
iii
Acknowledgments
I wish to express my gratitude and indebtedness to Professor Tetsukazu Yahara for his valuable advice throughout the study. I would like to thank Dr. Eiiti Kasuya and Dr.
Akiko Satake for giving insightful comments and suggestions. Special thanks go to Dr.
Misako Kuroe, for her support and cooperation in the field work and helpful discussion and advice on the manuscript. I thank members of the hunting communities of Yakushima and staffs of Yakushima Forestry Ecosystem Conservation Center and Yakushima Forestry Administration Station for allowing us sampling stomach contents and kidneys from killed individuals. I also thank the Service Centre of the Elementary Analysis of Organic Compounds, Faculty of Science, Kyushu University for conducting elementary analysis of our samples, Dr. Junko Kusumi of Graduate School of Social and Cultural Studies Research at Kyushu University and Dr. Yu Matsuki and Dr. Yoshihisa Suyama at the laboratory of Tohoku University for cooperating with DNA barcoding using a next generation sequencer and Chisato Terada, Toshihiro Saito, Satoshi Tagawa and Kengo Fuse for their help in the field works in Yakushima Island and their encouragements to and fruitful comments on our study. I also thank Firouzeh Javadi who corrected the English. Finally, I thank all the members of the ecological laboratory of Kyushu University for their constructive comments and warm encouragement.
1
Table of Contents
Abstract: i – ii
Acknowledgments: iii
Table of Contents: 1 - 2
General Introduction General introduction: 3 - 5 References: 6 - 7
Chapter 1 Effects of density, season, and food intake on sika deer nutrition on Yakushima Island, Japan
Introduction: 8 - 11
Materials and methods: 12 - 18 Results: 19 - 21
Discussion: 21 - 25 References: 26 - 33
Figures and Tables: 34 – 45
Chapter 2 Food habit of sika deer under high density on Yakushima Island, Japan Introduction: 46 - 48
2
Materials and methods: 49 - 51 Results: 51 - 53
Discussion: 53 - 60 References: 61 - 63
Figures and Tables: 64 - 72
Chapter 3 Preference of Cervus nippon yakushimae for young, mature and fallen leaves: experimental tests and field observations
Introduction: 73 - 75
Materials and methods: 75 - 77 Results: 78 - 79
Discussion: 79 - 81 References: 82 - 83
Figures and Tables: 84 - 87
General discussion
General discussion: 88 - 89
3
General Introduction
The population of sika deer (Cervus nippon) has been rapidly increased since the 1970s in Japan (Takatsuki 2006). Consequently, in addition to agricultural damages, native plant species preferred by sika deer have been decreased under browsing and forest regeneration is often prevented by feeding of sika deer (Nomiya et al. 2003;
Takatsuki 2009). These feeding damages are serious in Yakushima, a small island of 504 km2 registered as a world natural heritage area in 1993, where the unique flora including 47 endemic species, 31 endemic subspecies or varieties (Yumoto 2013) is developed.
Some of those endemic plant taxa are, however, damaged by yakusika (Cervus nippon yakushimae), an endemic subspecies (Yahara 2005).
Furthermore, many other plant species in forest understory including
threatened species have been seriously decreased under the increasing browsing
pressure and some tolerant species against deer browsing have been increased
(Biodiversity Center of Japan 2009; The Ministry of the Environment 2009, 2010). In
addition, agricultural damages amounted to 24 million yen in 2012.
In response to these damages, population management of yakushika started in
2009 by the Forest Agency and the Ministry of Environment under the supervision of
the Science Committee of the Yakushima World Natural Heritage area. Following this
4
effort, Kagoshima Prefecture developed a detailed management plan of yakushika from
2012 to 2016 under Wildlife Protection and Proper Hunting Act, with a tentative goal to
reduce the density to 20 head/km2, a level that will be adaptively adjusted in future. This
goal was determined by considering that density least disruptive to ecosystem is 3-5
head/km2 in the mainland Japan (The Ministry of the Environment 2010) but tree
species richness is maximal around 20 head/km2 level in Yakushima Island (Koda et al.
2008). Under this goal, the detailed management plan of Kagoshima Prefecture
estimated the total population to be 16, 015 and determined efforts required for reducing
this population to 9,063 until 2016 using a model of population dynamics. Under this
management plan, hunting pressure was intensified from 2,795 in 2011 to 4,982 in 2012,
but deer still maintain high density (Yaku sika Working Group of the Science
Committee of the Yakushima World Natural Heritage area 2013).
In order to solve this problem, it is necessary to clarify how Yakushika individuals in the high density population obtain nutrients under the food-limited habitats. This issue can be clarified byexamining the nutritional status and food habits of Yakushika.
The population density of Yakusika s is known to vary among regions from 4.6 - 161.2 head/km2. It is likely that nutrient conditions and food habits of deer individuals
5
vary with density. Considering this variation in mind, I tested a hypothesis that Yakushika individuals in the high density population obtains nutrients by eating unpalatable plants and fallen leaves. First, I determined kidney fat index for 76 individuals to confirm whether the high density Yakushika population maintains good nutritional conditions. Second, I identified plant species of stomach contents with next-generation sequencing of the stomach DNA samples and clarified what they ate in food-limited habitats. Third, I experimentally observed deer preference to nine categories of plants: young leaves, mature leaves and fallen leaves of a palatable, a semi-palatable and an unpalatable species. Fourth, I directly observed deer preference to seedlings, fresh leaves or fallen leaves of nine plant species.
6
References
Biodiversity Center of Japan (2009). The report of biodiversity investigation
(Kagoshima Prefecture) in Japanese.
Koda, R., Noma, N., Tsujino, R., Umeki, K., & Fujita, N. (2008). Effects of sika deer (Cervus nippon yakushimae) population growth on saplings in an evergreen broad-leaved forest. Forest ecology and management, 256(3), 431-437.
Nomiya, H., Suzuki, W., & Kanazashi, T. (2003). The response of forest floor vegetation and tree regeneration to deer exclusion and disturbance in a riparian deciduous forest, central Japan. Plant Ecology. (16): 263-276.
Takatsuki, S (2006). Ecological history of Sika deer, Natural history (in Japanese).
University of Tokyo Press.
Takatsuki, S. (2009). Effects of sika deer on vegetation in Japan: a review. Biological Conservation. (142): 1922–1929.
The Ministry of Environment (2009). The protect and management plan of sika deer in Odaigahara (in Japanese)
The Ministry of the Environment (2010). The guideline for developing specific birds
7
and beasts (sika) protection and management plan in Japanese.
Yahara, T (2005). The increase of sika deer and the extinction risk of native plants.
Matsuda, H & Yumoto, T eds. Bun-ichi Co,. Ltd. pp 168-187.
Yumoto, T (2013). Water boon – Yakushima in Japanese. Masuzawa, T, Sawada, H and Konami, Y, eds. Bun-ichi Co,. Ltd. pp 44-55.
8
Chapter 1 Effects of density, season, and food intake on sika deer nutrition on Yakushima Island, Japan
Introduction
It has been well documented that population dynamics of herbivores, such as deer, strongly depend on winter mortality (Clutton-Block et al. 1985; Loisson and Langvatn 1998; Loisson et al. 1999). The deer populations in the higher latitude suffer large fluctuation reflecting severe limitation of food resources and high winter mortality (Hansson and Henttonen 1985; Bjornstad et al. 1995; Kaji et al. 2004), compared with populations in the low latitude where high fluctuations are rarely occurred under lower and more stable winter mortality (Lord 1960; Hansson and Henttonen 1985; Bjornstad et al. 1995). Sika deer (Cervus nippon) provides a good example of species living under markedly different food availability at the higher and lower latitudes.
Cervus nippon is widely distributed in the main islands of Japan, from
Hokkaido, where the lowland is covered with snow even in winter, to Kyushu district where the lowland snow is rarely seen in winter. The sika deer populations have rapidly increased since the 1970s in many regions of Japan including Hokkaido and Kyushu (Takatsuki 2009a). Subsequently, the vegetation coverage has been rapidly reduced
9
under the increasing grazing or browsing pressure both in Hokkaido (Kaji et al. 1988) and also in the Kyushu district (in Yakushima Island; Koda et al. 2008; Onoda & Yahara 2015), leading to less food available for C. nippon.
In Hokkaido, the isolated population of C. n. yesoensis in the Nakanoshima Island, an island in the center of Toya Lake has experienced a large fluctuation and mass winter mortality (Kaji et al. 1988). After three deer individuals were introduced to the island in 1950s to 1960s, population of C. n. yesoensis has continued to grow at a rate of 16 % per year over the 20 years and deer density reached as high as 60 head/km2 in the fall of 1983, accompanied with large reduction of vegetation coverage. Consequently, the deer population suffered mass mortality by which the population declined from 299 in the fall of 1983 to 137 in the winter of 1984 (Kaji et al. 1988). Mass mortality under high density has also reported in other areas. For instance, the population of C. n.
yesoensis in Shiretoko (Hokkaido, Japan) declined from 592 deer in 1998 to 177 deer in
1999 (Kaji et al. 2004). In C. n. centralis, 309 out of 688 heads have starved to death due to food shortages in the cold winter of 1984 in Kinkazan (northern Honshu, Japan) (Takatsuki et al. 1994).
In northern Japan, sever winter food limits impacts nutritional food restriction of deer, which led to mass mortality (Yokoyama et al. 2000; Takahashi & Kaji 2001). In
10
northern Honshu, C. n. centralis are able to accumulate kidney fat in summer only, consumes it in winter, and became gradually thinner during winter (Takatsuki 2000).
On the other hand, wide fluctuation of C. nippon populations in the Kyushu district had never been documented. For instance, in C. n. mageshimae endemic to Mage Island (south of the Kyushu Island, Japan), mortality gradually increased and density reached to 52 head/km2, but deer population has not crashed (Tatsuzawa 2004).
For C. n. yakushimae endemic to Yakushima Island, an island adjacent to Mageshima Island, density in the western coastal area increased to 161.2 head/km2 (Kyushu Regional Environment Office 2013), but mass mortality has not been observed there despite large decline of vegetation coverage (Koda et al. 2008).
In southern Japan including two islands of the Kyushu district (as mentioned above), the deer nutritional status is presumed not to decrease because of food plant resources are available even in winter (Takatsuki 2009b). However, this hypothesis has never been tested. In this study, I therefore examined this hypothesis by measuring the seasonal changes of kidney fat index (Riney 1955) as an indicator of nutritional status in C. nippon (Maruyama 1985; Yokoyama et al. 2003). If the kidney fat index does not
decrease in winter, the C. n. yakushimae population is expected to increase further, implying that it is necessary to take some measures for preventing further loss of
11
understory vegetation in Yakushima Island.
The population density of C. n. yakushimae in Yakushima Island varies from 4.6–161.2 head/km2 in different areas of the Yakushima Island (Kyushu Regional
Environment Office 2013, Japan). Nutritional condition of individual deer is expected to vary with deer density, because food plant availability is lower in higher density habitats.
More specifically, I expect that nutritional condition of deer is low in high-density areas of Yakushima Island, where vegetation covers have been lost under heavy browsing and limited food availability (Onoda & Yahara 2015). Moreover, kidney fat index is expected to be associated with quantity and quality of rumen contents, although the effect of the latter on the former may be delayed. I therefore tested this expectation by examining rumen contents in terms of the total weight, the percentage of nitrogen content and the proportion of green to non-green leaves. Considering these possibilities, I address the following specific questions.
1) Are kidney fat index values low under high deer density and high under low density?
2) Are kidney fat index values lower in winter than in summer?
3) Are kidney fat index values correlated with quantity and quality of rumen contents?
12
Materials and Methods
Study animal
Yakushika, Cervus nippon yakushimae, is a subspecies endemic to Yakushima Island and Kuchinoerabu-jima Island having the smallest body size among 7 subspecies of C. nippon in Japan (Takatsuki 1990). The home range size (17.6 ha for females or 65.9 ha for males) is also the smallest in C. nippon (Kyushu Regional Forest Office 2012). C. n. yakushimae inhabits widely from the lowland to the summit (1836 m) of Yakushima Island. The deer are browsers that feed on evergreen trees and understory herbs in the lowland (Takatsuki 1990, Terada et al. 2010, Agetsuma et al. 2011), whereas the deer are grazers and feed on dwarf bamboo (Pseudosasa owararii) in the highland (Takatsuki 1990, 2009b). In the western part of Yakushima Island, 45.6–59.8 % of deer’s diet was fallen leaves of trees (Agetsuma et al. 2011). Kawamura et al. (2013) showed that C. n. yakushimae was grazing grass at a town ranch in Koseda.
The abundance of C. n. yakushimae was reduced by overhunting in the 1950s, and the population size was estimated to be 1900 or 3000 during 1967–1969 (Kagoshima Nature Conservation Association 1981). Thereafter, the population of C. n.
yakushimae subsequently increased under protection. According to light censuses made
at night in the western, northern and eastern areas, the number of witnessed deer
13
individuals increased from 2–4 head/km2 in 1995 to more than 33 in 2004 (Yahara 2006).
According to daytime censuses, the estimated population size in the western part was 2.55 head/km2 in 1988 and 40.74 in 2001 (Tsujino et al. 2004a), 43–70 or 63–78 head/km2 in 2001 (Agetsuma et al. 2003), 51.5–63.8 in 2002 (Tsujino and Yumoto 2004b) and 95.70–111.65 in 2007 (Koda et al. 2011). According to a more recent estimation, local deer density varied among populations from 4.6–161.2 head/km2, and total population size was 18,677 with a 95 % confidential interval from 16,402–21,088
(Kyushu Regional Environment Office 2013). Additionally, according to Kawamura et al. (2013), average deer density at a town ranch in Koseda was 420 head/km2. C. n.
yakushimae there was grazing grass because deer fence was not always effective to
prevent deer from invasion to the pasture.
Mean retention time through the whole digestive tract is reported to seasonally vary from 22.5 hours in February to 45.7 hours in July (Odajima et al. 1991). Gastric contents of deer captured therefore reflect contents for the last few days.
Study Area
Yakushima Island (30°20’N, 131°30’E) is located 70 km south of the Kyushu Island, Japan (Figure 1). According to the record of the Koseda station located at 37.0 m
14
above sea level in the eastern coast of Yakushima Island, the average temperature from 1981 to 2010 was 19.4 °C and the average annual total rainfall for the same period was
4477 mm (Japan Meteorological Agency,
http://www.data.jma.go.jp/obd/stats/etrn/view/nml_sfc_ym.php?prec_no=88&block_no
=47836&year=&month=&day=&view=p1). The area of the island is 504 km2 and a part of which (107 km2) was registered as a Natural World Heritage in 1993 by UNESCO.
The island is mountainous and the highest peak reaches 1836 m above the sea level.
Altitudinal vegetation changes from broad-leaved evergreen forest in the lowland, to conifer-broad leaf mixed forest in the middle elevation, conifer forest dominated by Cryptomeria japonica in the higher elevation and dwarf bamboo grassland in the peak
area (Yumoto 1987, 1988).
The sika deer, C. n. yakushimae has increased its population size since the 1990s and caused serious damages to agriculture, forestry and natural forest ecosystem in Yakushima Island (Onoda & Yahara, 2015). To decrease these damages, 3811 and 4556 individuals were eliminated by trapping and shooting in 2012 and 2013, respectively (Kyushu Regional Forest Office 2014, Japan).
I recorded the capture location with Geographic Positioning System (GPS) in the field and determined the elevation and slope of each capture location using a 10 m
15
digital elevation model (Geospatial Information Authority of Japan 2005). The slope of capture location, an indicator of habitat topography, was determined by considering the differences of the home range size between sex; 300 m for females and 500 m for males (Kyushu Regional Forest Office 2012). First, I specified grids (10 m × 10 m each) located within a circle centered at the locus of capture with a radius of 300 m for a female or 500 m for a male. Second, for each of those grids, a slope value was determined as the maximum difference among nine grids in a 30 m × 30 m area including the target grid and its eight neighboring grids. Finally, the slope values of all grids in a circle were averaged. All the geoprocessing steps and analyses were performed with ArcGIS 10.1 (ESRI).
Sampling kidneys and rumen contents from eliminated deer
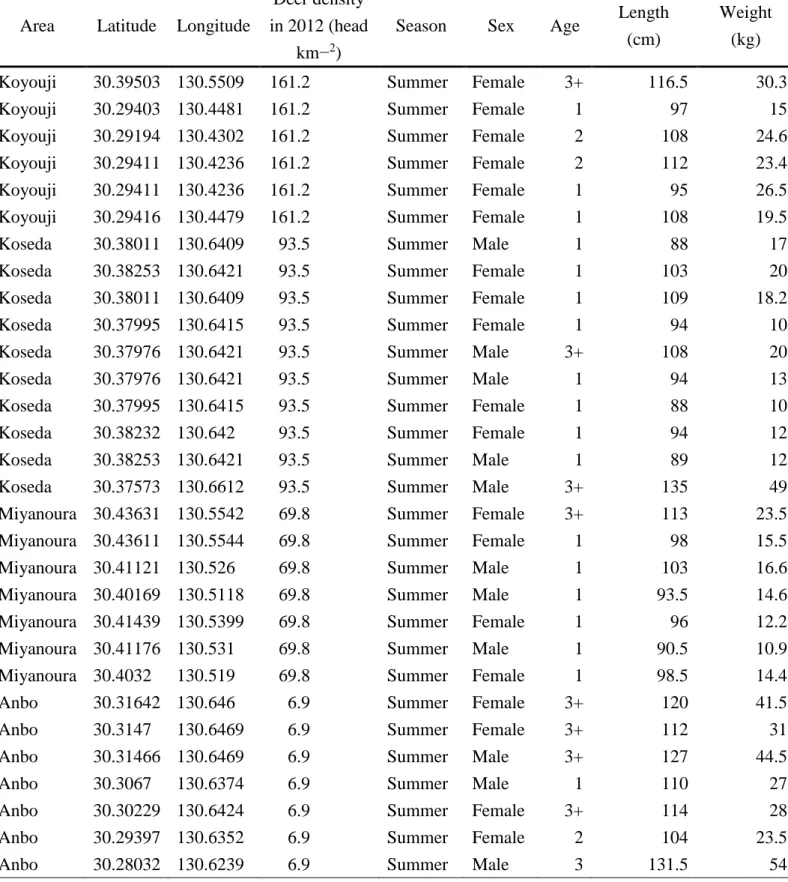
I examined 74 eliminated deer individuals from five areas differ in deer density: Anbo (7.1 head/km2 for 2008–2009 and 6.9 for 2012), Miyanoura (40.1, 69.8), Koyouji (71.7, 161.2; both data from Kurio, a location near Koyouji), Yahazu head (52.4 at Yahazu, 73.2 from Isso forestry road, a location near Yahazu), and Koseda (92.5, 93.5) (Fig.1). To examine sensitivity of our conclusion to variability of deer density, I compared the results from statistical analyses using two sets of deer density estimates;
16
2008 – 2009 and 2012. The eliminated individuals were hunted and provided by two hunting communities, Yakushima Forestry Ecosystem Conservation Center and Yakushima Forestry Administration Station. I recorded hunted date, sex, location, and georeferenced using a Garmin equipment (etrex VISTA).
Deer density data obtained from Kyushu Regional Environment Office (2013) and estimated by the improved pellet count method (Iwamoto et al. 2000) in winter.
Pellets were counted along 220-m transects at each location (Dr. Shioya, Kagoshima Environmental Research and Service, personal communication). To determine deer nutritional conditions, I collected the kidney fats and stomach contents from eliminated deer within three hours after killing the deer. The kidneys with surrounding fat were removed, measured and fresh samples were weighted. I also weighed a rumen, sampled 20 g of the rumen contents, mixed well by stirring with a spoon, and packed in a zip-lock plastic bag. The samples were then stored at −20 °C until analysis.
Determining kidney fat index and the quantity and quality of food intake
For each kidney sample, the both ends of fat tissue were trimmed with scissors, and then excised fat tissue and kidney were weighed fresh with an accuracy of 0.01 g.
Riney’s kidney fat index (RKFI; Riney 1955) was then calculated by dividing the
17
weight of kidney fat remaining after trimming by kidney weight. The RKFI values of both right and left kidneys were measured and averaged for each individual. The higher RKFI value is considered as better nutritional status of deer.
To quantify food intake, I measured dry weight of rumen contents. Total fresh weight of rumen contents was weighed. Then, a 50-g sample of rumen contents was transferred to a 50 ml centrifuge tube with a spoon, stored at −20°C in the field station of Kyushu University, Yakushima Island, dried using a freeze dryer (TAITEC VD-250R) in the laboratory, and weighed. Total dry weight of rumen contents was then calculated as follow: multiplying the total fresh weight by the ratio of dry weight/fresh weight. Below, dry weight of rumen contents is simply called food intake.
I measured the nitrogen content of the stomach contents as an indicator of the nutritional value. Rumen contents were washed with distilled water to rinse off rumen bacteria, dried with a freeze dryer (TAITEC VD-250R), and crushed with TissueLyser (QIAGEN). The percentage of nitrogen content was determined by the Service Centre of the Elementary Analysis of Organic Compounds, Faculty of Science, Kyushu University. I determined the percentage of non-green leaves as an indicator of food quality, because cellular nitrogen is transported to other organs during the leaf senescence, and therefore non-green leaves have lower level of nitrogen (Hörtensteiner
18
and Feller 2002). The rumen contents were spread on the bottom of a container (445×325×70 mm) with 1 cm square grids (25×20 grids) and leaf fragments were assigned one by one to squares. Then green and non-green leaf fragments were individually counted and the percentage of non-green leaf fragments was determined.
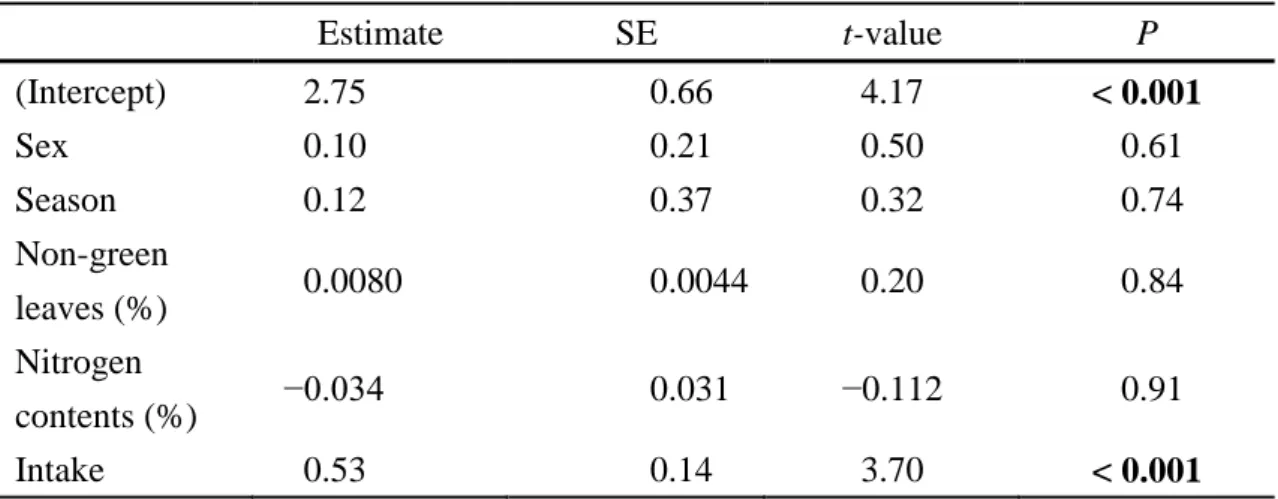
Statistical Analysis
To examine whether the value of RKFI and the quantity and quality of rumen contents are different between five areas, I employed the Welch ANOVA using an option which does not assume the homogeneity of variances and made multiple comparisons following Holm (1979). To examine the relationship between food intake and body weight or age, I employed generalized linear mixed model (GLMM) with a normal distribution and an identity link function, where the body weight and age (three categories; 1, 2 and “3 or older”) were as the dependent variable and the area was as a
random factor. I examine the relationship between RKFI and density, using Spearman's rank correlation test. To determine factors significantly affecting RKFI, I employed GLMM with a normal distribution and an identity link function, where five variables (sex, season, food intake, percentage of nitrogen and percentage of non-green leaves) as the dependent variable and the area as a random factor. All statistical analyses were
19
performed using R 3.3.1 (R Development Core Team 2016). The GLMMs were fitted with in R using package lme4 with the glmer function (Bates et al. 2014).
Results
Deer density, altitudes and slopes of sampling locations
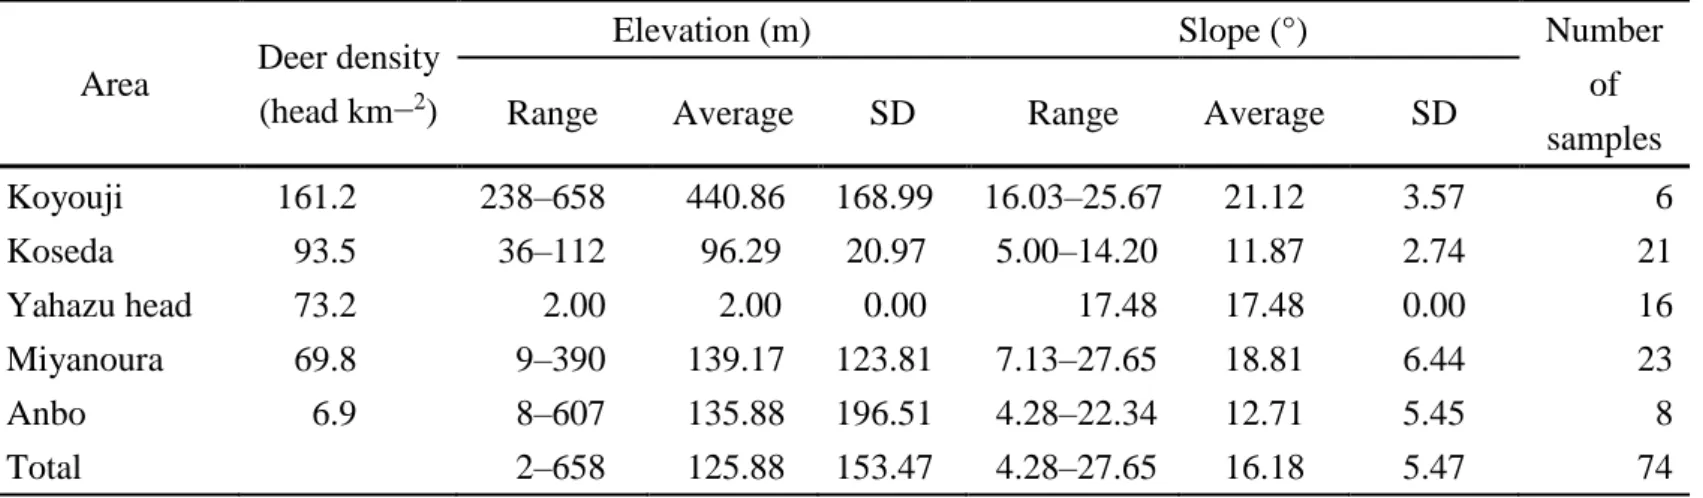
In the Yakushima Island , localities of the eliminated deer samples varied in altitude from 2 to 658 m (average ± SD; 125.88 ± 153.47) above the sea level and the slope ranged from 4.28 to 27.65 m (16.18 ± 5.47) (Table 1). A total of 74 eliminated deer included 36 male individuals (average ± SD; body length, 108.80 ± 14.95; body weight, 25.72 ± 11.30) and 38 female individuals (body length, 106.97 ± 10.67; body weight, 23.36 ± 7.52); 31 individuals were collected in summer (June, July and August), and 43 were in winter (November, December, January and February) (see Table 2 for details of deer collection data).
RKFI and the quantity and quality of rumen contents
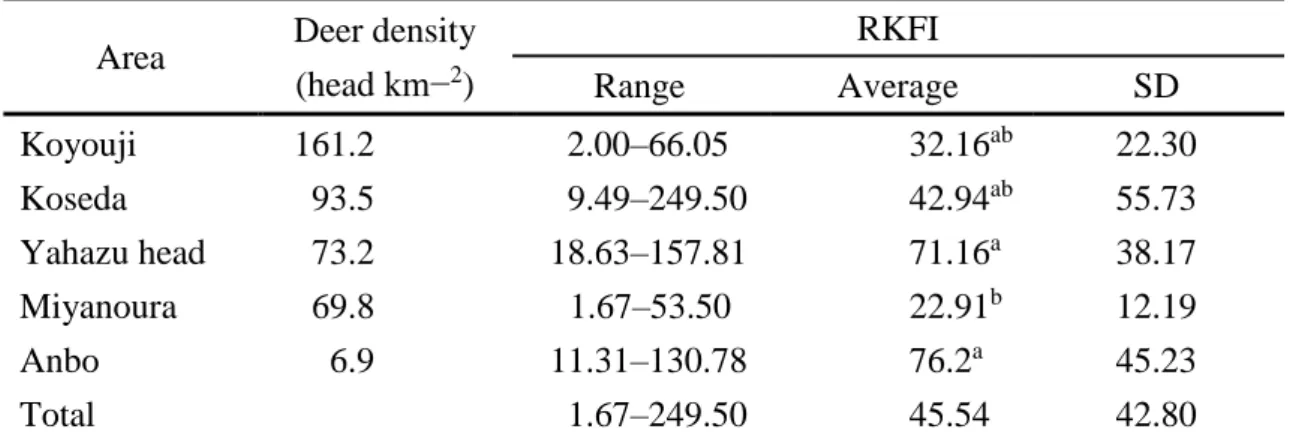
The average value of RKFI varied from 22.91 ± 11.91 in Miyanoura to 76.23 ± 15.99 in Anbo (Fig.2, Table 3). I found a significant difference of the avarage value of RKFI among populations (Welch ANOVA: F = 7.9637, P< 0.01), it was significantly
20
lower in Miyanoura than in Anbo or Yahazu head (pairwise t-test: all P < 0.01, Table 3).
There was no significant correlation between RKFI and density both in 2008–2009 and in 2012 (Spearman’s rank correlation test: S = 72,052, P = 0.57; S = 72,083, P = 0.57).
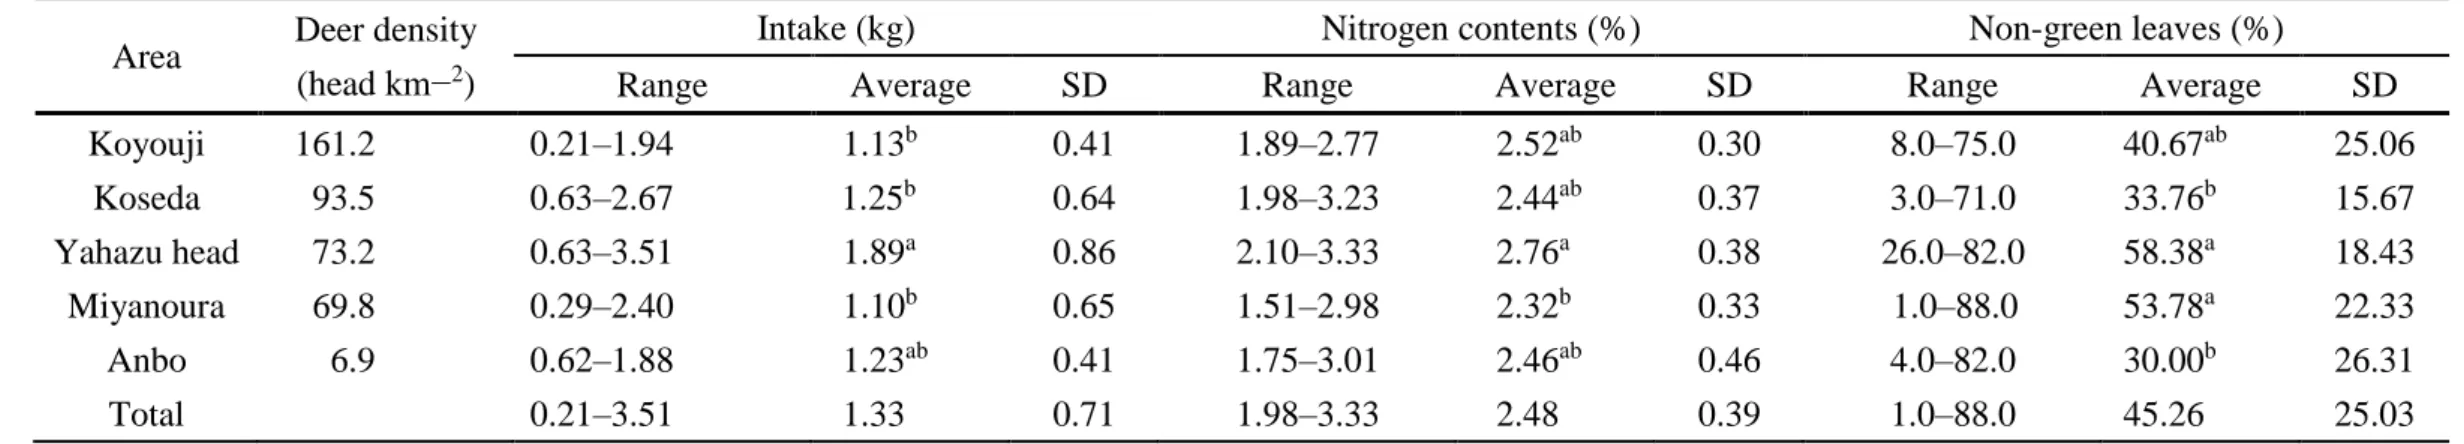
Total fresh weight of rumen contents varied from 0.51 to 3.51 kg, showing significant difference among populations (Welch ANOVA: F = 4.148, P < 0.01). It was significantly higher in Yahazu head than in Koseda, Koyouji or Miyanoura (pairwise t-test: all P < 0.05, Table 4). Food intake did not significantly different in summer and
winter season (Welch’s t test: t-value = −0.18, P = 0.43). Food intake was correlated neither with body weight (GLMM: β ± SE = 0.0060 ± 0.0090, t-value = 0.66, P = 0.51) nor with age (GLMM: β ± SE = 0.14 ± 0.082, t-value = 1.67, P = 0.10). The ratio of dry
weight to fresh weight ranged from 0.34 to 0.49, and total dry weight varied from 0.2 to 1.71 kg. The percentage of nitrogen varied from 1.98 to 3.33, showing significant difference among populations (Welch ANOVA: F = 3.2262, P = 0.03), and it was significantly higher in Yahazu head than in Miyanoura (pairwise t-test: P < 0.01, Table 4).The percentage of non-green leaves varied from 1.0 to 88.1, showing significant difference among populations (ANOVA: F = 5.7515, P < 0.01), and it was significantly higher in Yahazu head or Miyanoura than in Koseda or Anbo (pairwise t-test: all P <
0.05, Table 4).
21
Variables affecting RKFI
The food intake and RKFI showed L-shaped relationship in Koseda; nine individuals with food intake lower than 0.81 had high variation in RKFI, and five out of nine had RKFI higher than 50. However, in 12 individuals, with a range of food intake from 0.93 to 2.67, RKFI was less than 50 (Fig. 3). The relationship between food intake and RKFI was not significant, if I included the data from Koseda (β ± SE = 0.14 ± 0.17, t-value = 0.832, P = 0.405). However, I found a common significant relationship within
the four studied locations: among five variables in GLMM, food intake showed significant positive effect (β ± SE = 0.53 ± 0.14, t-value= 3.70, P < 0.01), and the other
four variables (sex, season, percentage of nitrogen, and percentage of non-green leaves) had no significant effects in GLMM analyses (Fig.5, Table 5).
Discussion
The key finding of this study is that the food intake is an only candidate factor correlated with RKFI. Neither density nor season showed significant effects on RKFI.
The correlation between food intake and RKFI was not significant, but it was significant in four areas except Koseda where food intake and RKFI showed a L-shaped relationship. In Koseda, deer can graze pasture grass of the town ranch (Kawamura et al.
22
2013). Therefore, the deer individuals with low food intake but high RKFI may have grazed nutrient-rich pasture grass. There was no significant correlation between nitrogen content and RKFI in this study, suggesting that fat storage in kidneys is highly dependent on the carbohydrates availability.
Contrary to what might be expected that RKFI values would be lower at higher deer density areas where understory plants have been heavily browsed (such as in Koseda and Yahazu, Japan), the data of this study did not find significant relationship between deer density and RKFI. In all locations, average RKFI values exceeded a threshold value 20 below which nutritional condition of C. nippon is considered to be poor (Maruyama 1985; Torii & Fujishita 1998). This threshold value is based on the relationship between RKFI and femur marrow fat (FMF) percentage: the percentage level of FMF is constantly higher than 50 when RKFI exceeded 20, but rapidly decreases when RKFI was less than 20, suggesting that fats of both kidney and femur marrow are consumed if RKFI is less than 20 (Torii & Fujishita 1998). The finding that average RKFI values exceeded 20 in five locations indicates that all five populations including the high density populations of Koseda and Yahazu are not in a malnourished condition. In fact, fresh rumen contents in Koseda and Yahazu were as heavy as 2.3 kg and 3.8 kg, respectively, indicating that deer individuals in those populations are getting
23
good amounts of plant resources as food.
Besides deer density, season did not show significant association with RKFI values. These results are consistent with our expectation that even in winter the nutritional status may not decrease in southern Japan including Yakushima Island. This expectation is based on the fact that most understory plants are evergreen in the lower elevation of Yakushima Island and thereby C. n. yakushimae can use consume them as winter food resources (Takatsuki 2009b). High and stable supply of evergreen plants throughout the year were also observed for deer in Chiba Prefecture, central Japan (Asada and Ochiai 1996) and Yamaguchi Prefecture, western Japan (Jayasekara and Takatsuki 2000).
On the other hand, the evergreen plants consistently declined under continued heavy browsing pressure in areas with high deer density such as Koseda and Yahazu. It therefore remains uncertain how C. n. yakushimae get nutritious food in these areas and they had RKFI values exceeding 20 (Table 4). I suggest that populations the deer may be able to obtain sufficient nutrition from fallen leaves in the high deer density areas, as previously reported (Takahashi and Kaji 2001: Miyaki and Kaji 2004). The use of fallen leaves under high density was observed in Toya Lake, Hokkaido (Takahashi and Kaji 2001: Miyaki and Kaji 2004). In the western part of Yakushima Island, 45.6–59.8 % of
24
the deer diet was fallen leaves of trees (Agetsuma et al. 2011). In our results, the average proportion of non-green leaves in rumen contents (Table 4) varied from 30 % in Anbo where deer density was the lowest (6.9 head/km2) to 58 % in Yahazu head where deer density was as high as 73.2 head/km2, and the difference between these two populations was significant. It is therefore considered that deer in Yahazu head under higher density depends more on fallen leaves. On the other hand, in the Miyanoura deer population, the percentage of non-green leaves in rumen contents was as high as in Yahazu head (55 % Table 4). However, their RKFI value and the percentage of nitrogen were significantly lower than in Yahazu head (Table 3). These results therefore suggest that not only amount of the fallen leaves but also leaves quality that probably vary with diet plant species, may affect the RKFI value. Variation in species composition of diets between localities, may explain the finding that neither the percentage of nitrogen nor the percentage of non-green leaves was significantly correlated with RKFI. DNA assessment based on rumen contents such as DNA barcoding could be useful for the identification of plant species composition of deer diet.
It is worth noting that the food intake varied, even among individuals in the same area (Fig.3), whereas the total fresh weight of rumen contents was correlated with neither body weight nor age. This finding suggests that food selectivity is different
25
between individuals. Bergvall (2007) examined fallow deer feeding selectivity for the food with tannins and found that intake of tannins was significantly different among ten individuals. Further studies are needed to test whether the population of C. n.
yakushimae would show any selectivity based on a food type.
In conclusion, our finding showed that C. n. yakushimae is not in a poor nutritional condition regardless of the high density even above 70 head/km2 probably due to the high plant productivity in Yakushima Island. Further, this result indicates that the population of C. n. yakushimae will likely to continue to increase and thus would be expected to drive further decline in understory vegetation in Yakushima Island.
Therefore, there is a need to prioritize strategic management program for both deer population size and the occurrence of threatened plant species in the Yakushima Island as suggested by Fujimaki et al. (2016).
26
References
Agetsuma N, Agetsuma-Yanagihara Y, Hino T (2011) Food habits of Japanese deer in an evergreen forest: Litter-feeding deer. Mamm Biol 76:201–207.
Agtetsuma N, Sugiura H, Hill DA, Agetsuma-Yanagihara Y, Tanaka T (2003)
Population density and group composition of Japanese sika deer (Cervus nippon yakushimae) in an evergreen broad-leaved forest in Yakushima, southern Japan.
Ecol Res 18:475–483
Asada M, Ochiai K (1996) Food habits of sika deer on the Boso Peninsula, central Japan. Ecol Res 11:89–95
Bates D, Maechler M, Bolker B, Walker S, Christensen R. H. B, Singmann H, Rcpp L (2014) Package ‘lme4’. R Foundation for Statistical Computing, Vienna.
Bergvall UA (2007) Food choice in fallow deer –experimental studies of selectivity.
Ph.D. thesis, Stockholm University.
http://www.diva-portal.org/smash/get/diva2:197053/FULLTEXT01.pdf
Bjornstad ON, Flack W, Stenseth NC (1995) A geographic gradient in small rodent density fluctuations: a statistical modelling approach. Proc R Soc London B Biol Sci 262:127–133.
Clutton-Brock TH, Major M, Guinness FE (1985) Population regulation in male and
27
female red deer. J Anim Ecol 54:831–846.
Fujimaki A, Shioya K, Tagawa S, Matsuda H (2016) A theoretical approach for zone-based management of the deer population on Yakushima Island. Pop Ecol 58:315–327
Geospatial Information Authority of Japan (2005) Fundamental Geospatial Data (Digital elevation model). available at: http://fgd.gsi.go.jp/download/menu.php#.
Accessed 1 December 2013
Hansson L, Henttonen H (1985) Gradients in density variations of small rodents: the importance of latitude and snow cover. Oecologia 67:394–402.
Holm S (1979) A simple sequentially rejective multiple test procedure. Scand J Stat 6:65–70.
Hörtensteiner, S, Feller U (2002) Nitrogen metabolism and remobilization during senescence. J Exp Bot 53:927–937.
Iwamoto T, Sakata T, Nakazono T, Kaoka H, Ikeda K, Nishishita Y, Tokida K, Doi T (2000) Improvement of the pellet count method for the estimation of sika deer density (in Japanese with English summary). Mamm Sci 40:1–17
Japan Meteorological Agency (Update date unknown) Average meteorological value of
Yakushima, available at:
28
http://www.data.jma.go.jp/obd/stats/etrn/view/nml_sfc_ym.php?prec_no=88&bloc k_no=47836&year=&month=&day=&view=p1. Accessed 30 September 2016 Jayasekara P, Takatsuki S (2000) Seasonal food habits of a sika deer population in the
warm temperate forest of the westernmost part of Honshu, Japan. Ecol Res 15:153 –157
Kagoshima Nature Conservation Association (1981) A report of an urgent survey on the occurrence and distribution of Yakushika. Report of Kagoshima Nature Conservation Association 5:1–34
Kaji K, Okada H, Yamanaka M, Matsuda H (2004) Irruption of a colonizing sika deer population. J Wildl Manage 68:889–899.
Kaji K, Koizumi T, and Ohtaishi N (1988) Effects of resource limitation on the physical and reproductive condition of sika deer on Nakanoshima Island, Hokkaido. Acta Theriol 33:187–208.
Kawamura T, Koda R, Tatsuzawa S (2013) Pasture utilization by sika deer (Cervus nippon yakushimae): What factors affect deer density utilizing the pastures on
Yakushima Island? Honyurui Kagaku 53:345–350 (in Japanese with English summary)
Koda R, Agetsuma N, Agetsuma-Yanagihara Y, Tsujino R, Fujita N (2011) A proposal of
29
the method of deer density estimate without fecal decomposition rate: a case study of fecal accumulation rate technique in Japan. Ecol Res 26:227–231
Koda R, Noma N, Tsujino R, Umeki K, Fujita N (2008) Effects of sika deer (Cervus nippon yakushimae) population growth on saplings in an evergreen broad-leaved
forest. Forest Ecol Manag 256:431–437
Kyushu Regional Forest Office (2014) The capture record of Yakushika in the fiscal year 2013, available at: http://www.rinya.maff.go.jp/kyusyu/fukyu/shika/
/pdf/dai9siryou3-3.pdf. Accessed 28 September 2016
Kyushu Regional Environmental Office (2013) A mid-term report on the management of Yakushika for the fiscal year 2012, available at:
http://www.rinya.maff.go.jp/kyusyu/fukyu/shika/pdf/wg6siryou2-1.pdf. Accessed 28 September 2016
Kyushu Regional Forest Office (2012) A report on GPS telemetry survey on Yakushika, available at: http://www.rinya.maff.go.jp/kyusyu/sidou/pdf/bettenn1-2.pdf.
Accessed 28 September 2016
Loison A, Langvatn R (1998) Short-and long-term effects of winter and spring weather on growth and survival of red deer in Norway. Oecologia 116:489–500.
Loison A, Langvatn R, Solberg EJ (1999) Body mass and winter mortality in red deer
30
calves: disentangling sex and climate effects. Ecography 22:20–30.
Lord RD (1960) Litter size and latitude in North American mammals. Am Midl Nat 64:488–499
Maruyama N (1985) Evaluating nutritive condition of sika deer. In: Nature Conservation Dept., Environmental Agency, Japan (ed) Dynamics of Larger Mammals (Bear and Deer) and Natural Environment in Japanese Forest, pp 257–260 (in Japanese)
Ministry of the environment (2016) Japan biodiversity outlook 2, available at:
http://www.env.go.jp/nature/biodic/jbo2/pamph01_full.pdf. Accessed 29 September 2016
Miyaki M, Kaji K (2004) Summer forage biomass and the importance of litterfall for a high-density sika deer population. Ecol Res 19:405–409
Odajima M, Kajita Y, Nam K, Lee S, Senge H, Katoh K, Shoji Y, Ohta M, Sasaki Y (1991) Seasonal changes in food passage and digestibility in Japanese sika deer (Cervus nippon) and sheep under restricted feeding condition. Nihon Chikusan Gakkaiho 62:308–313 (in Japanese)
Onoda Y, Yahara T (2015) History of human-deer interactions: a case of ecosystem and deer population changes on Yakushima Island. In: Miyashita T, Nishihiro J (ed)
31
Challenges for conservation ecology in space and time, University of Tokyo Press, Tokyo, pp 126–149 (in Japanese)
R Development Core Team (2016). R: A language and environment for statistical computing, available at: http://www.R-project.org. Accessed 1 July 2016
Riney T (1955) Evaluating condition of free-ranging red deer (Cervus elaphus), with special reference to New Zealand. N Z J Sci Technol 36B:429–463
Takahashi H, Kaji K (2001) Fallen leaves and unpalatable plants as alternative foods for sika deer under food limitation. Ecol Res 16:257–262
Takatsuki S (2009a) Effects of sika deer on vegetation in Japan: a review. Biol Conserv 142:1922–1929.
Takatsuki S (2009b) Geographical variations in food habits of sika deer: the northern grazer vs. the southern browser. In: McCullough DR, Takatsuki S, Kaji K (ed) Sika deer, Springer Japan, Tokyo, pp 231–237
Takatsuki S (2001) Assessment of nutritional condition in sika deer by color of femur and mandible marrows. Mammal Study 26:73–76
Takatsuki S (2000) Kidney fat and marrow fat indices of the sika deer population at Mount Goyo, northern Japan. Ecol Res 15:453–457
Takatsuki S (1990) Summer dietary compositions of sika deer on Yakushima Island,
32
southern Japan. Ecol Res 5:253–260
Takatsuki S, Suzuki K, Suzuki I (1994) A mass-mortality of Sika deer on Kinkazan Island, northern Japan. Ecol Res 9:215–223
Tatsuzawa S (2004) The process and mechanism of population regulation in the insular
sika deer, Cervus nippon mageshimae, Ph.D. thesis, Kyoto University
Terada C, Tatsuzawa S, Kawamura T, Fujioka M (2010) Evaluation of forestry roads as feeding sites of sika deer. Jpn J Conserv Ecol 15:193–201 (in Japanese with Endlish summary)
Torii H, Fujishita A (1998) Kidney, femur and mandible marrow fat as indicators of deer condition. Bull Nara Univ Educ 47:7–10 (in Japanese with English summary) Tsujino R, Noma N, Yumoto M (2004a) Growth in sika deer (Cervus nippon
yakushimae) population in the western lowland forest on Yakushima Island, Japan.
Mammal Study 29:105–111
Tsujino R, Yumoto M (2004b) Effects of sika deer on tree seedlings in a warm temperate forest on Yakushima Island, Japan. Ecol Res 19:291–300
Yahara T (2006) Deer population increase and extinction risks of wild plants. In:
Yumoto T, Matsuda H (ed) Deer eats world heritages: ecology of deer and forests, Bunichi-sogo-shuppan, pp. 168–187
33
Yokoyama M, Kaji K, Suzuki M (2000) Food habits of sika deer and nutritional value of sika deer diets in eastern Hokkaido, Japan. Ecol Res 15:345–355
Yokoyama M, Sakata H, Hamasaki S, Mitani M, Tanaka T (2003) Condition asssessment of sika deer population in Hyogo Prefecture: characteristics of reproduction, food habit and nutritional condition. Humans Nat 14:21–31 (in Japanese with English summary)
Yumoto T (1988) Pollination systems in the cool temperate mixed coniferous and broad-leaved forest zone of Yakushima Island. Ecol Res 3:117–129
Yumoto T (1987) Pollination systems in a warm temperate evergreen broad-leaved forest on Yakushima Island. Ecol Res 2:133–145
34
Figures and Tables
Fig.1 Distribution of Cervus nippon in Japan and the sampling locations of C. n.
yakushimae in Yakushima Island. The area filled in black indicates the range of C.
nippon. Redrawn from a figure in Ministry of the environment (2016)
35
Fig.2 Variation in Riney’s kidney fat index of Cervus nippon yakushimae in five locations of Yakushima Island (Anbo: An, Miyanoura: Mi, Koyouji: Ky, Yahazu: Ya, Koseda: Ks). Each box indicates an interquartile range (IQR) with a median, a pair of whiskers indicate a range of IQR±1.5IQR, and open circles show outliers
36
Fig.3 The relationship between Riney’s kidney fat index of Cervus nippon yakushimae
and food intake in Koseda
37
Fig.4 The relationship between Riney’s kidney fat index (RKFI) and food intake of Cervus nippon yakushimae in the four locations except Koseda. The regression line is based on the generalized linear mixed model analysis with a logarithmic transformation of RKFI values
38
Fig.5 Variation in Riney’s kidney fat index of Cervus nippon yakushimae in two seasons (Summer: June, July and August, Winter: November, December, January and February).
Each box indicates an interquartile range (IQR) with a median, a pair of whiskers indicate a range of IQR±1.5IQR, and open circles show outliers
39 Tables
Table 1 The values of the geographical variables of each sampling area Area Deer density
(head km−2)
Elevation (m) Slope (°) Number
of samples
Range Average SD Range Average SD
Koyouji 161.2 238–658 440.86 168.99 16.03–25.67 21.12 3.57 6
Koseda 93.5 36–112 96.29 20.97 5.00–14.20 11.87 2.74 21
Yahazu head 73.2 2.00 2.00 0.00 17.48 17.48 0.00 16
Miyanoura 69.8 9–390 139.17 123.81 7.13–27.65 18.81 6.44 23
Anbo 6.9 8–607 135.88 196.51 4.28–22.34 12.71 5.45 8
Total 2–658 125.88 153.47 4.28–27.65 16.18 5.47 74
40
Table 2 Collection data of eliminated deer (Cervus nippon yakushimae) Area Latitude Longitude
Deer density in 2012 (head
km−2)
Season Sex Age Length (cm)
Weight (kg)
Koyouji 30.39503 130.5509 161.2 Summer Female 3+ 116.5 30.3
Koyouji 30.29403 130.4481 161.2 Summer Female 1 97 15
Koyouji 30.29194 130.4302 161.2 Summer Female 2 108 24.6
Koyouji 30.29411 130.4236 161.2 Summer Female 2 112 23.4
Koyouji 30.29411 130.4236 161.2 Summer Female 1 95 26.5
Koyouji 30.29416 130.4479 161.2 Summer Female 1 108 19.5
Koseda 30.38011 130.6409 93.5 Summer Male 1 88 17
Koseda 30.38253 130.6421 93.5 Summer Female 1 103 20
Koseda 30.38011 130.6409 93.5 Summer Female 1 109 18.2
Koseda 30.37995 130.6415 93.5 Summer Female 1 94 10
Koseda 30.37976 130.6421 93.5 Summer Male 3+ 108 20
Koseda 30.37976 130.6421 93.5 Summer Male 1 94 13
Koseda 30.37995 130.6415 93.5 Summer Female 1 88 10
Koseda 30.38232 130.642 93.5 Summer Female 1 94 12
Koseda 30.38253 130.6421 93.5 Summer Male 1 89 12
Koseda 30.37573 130.6612 93.5 Summer Male 3+ 135 49
Miyanoura 30.43631 130.5542 69.8 Summer Female 3+ 113 23.5
Miyanoura 30.43611 130.5544 69.8 Summer Female 1 98 15.5
Miyanoura 30.41121 130.526 69.8 Summer Male 1 103 16.6
Miyanoura 30.40169 130.5118 69.8 Summer Male 1 93.5 14.6
Miyanoura 30.41439 130.5399 69.8 Summer Female 1 96 12.2
Miyanoura 30.41176 130.531 69.8 Summer Male 1 90.5 10.9
Miyanoura 30.4032 130.519 69.8 Summer Female 1 98.5 14.4
Anbo 30.31642 130.646 6.9 Summer Female 3+ 120 41.5
Anbo 30.3147 130.6469 6.9 Summer Female 3+ 112 31
Anbo 30.31466 130.6469 6.9 Summer Male 3+ 127 44.5
Anbo 30.3067 130.6374 6.9 Summer Male 1 110 27
Anbo 30.30229 130.6424 6.9 Summer Female 3+ 114 28
Anbo 30.29397 130.6352 6.9 Summer Female 2 104 23.5
Anbo 30.28032 130.6239 6.9 Summer Male 3 131.5 54