of August 24, 2017.
This information is current as Erythematosus − Derived T Cells
Hypoproduction of IL-2 in Systemic Lupus CtBP2 Complex, Is Involved in the
Downregulation of miR-200a-3p, Targeting
Tsokos, Ken-Ei Sada and Jun Wada
Zeggar, Nobuya Yoshida, Vaishali R. Moulton, George C.
Keiji Ohashi, Haruki Watanabe, Takayuki Katsuyama, Sonia Syun Matsushima, Yuriko Yamamura, Sumie Hiramatsu, Eri Katsuyama, Minglu Yan, Katsue Sunahori Watanabe,
http://www.jimmunol.org/content/198/11/4268 doi: 10.4049/jimmunol.1601705
April 2017;
2017; 198:4268-4276; Prepublished online 24 J Immunol
References
http://www.jimmunol.org/content/198/11/4268.full#ref-list-1
, 23 of which you can access for free at:
cites 44 articles This article
Subscription
http://jimmunol.org/subscription
is online at:
The Journal of Immunology Information about subscribing to
Permissions
http://www.aai.org/About/Publications/JI/copyright.html Submit copyright permission requests at:
Email Alerts
http://jimmunol.org/alerts
Receive free email-alerts when new articles cite this article. Sign up at:
Print ISSN: 0022-1767 Online ISSN: 1550-6606.
Immunologists, Inc. All rights reserved.
Copyright © 2017 by The American Association of 1451 Rockville Pike, Suite 650, Rockville, MD 20852 The American Association of Immunologists, Inc.,
is published twice each month by The Journal of Immunology
Downregulation of miR-200a-3p, Targeting CtBP2 Complex, Is Involved in the Hypoproduction of IL-2 in Systemic Lupus Erythematosus–Derived T Cells
Eri Katsuyama,* Minglu Yan,* Katsue Sunahori Watanabe,* Syun Matsushima,*
Yuriko Yamamura,* Sumie Hiramatsu,* Keiji Ohashi,* Haruki Watanabe,*
Takayuki Katsuyama,*
,†Sonia Zeggar,* Nobuya Yoshida,
†Vaishali R. Moulton,
†George C. Tsokos,
†Ken-Ei Sada,* and Jun Wada*
Systemic lupus erythematosus (SLE) damages multiple organs by producing various autoantibodies. In this study, we report that decreased microRNA (miR)-200a-3p causes IL-2 hypoproduction through zinc finger E-box binding homeobox (ZEB)1 and C-terminal binding protein 2 (CtBP2) in a lupus-prone mouse. First, we performed RNA sequencing to identify candidate microRNAs and mRNAs involved in the pathogenesis of SLE. We found that miR-200a-3p was significantly downregulated, whereas its putative targets, ZEB2 and CtBP2, were upregulated in CD4+T cells from MRL/lpr-Tnfrsf6lprmice compared with C57BL/6J mice. ZEB1 and ZEB2 comprise the ZEB family and suppress various genes, including IL-2 by recruiting CtBP2. IL-2 plays a critical role in immune tolerance, and insufficient IL-2 production upon stimulation has been recognized in SLE pathogenesis. Therefore, we hypothesized that decreased miR-200a-3p causes IL-2 deficit through the ZEB1–CtBP2 and/or ZEB2–CtBP2 complex in SLE CD4+T cells. Overexpres- sion of miR-200a-3p induced IL-2 production by downregulating ZEB1, ZEB2, and CtBP2 in EL4 cell lines. We further revealed that miR-200a-3p promotes IL-2 expression by reducing the binding of suppressive ZEB1–CtBP2 and ZEB2–CtBP2 complexes on negative regulatory element A in the IL-2 promoter in EL4 cells. Interestingly, the ZEB1–CtBP2 complex on negative regulatory element A was significantly upregulated after PMA/ionomycin stimulation in lupus CD4+T cells. Our studies have revealed a new epigenetic pathway in the control of IL-2 production in SLE whereby low levels of miR-200a-3p accumulate the binding of the ZEB1–CtBP2 complex to the IL-2 promoter and suppress IL-2 production. The Journal of Immunology, 2017, 198: 4268–4276.
S
ystemic lupus erythematosus (SLE) induces multiple organ damage associated with the overproduction of various autoantibodies and inflammatory cell infiltration (1). De-creased IL-2 production is a well-known characteristic of both human and murine SLE (2, 3). Reduced IL-2 production is related to the impairment of regulatory T cells (Tregs) in SLE patients and in a murine model of SLE (4, 5), suggesting that the dysregulation of IL-2 contributes to the autoimmune phenomena in SLE.
The mechanisms involved in the IL-2 defect in SLE have been elucidated in part by the discovery of various transcription factors that bind to the IL-2 promoter. In SLE, phosphorylated cAMP re- sponse element modulator, an IL-2 suppressor, is aberrantly up- regulated compared with the IL-2 activator phosphorylated CREB, in contrast to healthy controls under stimulation (6, 7). This imbalance is further exacerbated by increased levels of calcium calmodulin kinase IV (8) and serine/threonine protein phosphatase 2A (9).
Zinc finger E-box binding homeobox (ZEB)1 and ZEB2 are transcription factors belonging to the ZEB family and close ho- mologs characterized by two clusters of zinc fingers separated by a homeodomain (10). ZEB1 and ZEB2 bind to various promoters by their zinc finger motif and play a vital role in the development of the vertebrate embryo; these proteins are crucial for the matura- tion of the neural duct and cranial organs (10). Recently, ZEB1 and ZEB2 have been recognized as important players in the in- duction of the epithelial–mesenchymal transition (EMT), which shift the phenotype of tumor cells to induce invasion into the surrounding tissues and metastasis (11–13). Besides, ZEB1 targets and suppresses IL-2 by recruiting a corepressor, C-terminal binding protein 2 (CtBP2) (14–17). ZEB1 was identified as a negative reg- ulator of IL-2 (Nil-2-a) that binds to a negative regulatory element (NRE)-A in the IL-2 promoter (14). ZEB1 and ZEB2 need CtBP2 that directly binds to the Pro-Leu-Asp-Leu-Ser (PLDLS) sequence in ZEB1 and ZEB2 and is essential for them to exert their suppressive
*Department of Nephrology, Rheumatology, Endocrinology, and Metabolism, Okayama University Graduate School of Medicine, Dentistry, and Pharmaceutical Sciences, Okayama 700 8558, Japan; and†Division of Rheumatology, Department of Medicine, Beth Israel Deaconess Medical Center, Harvard Medical School, Boston, MA 02215
ORCIDs:0000-0002-6960-9151(M.Y.);0000-0002-9566-244X(Y.Y.);0000-0001- 7837-086X(H.W.);0000-0002-8230-3528(S.Z.); 0000-0001-9589-2360(G.C.T.);
0000-0003-1020-0818(K.-E.S.).
Received for publication October 5, 2016. Accepted for publication March 24, 2017.
This work was supported by Japan Society for the Promotion of Science Grant 16K19602.
All authors made contributions to the conception and design of the study, as well as final approval of the version to be published. E.K., K.S.W., and J.W. conceived and designed the study; E.K., M.Y., S.M., S.H., Y.Y., K.O., H.W., T.K., S.Z., N.Y., and V.R.M. acquired the data; and E.K., K.-E.S., K.S.W., G.C.T., and J.W. analyzed and interpreted the data.
The sequences presented in this article have been submitted to the Gene Expres- sion Omnibus (https://www.ncbi.nlm.nih.gov/geo/) under accession number GSE87219.
Address correspondence and reprint requests to Dr. Katsue Sunahori Watanabe, Department of Nephrology, Rheumatology, Endocrinology, and Metabolism, Okayama University Graduate School of Medicine, Dentistry, and Pharmaceutical Sciences, 2-5-1 Shikata-cho, Kitaku, Okayama 700 8558, Japan. E-mail address:
Abbreviations used in this article: Aldh1a1, aldehyde dehydrogenase family 1, sub- family A1; B6, C57BL/6J; ChIP, chromatin immunoprecipitation; CtBP2, C-terminal binding protein 2; EMT, epithelial–mesenchymal transition; Iono, ionomycin; miR/
miRNA, microRNA; MRL/lpr, MRL/lpr-Tnfrsf6lpr; NRE, negative regulatory ele- ment; SLE, systemic lupus erythematosus; Treg, regulatory T cell; UTR, untranslated region; ZEB, zinc finger E-box binding homeobox.
CopyrightÓ2017 by The American Association of Immunologists, Inc. 0022-1767/17/$30.00
www.jimmunol.org/cgi/doi/10.4049/jimmunol.1601705
activity (18). However, despite the powerful IL-2 suppression ability of ZEB1, ZEB2, and CtBP2, the function of the ZEB family and CtBP2 in autoimmune diseases is unknown.
MicroRNAs (miRNAs) are small noncoding RNAs that bind to the 39untranslated region (UTR) of target genes and degrade mRNA or arrest translation (19). Recent studies have shown growing evidence that various miRNAs control SLE pathogenesis (20). However, only two reports have been published on miRNAs that regulate IL-2 in SLE. The downregulation of miRNA (miR)-31 in peripheral blood T cells has been reported in patients with SLE, which reduces IL-2 by decreasing RhoA (21). It was also reported that the under- expression of miR-155 in juvenile SLE PBMCs is related to a lower production of IL-2 via the increased expression of the catalytic subunit of serine/threonine protein phosphatase 2A (22).
In the present study, we found that miR-200a-3p, an miR-200 family miRNA that was previously reported as a regulator of cancer metastasis by directly suppressing promoter activity of ZEB1 and ZEB2 genes, was significantly downregulated in the MRL/lpr-Tnfrsf6lpr(MRL/lpr) lupus-prone mouse compared with control mouse. We demonstrated that miR-200a-3p plays a critical role in the regulation of the IL-2 expression through ZEB1, ZEB2, and CtBP2 in EL4 T cells. Furthermore, we showed that the ZEB1–CtBP2 complex failed to dissociate from the IL-2 gene after PMA/ionomycin (Iono) stimulation in mouse primary CD4+ T cells, which explains the mechanism of the IL-2 defect in SLE.
Our study presents novel data in the epigenetic control of IL-2 production in systemic autoimmunity.
Materials and Methods
Mice
Genetic lupus-prone female MRL/lprand their control C57BL/6J (B6) mice were purchased from The Jackson Laboratory and Charles River Laboratories, respectively. The sample of female MRL/MpJ at 16 wk old was procured and studied at the Beth Israel Deaconess laboratories (In- stitutional Animal Care and Use Committee approval 088-2015). At 8 and 14–16 wk of age, MRL mice and B6 mice were sacrificed, and their spleen tissues were collected. The experiments were approved by the Animal Care and Use Committee of the Department of Animal Resources, Ad- vanced Science Research Center, Okayama University (OKU-2015569 and OKU-2013092).
Isolation of mouse primary T cells
Mouse primary CD4+T cells were isolated using a CD4 isolation kit II (Miltenyi Biotec) by negative selection. A purity rate of .96.6% for isolated CD4+T cells was confirmed by flow cytometry.
miRNA profiling using a next-generation sequencer
Total RNA, including miRNA, was purified from CD4+T cells of MRL lupus-prone mice and B6 control mice using an miRNeasy mini kit (Qiagen). The quality of the total RNA was confirmed by spectropho- tometry using an Agilent 2100 Bioanalyzer (Agilent Technologies). Small RNAs were then subjected to the Illumina TruSeq small RNA sample preparation protocol (Illumina). mRNAs were subjected to the Illumina TruSeq RNA sample preparation protocol. Sequencing was performed using Illumina HiSeq. In each group, the read numbers of miRNA/mRNA were counted, after which the miRNA/mRNA list was drafted by com- paring the downregulated miRNA with the concomitantly upregulated mRNA and comparing the upregulated miRNA with the concomitantly downregulated mRNA. All raw and processed data are freely accessible in the Gene Expression Omnibus (https://www.ncbi.nlm.nih.gov/geo/) under the accession number GSE87219.
Cells, cell culture, and stimulation
The EL4 mouse T cell line was obtained from the American Type Culture Collection and cultured in DMEM (Life Technologies) supplemented with 10%
FBS (Life Technologies), 100 U/ml penicillin, and 100mg/ml streptomycin. A total of 106cells/ml (EL4 cells or MRL- and B6-derived CD4+T cells) were stimulated with PMA (10 ng/ml; Sigma-Aldrich) and Iono (1mM; Sigma- Aldrich) at 37˚C in a 5% CO2incubator. For anti-CD3/CD28 stimulation, EL4
T cells were stimulated with plate-bound anti-CD3 Abs (2mg/ml; BioLegend) and anti-CD28 Abs (2mg/ml; BioLegend). Cells were stimulated with PMA/
Iono for 6 h or stimulated with anti-CD3/CD28 Abs for 24 h.
RNA isolation and real-time RT-PCR
Total cellular RNAs were extracted with an miRNeasy mini kit (Qiagen).
cDNAs were reverse transcribed from mRNAs with a high-capacity cDNA RT kit (Thermo Fisher Scientific) and cDNAs from miRNAs with a TaqMan miRNA reverse transcription kit (Thermo Fisher Scientific). Real-time PCRs for miR-200a-3p (000502), miR-181a-5p (000480), miR-101a-3p (002253), miR-466p-3p (464896_mat), sno-202 (001232), and sno-234 (001234) were performed using TaqMan primer/probes with TaqMan miRNA assays (Thermo Fisher Scientific) and normalized to sno-202 and/or sno-234 by the DDCt method. Real-time PCRs for IL-2 (Mm00434256_m1), ZEB1 (Mm00495564_m1), ZEB2 (Mm00497193_m1), CtBP2 (Mm00515572_m1), and GAPDH (Mm99999915_g1) were performed using ABI TaqMan gene expression assays (Applied Biosystems) and normalized to GAPDH by the DDCt method.
Transfection of miRNA mimics
The transfection of miRNA mimics (mirVana; Invitrogen) was performed with Lipofectamine RNAiMAX (Invitrogen) by the reverse transfection procedure. Cells were transfected with miR-200a-3p mimic or its negative control at a final concentration of 10 nM and harvested 24 h later.
Transfection of plasmid and luciferase assay
EL4 cells were cotransfected with 0.5 ng of pRL-TK Renillaplasmid (Promega) and 100 ng of IL-2 promoter firefly reporter plasmids [pIL-2 (-585)-Luc] (a gift from Dr. A. Rao, Addgene plasmid no. 12194) using Neon electroporation system (Thermo Fisher Scientific) in serum-free medium with one pulse with a voltage of 1080 V and width of 50 ms.
Twenty-four hours after transfection, 106 cells/ml were stimulated with 10 ng/ml PMA and 1mM Iono. Twenty-four hours after stimulation, the cells were lysed and assayed for luciferase activity using a Dual-Luciferase reporter assay system (Promega) in accordance with the manufacturer’s instructions. Cotransfection of aRenillaluciferase plasmid (pRL-TK) was performed to normalize the assays.
ELISA
The amount of IL-2 protein secreted in the supernatants from cell cultures was measured by ELISA in accordance with the manufacturers’ instructions (mouse IL-2 ELISA Ready-SET-Go!; eBioscience). The absorbance was determined using a microplate reader set at 450 nm.
EMSA
Nuclear extracts were prepared from EL4 cells using NXTRACT (Sigma- Aldrich). For binding assays (20ml final volume), 80mg of total nuclear extract from EL4 cells was incubated with 1 mg of 39 biotin-labeled oligonucleotide in the presence of 2ml of 103binding buffer (100 mM Tris, 500 mM KCl, 10 mM DTT [pH 7.5]), 1ml of 50% glycerol, 1mg/ml poly(deoxyinosinic-deoxycytidylic) acid,1% Nonidet P-40, and 10 mM ZnSO4at room temperature for 20 min. The oligonucleotides used in the binding and competition assays were as follows: murine NRE-A sequence, 59-CTGCCACACAGGTAAAGTCTT-39; mutant NRE-A sequence, 59- CTGCCACACATTTAAAGTCTT-39(mutation underlined). Both 39biotin- labeled and unlabeled dsNRE-A and dsNRE-A mutant oligonucleotides (Sigma-Aldrich) were prepared by annealing the single stranded comple- mentary oligonucleotides. All competitors were used at 200-fold excess. For supershift experiments, the nuclear extracts were incubated with anti-ZEB1 Ab (1:100) (TCF8/ZEB1 no. 3396; Cell Signaling Technology), anti-ZEB2 Ab (1:25) (anti-Smad interacting protein no. 138222; Abcam), and anti- CtBP2 Ab (1:25) (no. 13256; Cell Signaling Technology). The binding mixtures were loaded onto a 6% native acrylamide gel (Thermo Fisher Scientific) in Tris/borate/EDTA buffer and electrophoresed for 50 min at room temperature under a constant 100 V. The gels were then transferred to a nylon membrane at 4˚C for 50 min under a constant 100 V and exposed to UV light to crosslink for 15 min. The DNA binding activity was detected using a LightShift chemiluminescent EMSA kit (Thermo Fisher Scientific).
The image was obtained using an LAS-3000 IR.
Chromatin immunoprecipitation assay
Chromatin immunoprecipitation (ChIP) analysis was performed in accor- dance with the manufacturer’s instructions (no. 9005S; Cell Signaling Technology). Briefly, cells were cross-linked with 1% formaldehyde. After the cross-linked cells were lysed, the chromatin was harvested and frag-
The Journal of Immunology 4269
mented with enzymatic digestion using micrococcal nuclease. Nuclear extracts were further treated with an ultrasound sonicator with six sets of 20-s pulses. Immunoprecipitations were performed with ZEB1 (TCF8/
ZEB1 no. 3396; Cell Signaling Technology), ZEB2 (anti-Smad interact- ing protein no. 138222; Abcam), and CtBP2 (no. 13256; Cell Signaling Technology) Abs. After DNA-protein cross-links were reversed, the DNA was purified, and quantitative real-time PCR was performed with the primer pairs as follows: (forward) 59-TCCAGAGAGTCATCAGAAGAGG-39and (reverse) 59-TGGGGGTGTCACGATGTTTTAC-39.
Statistical analyses
All results are shown as the mean6SEM of data from at least three separate experiments, each performed with more than triplicate samples. The dif- ferences between the groups were analyzed for statistical significance using ANOVA with a Tukey–Kramer post hoc test or an unpairedt test, when appropriate, to determine the differences. All statistical analyses were per- formed using the JMP 9.0 software package (SAS Institute, Cary, NC).
Results
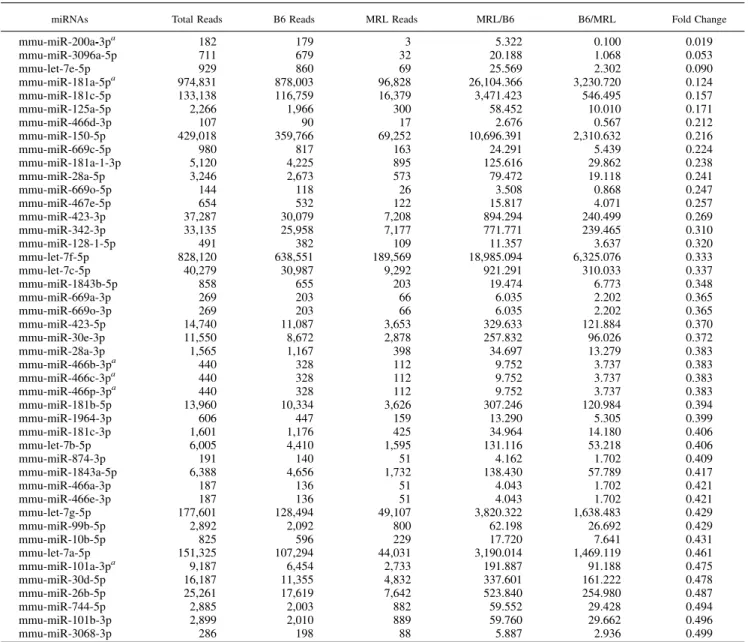
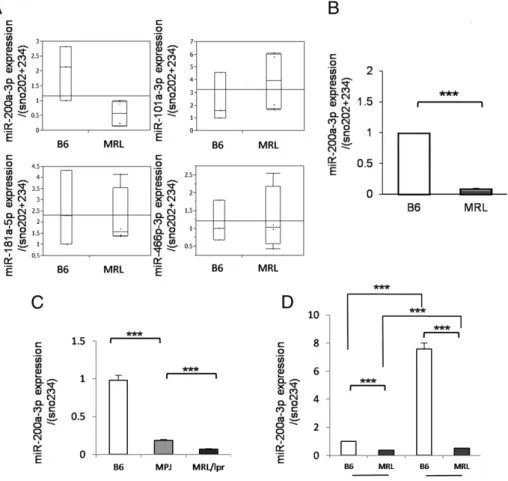
miR-200a-3p is downregulated in murine lupus CD4+T cells To identify new candidate miRNAs involved in the pathogenesis of SLE, we performed Illumina HiSeq to record the expression of
miRNA and mRNA of CD4+T cells isolated from the spleens of MRL/lprmice and B6 mice. A total of 45 miRNAs were down- regulated, and 69 miRNAs were upregulated in MRL/lpr mice compared with the control mice when cut-off values were defined as,0.5 and.2, respectively. In the present study we focused on the miRNAs downregulated in MRL/lprmice compared with B6 mice (Table I). Among these, we selected miRNAs that were down- regulated (,0.5) and were associated with significant upregulation of their target mRNAs demonstrated by RNA sequencing. During the selection process, miR-200a-3p (target mRNAs with signi- ficance: oxidized low-density lipoprotein receptor 1, Tmem56, aldehyde dehydrogenase family 1, subfamily A1 [Aldh1a1]), miR- 181a-5p (Clec4e), miR-101a-3p (Abcd2), and miR-466p-3p (Nrg1, Tex15) were identified. By quantitative real-time PCR, only miR-200a-3p was reproducibly downregulated in MRL/lpr mice compared with B6 mice (Fig. 1B). Next, we assessed whether the B6 mouse is appropriate as the control of MRL/lpr and whether the genetic background affected the expression of miR-200a-3p. Age- and sex-matched MRL/MPJ (Fas+/+) mice that present late and mild autoimmune phenotype (23, 24) were in-
Table I. miRNAs downregulated in CD4+T cells derived from MRL/lprmice compared with B6 mice
miRNAs Total Reads B6 Reads MRL Reads MRL/B6 B6/MRL Fold Change
mmu-miR-200a-3pa 182 179 3 5.322 0.100 0.019
mmu-miR-3096a-5p 711 679 32 20.188 1.068 0.053
mmu-let-7e-5p 929 860 69 25.569 2.302 0.090
mmu-miR-181a-5pa 974,831 878,003 96,828 26,104.366 3,230.720 0.124
mmu-miR-181c-5p 133,138 116,759 16,379 3,471.423 546.495 0.157
mmu-miR-125a-5p 2,266 1,966 300 58.452 10.010 0.171
mmu-miR-466d-3p 107 90 17 2.676 0.567 0.212
mmu-miR-150-5p 429,018 359,766 69,252 10,696.391 2,310.632 0.216
mmu-miR-669c-5p 980 817 163 24.291 5.439 0.224
mmu-miR-181a-1-3p 5,120 4,225 895 125.616 29.862 0.238
mmu-miR-28a-5p 3,246 2,673 573 79.472 19.118 0.241
mmu-miR-669o-5p 144 118 26 3.508 0.868 0.247
mmu-miR-467e-5p 654 532 122 15.817 4.071 0.257
mmu-miR-423-3p 37,287 30,079 7,208 894.294 240.499 0.269
mmu-miR-342-3p 33,135 25,958 7,177 771.771 239.465 0.310
mmu-miR-128-1-5p 491 382 109 11.357 3.637 0.320
mmu-let-7f-5p 828,120 638,551 189,569 18,985.094 6,325.076 0.333
mmu-let-7c-5p 40,279 30,987 9,292 921.291 310.033 0.337
mmu-miR-1843b-5p 858 655 203 19.474 6.773 0.348
mmu-miR-669a-3p 269 203 66 6.035 2.202 0.365
mmu-miR-669o-3p 269 203 66 6.035 2.202 0.365
mmu-miR-423-5p 14,740 11,087 3,653 329.633 121.884 0.370
mmu-miR-30e-3p 11,550 8,672 2,878 257.832 96.026 0.372
mmu-miR-28a-3p 1,565 1,167 398 34.697 13.279 0.383
mmu-miR-466b-3pa 440 328 112 9.752 3.737 0.383
mmu-miR-466c-3pa 440 328 112 9.752 3.737 0.383
mmu-miR-466p-3pa 440 328 112 9.752 3.737 0.383
mmu-miR-181b-5p 13,960 10,334 3,626 307.246 120.984 0.394
mmu-miR-1964-3p 606 447 159 13.290 5.305 0.399
mmu-miR-181c-3p 1,601 1,176 425 34.964 14.180 0.406
mmu-let-7b-5p 6,005 4,410 1,595 131.116 53.218 0.406
mmu-miR-874-3p 191 140 51 4.162 1.702 0.409
mmu-miR-1843a-5p 6,388 4,656 1,732 138.430 57.789 0.417
mmu-miR-466a-3p 187 136 51 4.043 1.702 0.421
mmu-miR-466e-3p 187 136 51 4.043 1.702 0.421
mmu-let-7g-5p 177,601 128,494 49,107 3,820.322 1,638.483 0.429
mmu-miR-99b-5p 2,892 2,092 800 62.198 26.692 0.429
mmu-miR-10b-5p 825 596 229 17.720 7.641 0.431
mmu-let-7a-5p 151,325 107,294 44,031 3,190.014 1,469.119 0.461
mmu-miR-101a-3pa 9,187 6,454 2,733 191.887 91.188 0.475
mmu-miR-30d-5p 16,187 11,355 4,832 337.601 161.222 0.478
mmu-miR-26b-5p 25,261 17,619 7,642 523.840 254.980 0.487
mmu-miR-744-5p 2,885 2,003 882 59.552 29.428 0.494
mmu-miR-101b-3p 2,899 2,010 889 59.760 29.662 0.496
mmu-miR-3068-3p 286 198 88 5.887 2.936 0.499
The candidate miRNAs are sorted by fold change.
amiRNAs analyzed in Fig. 1A.
cluded to control for the genetic background. As shown in Fig. 1C, the levels of miR-200a-3p were still significantly decreased in MRL/lprmice compared with MRL/MPJ mice, and MRL/MPJ mice also presented lower levels of miR-200a-3p compared with B6 mice. As shown in Fig. 1D, the levels of miR-200a-3p were already decreased in MRL/lpr mice compared with B6 mice at younger age (8 wk old). miR-200a-3p levels increased at older age in both mice; however, the expression was still significantly lower in MRL/lprmice. These results suggest that decreased miR-200a- 3p is seen in MRL/MPJ mice independent of the Fas mutation, and the trend starts prior to the onset of disease.
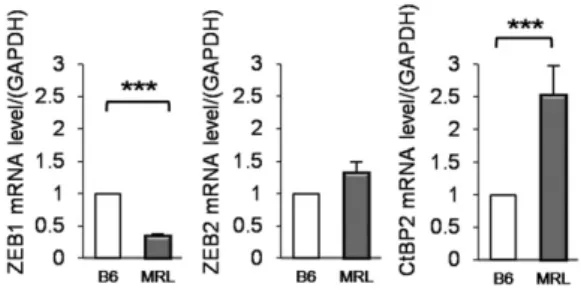
ZEB2 and CtBP2 are the candidate targets of miR-200a-3p We next investigated the target genes of miR-200a-3p that were up- regulated in MRL/lpr compared with B6 mice. We retrieved the predicted and validated target genes of miR-200a-3p using TargetS- can, and their mRNA expressions were evaluated by RNA sequencing data. As the candidate target genes of miR-200a-3p, oxidized low- density lipoprotein receptor 1, Aldh1a1, ZEB2, CtBP2, and Kr€uppel- like factor 12 were selected, because they demonstrated upregulation with statistically significant differences or have been reported to be functionally related to the regulation of the immune system. Among them, Aldh1a1, ZEB2, and CtBP2 were reproducibly upregulated (Fig. 2 and data not shown). Because CtBP2 and ZEBs are tran- scription factors and form the complex coordinating the expression of various genes, we focused on CtBP2 and ZEB2. The mRNA ex- pression of ZEB1 was rather reduced by RNA sequencing (Fig. 2), and we further confirmed the mRNA expression by quantitative RT- PCR. Because the target sequence for miR-200a-3p was confirmed in the 39-UTR of both the ZEB1 and ZEB2 genes, and because both ZEB1 and ZEB2 recruit CtBP2 for its suppressive activity, we in- vestigated both ZEB1 and ZEB2 in the subsequent experiments.
Gain of function of miR-200a-3p decreases ZEB1/ZEB2/CtBP2 expression and increases IL-2 production
To determine the gain effect of miR-200a-3p, miR-200a-3p mimic or control mimic was transfected into EL4 mouse T cell lines by lipofection. The transfection efficacy of miR-200a-3p was con- firmed by quantitative PCR in each experiment (Fig. 3A). As shown in Fig. 3B, the mRNA levels of ZEB1, ZEB2, and CtBP2 were significantly decreased upon overexpression of miR-200a- 3p, demonstrating that miR-200a-3p negatively regulates the ex- pressions of ZEB1, ZEB2, and CtBP2.
We also assessed whether miR-200a-3p influences IL-2 ex- pression, because it has been reported that ZEB1 suppresses IL-2 by recruiting CtBP2 (17). EL4 T cells transfected with miR-200a- 3p mimic or control mimic were stimulated with PMA (10 ng/ml) and Iono (1mM). IL-2 mRNA levels were measured by quanti- tative PCR after 6 h of PMA/Iono stimulation, and IL-2 protein levels in the supernatants were measured by ELISA after 24 h of stimulation. As shown in Fig. 3C (left) and 3D (left), IL-2 ex- pression was significantly upregulated by the overexpression of miR200a-3p at both the mRNA and cytokine levels. IL-2 ex- pression displayed the same change when cells were stimulated with anti-CD3/CD28 Abs (Fig. 3C, right, 3D, right), although the peak of IL-2 expression was later compared with the stimulation with PMA/Iono (peak at 6 h versus 24 h). In the following ex- periments, PMA/Iono stimulation was chosen considering that it evokes higher levels of IL-2 and at earlier time points. We then performed luciferase reporter assays to determine whether miR- 200a-3p regulated IL-2 promoter activity. We used pIL-2(-585)- Luc, which includes the murine IL-2 promoter2585 to234 rela- tive to the transcription start site (25). EL4 T cells were cotrans- fected with IL-2 promoter luciferase construct and miR-200a-3p
FIGURE 1. The downregulation of miR-200a-3p in CD4+T cells of MRL mice. (A) The expression of miR-200a- 3p, miR-181a-5p, miR-101a-3p, and miR- 466p-3p (combination of miR-466b-3p, miR-466c-3p, and miR-466p-3p) was evaluated by TaqMan quantitative PCR.
(B) The miR-200a-3p expression was evaluated in MRL mice compared with B6 mice (n= 5 per B6 group andn= 4 per MRL group, 16-wk-old female). (C) The miR-200a-3p expression was eval- uated in MRL mice compared with B6 and MRL/MPJ mice (n= 3 per group, 16-wk-old female). (D) The miR-200a- 3p expression was evaluated in 8-wk-old mice compared with 16-wk-old mice (n= 3 per group, female) (mean6SEM).
***p,0.0001.
The Journal of Immunology 4271
mimic or control mimic and stimulated with PMA/Iono for 24 h that has been set as the peak of IL-2 according to the pre-examined time course. As shown in Fig. 3E, the overexpression of miR-200a-3p significantly increased the IL-2 promoter activity after 24 h of stimulation. These results indicate that miR-200a-3p promotes IL-2 production through the activation of the IL-2 promoter and suggest that miR-200a-3p modulates the ZEB1, ZEB2, and CtBP2 expres- sion and activity for the transcriptional regulation of IL-2 production.
miR-200a-3p underrecruits ZEB1, ZEB2, and CtBP2 directly to the IL-2 promoter
We next investigated whether miR-200a-3p has an effect on the direct bindings of ZEB1, ZEB2, and CtBP2 to the IL-2 promoter.
It has been reported that ZEB1 binds to NRE-A 100 bp from the transcription start site of the IL-2 gene and suppresses IL-2 production (16) (Fig. 4A). Additionally, ZEB1 and ZEB2 have been reported to recognize 59-CACCT-39 in various promoters by their zinc finger cluster, which also applies to the NRE-A sequence (26). To determine whether ZEB1, ZEB2, and CtBP2 bind to NRE-A under the regulation of miR-200a-3p, EMSA was first performed in an EL4 cell line overexpressing miR- 200a-3p. Nuclear extracts isolated from the EL4 cells with 6 h stimulation of PMA/Iono were incubated with 39biotin-labeled dsNRE-A oligonucleotide in EMSA. The protein–NRE-A mix- tures were then subjected to a native PAGE. As shown in lanes 1–6 of Fig. 4B, the specific band position of protein–NRE-A probe complex was primarily examined as positive control band. The protein–NRE-A probe complex (lane 1) was abol- ished by 200-fold excess of unlabeled NRE-A probe (lane 2), whereas an equal amount of unlabeled mutant–NRE-A probe failed to achieve such effects (lane 3). A supershift assay was performed using the Abs against the transcription factors and showed that ZEB1 (filled arrow in Fig. 4B, lane 4) and CtBP2 with a faint band, but not ZEB2, were composed of a complex of proteins and oligonucleotide.
Furthermore, the overexpression of miR-200a-3p mimic reduced the protein–NRE-A complex compared with negative control mimic (open arrows in Fig. 4B, lanes 7 and 8), demonstrating that miR-200a-3p reduces the binding of ZEB1 and CtBP2 on NRE-A, which results in a reduction in the suppressive activity of the FIGURE 2. Upregulation the ZEB2 and CtBP2 expression in the CD4+
T cells of MRL/lprmice. The expression of ZEB2 and CtBP2 in CD4+ T cells of mice spleen was evaluated by TaqMan quantitative PCR (n= 9 per group, 16-wk-old female) (mean6SEM). ***p,0.0001.
FIGURE 3. miR-200a-3p mimic–induced IL-2 production under stimulation in EL4 T cell lines as a gain-of-function analysis. (A) The transfection efficacy of miR-200a-3p mimic was confirmed by TaqMan quantitative PCR. miR-200a-3p was transfected by lipofection, and the expression was compared with the negative control mimic after 24 h transfection. (B) The mRNA levels of ZEB1, ZEB2, and CtBP2 after the overexpression of miR-200a- 3p were confirmed by TaqMan quantitative PCR. (C) The mRNA level of IL-2 after the overexpression of miR-200a-3p was evaluated by TaqMan quantitative PCR. EL4 cells were transfected with either miR-200a-3p mimic or negative control mimic. After 24 h transfection, 106cells/ml were stimulated with PMA (10 ng/ml) and Ionomycin (1mM), or 23106cells/ml were stimulated with plate-bound anti-CD3 (2mg/ml) and anti-CD28 (2mg/ml) Abs. After stimulation, IL-2 mRNA level was evaluated by TaqMan quantitative PCR. Left; PMA/Iono stim for 6 h. Right; anti-CD3/CD28 Abs stim for 24 h. (D) The IL-2 cytokine level in the supernatant of the cells was evaluated by ELISA. After 24 h stimulation, the supernatant of the culture medium were harvested. Left; PMA/Iono stim. Right; anti-CD3/CD28 Abs stim. (E) The IL-2 promoter activity was evaluated by a luciferase assay. EL4 cells were cotransfected with miR-200a-3p mimic or negative control mimic and with the construct driven by the IL-2 promoter (2585 to234 relative to transcription start site) or empty vector by electroporation. The luciferase activity was measured after 24 h stimulation (mean6SEM). Data are shown from six (Aand B) and three (C–E) independent experiments. *p,0.05, **p,0.01, ***p,0.001. NC, negative control.
ZEB1–CtBP2 complex on the IL-2 promoter. To further confirm this notion, we performed a ChIP assay. EL4 cells transfected with miR-200a-3p mimics or control mimics were stimulated for 6 h and then advanced to the crosslink step. The ChIP assay showed significantly reduced recruitment of ZEB1, ZEB2, and CtBP2 on NRE-A under conditions of overexpression of miR-200a-3p (Fig. 5A), indicating that ZEB2 is also able to bind to NRE-A and is negatively regulated by miR-200a-3p.
The ZEB1–CtBP2 complexes fail to dissociate from the NRE-A in the IL-2 promoter after stimulation in lupus-prone mice To clarify whether ZEB1–CtBP2 and ZEB2–CtBP2 (ZEB1/ZEB2–
CtBP2) complexes on NRE-A influence the IL-2 production after stimulation in lupus-derived T cells, we performed ChIP assays using CD4+T cells derived from the spleen of MRL/lprmice and B6 mice. At first, IL-2 hypoproduction was confirmed anew in MRL/lpr-derived CD4+ T cells compared with B6 (Fig. 5B).
Regarding the dynamics of the ZEB1 on NRE-A, it has been reported that the binding activity reached its peak at 6 h after PMA/Iono stimulation, after which the binding abruptly declines at 9 h of stimulation in EL4 cells (16). This is consistent with the time course of IL-2 transcription initiation after PMA/Iono stim- ulation, as can be seen in Fig. 3C. Therefore, the time course was set as 0, 6, and 9 h. As expected, the dynamics of the binding of ZEB1, ZEB2, and CtBP2 to NRE-A reached a peak at 6 h and significantly decreased at 9 h after PMA/Ion stimulation in B6 mice (Fig. 5C). Alternatively, the kinetics was impaired in MRL/lpr mice, and the binding levels for ZEB1 and CtBP2 but not ZEB2 were significantly higher throughout the time course of the ex- periment after stimulation (Fig. 5C).
These results indicate that the ZEB1–CtBP2 complexes in MRL/lpr mice are unresponsive to the stimulation and fail to dissociate from
the NRE-A, whereas the complex dissociates from NRE-A under stimulation to produce sufficient IL-2 in the control mice (Fig. 5C, 6 h versus 9 h). The binding ability of ZEB2 was also accumulated after stimulation in MRL/lpr-derived CD4+T cells; however, the enrichment was rather low in MRL/lpr mice compared with B6 cells (Fig. 5C). These results demonstrated that the dysregulation of ZEB1–CtBP2 complexes binding to NRE-A upon the stimulation is crucially associated with IL-2 hypoproduction in MRL/lpr mice.
Taken together with the gain-of-function findings in EL4 cells, these results suggest that miR-200a-3p regulates the ZEB1/ZEB2–CtBP2 complexes on NRE-A upon stimulation in murine T cells and in- fluences IL-2 production (Fig. 6A). In the lupus model, the ZEB1–
CtBP2 complex is critical in suppressing IL-2 and ZEB2 may be only partially regulated by miR-200a-3p (Fig. 6B).
Discussion
In the present study, we found that miR-200a-3p positively reg- ulates IL-2 production in murine T cells through the recruitment of ZEB1–CtBP2 and ZEB2–CtBP2 (ZEB1/ZEB2–CtBP2) com- plexes to the IL-2 gene promoter. Also in humans, the serum and urinary levels of miR-200a, miR-200b, and miR-200c have been reported to be significantly decreased in active SLE patients compared with healthy subjects. Additionally, the miR-200a ex- pression correlated inversely with proteinuria and SLEDAI (27).
This report supports our data and suggests that miR-200a may also play an important role in patients with SLE.
It has been determined that all miR-200 family members neg- atively regulate ZEB1 and ZEB2 and suppress EMT by binding to the 39-UTR of ZEB1 and ZEB2, whereas ZEB1 and ZEB2 bind to the promoter region of the miR-200 family members and decrease the expression of the miR-200 family in various cancer models (28–34). miR-200 family members are divided into two groups FIGURE 4. Reduction in the recruitment of ZEB1 and
CtBP2 on NRE-A of IL-2 promoter by overexpression of miR-200a-3p. (A) A negative regulatory element (NRE- A) is located at2110 to2101 from the transcription start site of IL-2. The C-terminal zinc finger cluster of ZEB1 binds to NRE-A and suppresses IL-2 production.
The underlined sequences are conserved. (B) Binding activity of the ZEB1–CtBP2 and ZEB2–CtBP2 (ZEB1/
ZEB2–CtBP2) complexes with NRE-A was determined by EMSA using EL4 T cells. As positive controls, EL4 cells without mimic were stimulated with PMA/Iono for 6 h and their nuclear proteins were subsequently extracted. The positive control nuclear proteins were used in lanes 1–6. miR-200a-3p mimic or negative con- trol mimic was transfected into the EL4 T cells and similarly stimulated, and the nuclear protein was applied (lanes 7 and 8). Lanes 1–3 show the competition effects.
The specific NRE-A protein band was competed with 200-fold excess unlabeled NRE probe (lane 2) but failed to compete with 200-fold excess unlabeled mutant probe (lane 3). Lanes 4–6 are for the supershift bands: anti- ZEB1, ZEB2, or CtBP2 Abs were added, respectively.
The open arrows in lanes 7 and 8 show NRE-A protein binding with miR-200a-3p mimic or negative control mimic, respectively.
The Journal of Immunology 4273
according to their seed sequences: the first one is miR-141 and miR-200a; the second one is miR-200b, miR-200c, and miR-429.
These two had quite similar seed sequences: miR-141 and miR- 200a recognize 59-AACACU-39, and miR-200b, miR-200c, and miR-429 recognize 59-AAUACU-39(33). Eight miR-200 binding sites are included in 39-UTR of ZEB1 and nine binding site in the 39-UTR of ZEB2. This ZEB/miR-200 double-negative feedback loop controls ZEB factors, the strong EMT inducers of cancer metastasis. The ZEB/miR-200 loop also might be related with senescence (35–37) and apoptosis (38–41), which promote the development of cancer.
ZEB1 was first reported as Nil-2-a to bind to NRE-A and suppress IL-2 in Jurkat T cells. ZEB1 is also associated with the differential production of IL-2 in Th1/2 EL4 cells. Although there is no previous report on the mechanism whereby ZEB2 influences IL-2 production, it has been reported that ZEB2 also binds to 59- CACCT-39in the NRE-A sequence through its zinc finger motif (42). Our study has revealed the impaired balance of miR-200a-3p and ZEB1/ZEB2 in murine T cells and demonstrated the func- tional impact of miR-200a-3p on IL-2 production.
There is some discrepancy between gain-of-function analysis in EL4 cells and mouse primary CD4+T cells in the point that ZEB1 mRNA and the ZEB2–CtBP2 complex were not fully regulated in MRL/lprmice with decreased level of miR-200a-3p. These results suggest the presence of other regulators in vivo and that the miR- 200a-3p/ZEB1/ZEB2 loop in MRL/lpr mice might also be regu- lated by other miRNAs or transcription factors or suppressors.
Because IL-2 production under stimulation in SLE is markedly impaired, we were intrigued by the effects of the ZEB1, ZEB2, and
CtBP2 on NRE-A after stimulation. It was previously reported that c-Rel, an activator of IL-2, failed to access near the NRE-A site with anti-CD3/CD28 stimulation, whereas the activator was able to bind with PMA/Iono stimulation (43). This fact may suggest that anti-CD3/CD28 stimulation is not sufficient for dissociating sup- pressive factors on the NRE-A, and therefore we selected PMA/
Iono stimulation to assess the NRE-A binding ability. As expected, ZEB1 and CtBP2, except ZEB2, were significantly accumulated on the NRE in MRL/lprmice compared with B6 mice after stimulation (Fig. 5C). CtBP2 was consistently upregulated in MRL/lprmice at the mRNA and nuclear protein levels in MRL/lpr CD4+ T cells (Figs. 2, 5C). CtBP2 is critically regulated by miR-200a-3p, which has the essential role for suppressing ability of ZEB1 and ZEB2 against IL-2.
It is still unclear which factors regulate the transcriptional ac- tivities and maturation of miR-200a-3p. As mentioned before, ZEB1 and ZEB2 are known to directly regulate the miR-200 family. In- terestingly, EBV negatively regulates miR-200a and miR-200b in gastric cancer (44). EBV is considered as a trigger for the onset of SLE; therefore, an miR-200a-3p–mediated pathway might be a candidate for the development of SLE.
It is also intriguing that the miR-200a-3p may act on Tregs. If miR-200a-3p can regulate Tregs by increasing IL-2, then targeting Tregs may be a useful therapeutic option for patients with SLE. Our study revealed the critical role of miR-200a-3p in the regulation of IL-2 through ZEB1, ZEB2, and CtBP2. An IL-2 defect in SLE is linked to a reduction in the numbers of Tregs and an increase in the numbers of autoreactive T cells. Low-dose IL-2 therapy has shown promising results in correcting reduced numbers of Tregs in SLE FIGURE 5. The impaired dynamics of ZEB1, ZEB2, and CtBP2 on NRE-A regulated by miR-200a-3p. (A) The complex between NRE-A and ZEB1–
CtBP2 and ZEB2–CtBP2 (ZEB1/ZEB2–CtBP2) complex after miR-200a-3p overexpression was confirmed by a ChIP assay. EL4 cells were transfected either with miR-200a-3p mimic or negative control mimic and stimulated with PMA/Iono. After 6 h stimulation, the cells were harvested and directly advanced to the crosslink step. Quantitative PCR was performed using an NRE-A primer. The ChIP results are presented as a percentage of 2% input DNA.
(B) The cytokine levels of IL-2 were evaluated by ELISA. MRL- or B6-derived CD4+T cells were stimulated with PMA/Iono for 9 h and each supernatant was subsequently harvested. (C) The ZEB1/ZEB2–CtBP2 complex on NRE-A of MRL and B6 mice under stimulation was evaluated by a ChIP assay.
Primary CD4+T cells from MRL or B6 mice were stimulated with PMA/Iono for 6 and 9 h. The cells were promptly advanced to the crosslink step.
Quantitative PCR was performed using an NRE-A primer. The ChIP results are presented as a percentage of 2% input DNA (mean6SEM). Data are shown from three independent experiments (A), three independent experiments withn= 3 per group (B), andn= 8 per MRL group,n= 40 per B6 group, 14-wk-old female (C). *p,0.05, **p,0.01, ***p,0.001.
(5). Therefore, investigating the mechanism of IL-2 defect will clarify the central pathogenesis of SLE.
In conclusion, we have demonstrated that miR-200a-3p posi- tively regulates IL-2 through the ZEB1/ZEB2–CtBP2 complexes binding to the NRE-A site of the IL-2 promoter in murine T cells.
The ability of the ZEB1–CtBP2 complexes to dissociate from the NRE-A cite was impaired upon PMA/Iono stimulation in MRL/
lpr-derived CD4+T cells compared with B6. miR-200a-3p mimics may therefore be useful for correcting the IL-2 defect in SLE by regulating the ZEB1/ZEB2–CtBP2 complexes.
Acknowledgments
We thank all the medical staff members at our department.
Disclosures
J.W. receives speaker honoraria from Astellas, Boehringer Ingelheim, Novartis, and Tanabe Mitsubishi and receives grant support from Astellas, Bayer, Chugai, Daiichi Sankyo, Kissei, Kyowa Hakko Kirin, MSD, Otsuka, Teijin, Torii, Pfizer, Takeda, and Taisho Toyama. The other authors have no financial conflicts of interest.
References
1. Tsokos, G. C. 2011. Systemic lupus erythematosus.N. Engl. J. Med.365: 2110–2121.
2. Alcocer-Varela, J., and D. Alarco´n-Segovia. 1982. Decreased production of and response to interleukin-2 by cultured lymphocytes from patients with systemic lupus erythematosus.J. Clin. Invest.69: 1388–1392.
3. Dauphine´e, M. J., S. B. Kipper, D. Wofsy, and N. Talal. 1981. Interleukin 2 defi- ciency is a common feature of autoimmune mice.J. Immunol.127: 2483–2487.
4. Humrich, J. Y., H. Morbach, R. Undeutsch, P. Enghard, S. Rosenberger, O. Weigert, L. Kloke, J. Heimann, T. Gaber, S. Brandenburg, et al. 2010. Homeostatic imbalance of regulatory and effector T cells due to IL-2 deprivation amplifies murine lupus.
Proc. Natl. Acad. Sci. USA107: 204–209.
5. von Spee-Mayer, C., E. Siegert, D. Abdirama, A. Rose, A. Klaus, T. Alexander, P. Enghard, B. Sawitzki, F. Hiepe, A. Radbruch, et al. 2016. Low-dose
interleukin-2 selectively corrects regulatory T cell defects in patients with sys- temic lupus erythematosus.Ann. Rheum. Dis.75: 1407–1415.
6. Juang, Y. T., Y. Wang, E. E. Solomou, Y. Li, C. Mawrin, K. Tenbrock, V. C. Kyttaris, and G. C. Tsokos. 2005. Systemic lupus erythematosus serum IgG increases CREM binding to the IL-2 promoter and suppresses IL-2 production through CaMKIV.J. Clin. Invest.115: 996–1005.
7. Solomou, E. E., Y. T. Juang, M. F. Gourley, G. M. Kammer, and G. C. Tsokos.
2001. Molecular basis of deficient IL-2 production in T cells from patients with systemic lupus erythematosus.J. Immunol.166: 4216–4222.
8. Koga, T., K. Ichinose, M. Mizui, J. C. Crispı´n, and G. C. Tsokos. 2012. Calcium/
calmodulin-dependent protein kinase IV suppresses IL-2 production and regu- latory T cell activity in lupus.J. Immunol.189: 3490–3496.
9. Katsiari, C. G., V. C. Kyttaris, Y. T. Juang, and G. C. Tsokos. 2005. Protein phosphatase 2A is a negative regulator of IL-2 production in patients with systemic lupus erythematosus.J. Clin. Invest.115: 3193–3204.
10. Vandewalle, C., F. Van Roy, and G. Berx. 2009. The role of the ZEB family of transcription factors in development and disease.Cell. Mol. Life Sci.66: 773–787.
11. Barrallo-Gimeno, A., and M. A. Nieto. 2005. The Snail genes as inducers of cell movement and survival: implications in development and cancer.Development 132: 3151–3161.
12. Hugo, H., M. L. Ackland, T. Blick, M. G. Lawrence, J. A. Clements, E. D. Williams, and E. W. Thompson. 2007. Epithelial–mesenchymal and mesenchymal–epithelial transitions in carcinoma progression.J. Cell. Physiol.213: 374–383.
13. Peinado, H., D. Olmeda, and A. Cano. 2007. Snail, Zeb and bHLH factors in tumour progression: an alliance against the epithelial phenotype?Nat. Rev. Cancer7: 415–428.
14. Williams, T. M., D. Moolten, J. Burlein, J. Romano, R. Bhaerman, A. Godillot, M. Mellon, F. J. Rauscher, III, and J. A. Kant. 1991. Identification of a zinc finger protein that inhibits IL-2 gene expression.Science254: 1791–1794.
15. Ikeda, K., and K. Kawakami. 1995. DNA binding through distinct domains of zinc-finger-homeodomain protein AREB6 has different effects on gene tran- scription.Eur. J. Biochem.233: 73–82.
16. Yasui, D. H., T. Genetta, T. Kadesch, T. M. Williams, S. L. Swain, L. V. Tsui, and B. T. Huber. 1998. Transcriptional repression of the IL-2 gene in Th cells by ZEB.J. Immunol.160: 4433–4440.
17. Wang, J., S. Lee, C. E. Teh, K. Bunting, L. Ma, and M. F. Shannon. 2009. The transcription repressor, ZEB1, cooperates with CtBP2 and HDAC1 to suppress IL-2 gene activation in T cells.Int. Immunol.21: 227–235.
18. Postigo, A. A., and D. C. Dean. 1999. ZEB represses transcription through in- teraction with the corepressor CtBP.Proc. Natl. Acad. Sci. USA96: 6683–6688.
19. Mello, C. C., and D. Conte, Jr. 2004. Revealing the world of RNA interference.
Nature431: 338–342.
20. Hedrich, C. M., and G. C. Tsokos. 2011. Epigenetic mechanisms in systemic lupus erythematosus and other autoimmune diseases.Trends Mol. Med.17: 714–724.
FIGURE 6. Model of IL-2 regulation by miR-200a-3p in murine T cells through ZEB1–CtBP2 and/or ZEB2–CtBP2 com- plex. (A) miR-200a-3p negatively regulates the recruitment of suppressive transcrip- tion factors (ZEB1 or ZEB2 and CtBP2) on NRE-A and promotes IL-2 production in murine T cells. (B) After PMA/Iono stimula- tion, the ZEB1–CtBP2 complexes disso- ciate from NRE-A in normal CD4+T cells and produce IL-2. In contrast, the complexes hardly dissociate from NRE-A in primary murine lupus CD4+T cells after stimulation and subsequently fail to produce IL-2.
ZEB, ZEB1 or ZEB2.
The Journal of Immunology 4275
21. Fan, W., D. Liang, Y. Tang, B. Qu, H. Cui, X. Luo, X. Huang, S. Chen, B. W. Higgs, B. Jallal, et al. 2012. Identification of microRNA-31 as a novel regulator contributing to impaired interleukin-2 production in T cells from pa- tients with systemic lupus erythematosus.Arthritis Rheum.64: 3715–3725.
22. Lashine, Y. A., S. Salah, H. R. Aboelenein, and A. I. Abdelaziz. 2015. Correcting the expression of miRNA-155 represses PP2Ac and enhances the release of IL-2 in PBMCs of juvenile SLE patients.Lupus24: 240–247.
23. McGaha, T. L., Z. Ma, B. Ravishankar, K. Gabunia, M. McMenamin, and M. P. Madaio. 2012. Heterologous protein incites abnormal plasma cell accu- mulation and autoimmunity in MRL-MpJ mice.Autoimmunity45: 279–289.
24. Ede, K., K. K. Hwang, C. C. Wu, M. Wu, Y. H. Yang, W. S. Lin, D. Chien, P. C. Chen, B. P. Tsao, D. K. McCurdy, and P. P. Chen. 2009. Plasmin immu- nization preferentially induces potentially prothrombotic IgG anticardiolipin antibodies in MRL/MpJ mice.Arthritis Rheum.60: 3108–3117.
25. Macia´n, F., C. Garcı´a-Rodrı´guez, and A. Rao. 2000. Gene expression elicited by NFAT in the presence or absence of cooperative recruitment of Fos and Jun.
EMBO J.19: 4783–4795.
26. Remacle, J. E., H. Kraft, W. Lerchner, G. Wuytens, C. Collart, K. Verschueren, J. C. Smith, and D. Huylebroeck. 1999. New mode of DNA binding of multi-zinc finger transcription factors:dEF1 family members bind with two hands to two target sites.EMBO J.18: 5073–5084.
27. Wang, G., L. S. Tam, E. K. Li, B. C. Kwan, K. M. Chow, C. C. Luk, P. K. Li, and C. C. Szeto. 2011. Serum and urinary free microRNA level in patients with systemic lupus erythematosus.Lupus20: 493–500.
28. Brabletz, S., and T. Brabletz. 2010. The ZEB/miR-200 feedback loop—a motor of cellular plasticity in development and cancer?EMBO Rep.11: 670–677.
29. Christoffersen, N. R., A. Silahtaroglu, U. A. Orom, S. Kauppinen, and A. H. Lund.
2007. miR-200b mediates post-transcriptional repression of ZFHX1B.RNA13:
1172–1178.
30. Hurteau, G. J., J. A. Carlson, S. D. Spivack, and G. J. Brock. 2007. Over- expression of the microRNA hsa-miR-200c leads to reduced expression of transcription factor 8 and increased expression of E-cadherin.Cancer Res.67:
7972–7976.
31. Burk, U., J. Schubert, U. Wellner, O. Schmalhofer, E. Vincan, S. Spaderna, and T. Brabletz. 2008. A reciprocal repression between ZEB1 and members of the miR-200 family promotes EMT and invasion in cancer cells.EMBO Rep.9:
582–589.
32. Gregory, P. A., A. G. Bert, E. L. Paterson, S. C. Barry, A. Tsykin, G. Farshid, M. A. Vadas, Y. Khew-Goodall, and G. J. Goodall. 2008. The miR-200 family and miR-205 regulate epithelial to mesenchymal transition by targeting ZEB1 and SIP1.Nat. Cell Biol.10: 593–601.
33. Korpal, M., E. S. Lee, G. Hu, and Y. Kang. 2008. The miR-200 family inhibits epithelial-mesenchymal transition and cancer cell migration by direct targeting of E-cadherin transcriptional repressorsZEB1andZEB2.J. Biol. Chem.283:
14910–14914.
34. Park, S. M., A. B. Gaur, E. Lengyel, and M. E. Peter. 2008. The miR-200 family determines the epithelial phenotype of cancer cells by targeting the E-cadherin repressors ZEB1 and ZEB2.Genes Dev.22: 894–907.
35. Lin, S. Y., and S. J. Elledge. 2003. Multiple tumor suppressor pathways nega- tively regulate telomerase.Cell113: 881–889.
36. Liu, Y., S. El-Naggar, D. S. Darling, Y. Higashi, and D. C. Dean. 2008. Zeb1 links epithelial-mesenchymal transition and cellular senescence.Development 135: 579–588.
37. Ohashi, S., M. Natsuizaka, G. S. Wong, C. Z. Michaylira, K. D. Grugan, D. B. Stairs, J. Kalabis, M. E. Vega, R. A. Kalman, M. Nakagawa, et al. 2010.
Epidermal growth factor receptor and mutant p53 expand an esophageal cellular subpopulation capable of epithelial-to-mesenchymal transition through ZEB transcription factors.Cancer Res.70: 4174–4184.
38. Wellner, U., J. Schubert, U. C. Burk, O. Schmalhofer, F. Zhu, A. Sonntag, B. Waldvogel, C. Vannier, D. Darling, A. zur Hausen, et al. 2009. The EMT- activator ZEB1 promotes tumorigenicity by repressing stemness-inhibiting microRNAs.Nat. Cell Biol.11: 1487–1495.
39. Sayan, A. E., T. R. Griffiths, R. Pal, G. J. Browne, A. Ruddick, T. Yagci, R. Edwards, N. J. Mayer, H. Qazi, S. Goyal, et al. 2009. SIP1 protein protects cells from DNA damage-induced apoptosis and has independent prognostic value in bladder cancer.Proc. Natl. Acad. Sci. USA106: 14884–14889.
40. Tryndyak, V. P., F. A. Beland, and I. P. Pogribny. 2010. E-cadherin transcrip- tional down-regulation by epigenetic and microRNA-200 family alterations is related to mesenchymal and drug-resistant phenotypes in human breast cancer cells.Int. J. Cancer126: 2575–2583.
41. Schickel, R., S. M. Park, A. E. Murmann, and M. E. Peter. 2010. miR-200c regulates induction of apoptosis through CD95 by targeting FAP-1.Mol. Cell38:
908–915.
42. Verschueren, K., J. E. Remacle, C. Collart, H. Kraft, B. S. Baker, P. Tylzanowski, L. Nelles, G. Wuytens, M. T. Su, R. Bodmer, et al. 1999. SIP1, a novel zinc finger/homeodomain repressor, interacts with Smad proteins and binds to 59- CACCT sequences in candidate target genes.J. Biol. Chem.274: 20489–20498.
43. Rao, S., S. Gerondakis, D. Woltring, and M. F. Shannon. 2003. c-Rel is required for chromatin remodeling across the IL-2 gene promoter.J. Immunol.170: 3724–
3731.
44. Shinozaki, A., T. Sakatani, T. Ushiku, R. Hino, M. Isogai, S. Ishikawa, H. Uozaki, K. Takada, and M. Fukayama. 2010. Downregulation of microRNA- 200 in EBV-associated gastric carcinoma.Cancer Res.70: 4719–4727.