and their Anisotropic Optical Properties
by
Yoichi Murakami
A
T
HESISS
UBMITTED INP
ARTIALF
ULFILLMENT OF THER
EQUIREMENTS FOR THED
EGREE OFD
OCTOR OFE
NGINEERINGDepartment of Mechanical Engineering
The University of Tokyo
CVD Growth of Single-Walled Carbon Nanotubes
and their Anisotropic Optical Properties
by Yoichi Murakami
Approved, Thesis Committee:
__________________________________________ Shigeo Maruyama, Thesis advisor and Chairman Professor of Mechanical Engineering,
The University of Tokyo
__________________________________________ Yoichiro Matsumoto
Professor of Mechanical Engineering, The University of Tokyo
__________________________________________ Yuichi Ikuhara
Professor of Materials Engineering, The University of Tokyo
__________________________________________ Atsumu Tezaki
Associate Professor of Mechanical Engineering, The University of Tokyo
__________________________________________ Tatsuya Okubo
Associate Professor of Chemical System Engineering, The University of Tokyo
__________________________________________ Shinji Yamashita
Associate Professor of Electronics Engineering, The University of Tokyo
Chapter 1:
Introduction
11.1 Introduction and overview of the thesis 2
1.2 Structural representation of SWNTs 5
References for Chapter 1
Chapter 2:
CVD growth of SWNTs and their analyses
152.1 Characteristics of SWNT growth from zeolite-supported catalysts 16
2.1.1 Research background
2.1.2 Catalyst preparation and experimental procedure 2.1.3 Definition of SWNT yield
2.1.4 Effect of CVD time and reduction of catalyst on SWNT yield 2.1.5 Microscopic analyses of obtained SWNTs on zeolite support 2.1.6 Effect of catalyst metal selection on growth of SWNTs
2.1.7 Summary
2.2 Catalyzed growth of SWNTs from mesoporous silica thin films 30 2.2.1 Research background and motivation
2.2.2 Preparations and experiments 2.2.3 Results and discussions
2.2.4 Summary of SWNT growth from MPS thin films
2.3 Development of techniques for direct synthesis of SWNTs on solid 38
flat substrates
2.3.1 Research background and motivation
2.3.2 Development of dip-coat catalyst supporting method 2.3.3 Direct synthesis of SWNTs on Si and quartz substrates
2.3.3.1 Experimental procedure 2.3.3.2 Resonant Raman scattering analysis 2.3.3.3 Microscopic analysis 2.3.3.4 Discussions
2.4 Morphology and chemical state analysis of Co-Mo catalysts 60
supported on substrates by TEM and XPS analyses
2.4.1 Questions to be resolved for dip-coat supported Co-Mo catalysts 2.4.2 Methods for catalyst characterization
2.4.2.1 TEM observation and its sample preparation 2.4.2.2 Procedure for XPS measurement
2.4.3 Results of TEM and XPS analyses
2.4.3.1 Morphology of calcined and reduced Co-Mo catalyst
2.4.3.2 Chemical state of calcined and reduced Co-Mo catalysts analyzed
by XPS
2.4.3.3 Mechanism and formation process of Co-Mo catalyst
2.4.4 Summary of formation process and role of Co-Mo catalyst
2.5 Summary of Chapter 2 70
Acknowledgements for Chapter 2 References for Chapter 2
Chapter 3: Growth of vertically aligned SWNT films on substrates
79and their formation process
3.1 Research background and motivation 80
3.2 Experimental and analysis procedures 81
3.3 Effect of CVD chamber vacuum on SWNT growth 82
3.4 Microscopic and optical analyses 84
3.4.1 Morphological investigations by FE-SEM and HR-TEM 3.4.2 Resonant Raman scattering analysis
3.5 Discussion of vertical alignment formation in SWNTs 90
3.6 Transient investigations and modeling of growth process of vertically 92
aligned SWNT films
3.6.1 Growth and formation process of vertically aligned SWNT film 3.6.2 In situ measurement of growth process of vertically aligned
SWNT film
3.6.3 Formulation for growth process of vertically aligned SWNT film
3.7 Summary of Chapter 3 107
Acknowledgements for Chapter 3 References for Chapter 3
4.1 Determination of optical anisotropy of the vertically aligned 112
SWNT film and optical absorption cross-section of SWNTs
4.1.1 Research background for polarized optical properties of SWNTs 4.1.2 Experimental and optical measurement setup
4.1.3 Dependence of optical absorption spectrum on SWNT morphology 4.1.4 Polarized optical absorption of vertically aligned SWNT film 4.1.5 Anisotropic optical properties of graphite
4.1.6 Modeling and formulation of multi-dipole optical absorption
of SWNTs
4.1.6.1 Transition probability
4.1.6.2 Optical absorption by dipole transition moment
4.1.6.3 Formulation for multiple dipole absorption by vertically
aligned SWNTs
4.1.7 Determination of optical anisotropy and bare optical absorption cross-section of SWNTs
4.1.8 Summary of anisotropy optical properties of SWNTs
4.2 Polarization dependence of Raman scattering characteristics from 131
vertically aligned SWNT film
4.2.1 Introduction - Role of Raman scattering in SWNT analysis 4.2.2 Raman scattering measurement
4.2.3 Experimental results and analyses
4.2.3.1 Raman spectrum dependence on laser polarization 4.2.3.2 RBM peak behavior by molecular adsorption 4.2.3.3 RBM peak dependence on laser intensity
4.2.4 Discussion and interpretation of obtained data
4.2.4.1 Interpretation of data based on ∆µ = ±1 transition by
cross-polarized light
4.2.4.2 Another possibility of interpreting the data
4.2.5 Summary of polarization dependence of Raman scattering
4.3 Optical applications of SWNT film directly synthesized 154
on solid surfaces
4.3.2 Experimental setup
4.3.3 Principles of mode-locked ring fiber laser 4.3.4 Results and summary
4.4 Summary of Chapter 4 160
Acknowledgements for Chapter 4 References for Chapter 4
Chapter 5: Summary
167Appendix: Perturbated Hamiltonian for one-photon process
Acknowledgements List of publications
Chapter 1:
Introduction
1.1 Introduction and overview of the thesis
Single-walled carbon nanotubes (SWNTs) are a new group of carbon materials possessing one-dimensional cylindrical geometry that is formed by rolling a sp2-bonded graphene sheet. Immediately after its landmark discovery and structure determination in 1993 by Iijima and Ichihashi [1], theoretical studies on SWNTs commenced; these revealed several distinctive physical properties of SWNTs, such as their unique electronic density of states (eDOS) and metal-semiconducting distinction that is solely dependent on their chirality [2].
Experimental studies on SWNTs became possible after the establishment of production methods in the late 1990s, such as laser-furnace (1996) [3], arc-discharge (1997) [4], and catalytic CVD methods with supported catalysts (1996) [5] and floated catalysts (1998) [6,7]. These methods are intended for use in the mass synthesis of SWNTs in which the SWNTs are obtained as soot adhered on the wall of the production chambers. Since the as-obtained soot contains amorphous carbons, multi-shelled graphites, fullerenes, and/or catalyst metal particles as impurities, a purification process [8–11] is generally required prior to its use. Although the SWNTs produced by these methods usually necessitates such a purification process, these production methods are firmly established at present. In particular, the HiPco method (1999) [12] that utilizes the disproportionation reaction of CO gas is now regarded as a commercially feasible method for the mass production of SWNTs. At the same time, the CVD method with a supported catalyst is currently being intensively studied as a promising technique. The alcohol CCVD method (2002) [13], which is used in this thesis, is one of such technique and can produce high-quality SWNTs that are almost free from the aforementioned impurities even in the as-synthesized state.
With the establishment of production methods of SWNTs, experimental studies for specific applications have become active and many innovative applications have been studied and proposed [14], such as one-dimensional (1D) quantum wire [15], field effect transistor (FET) [16–19], cold cathodes for electron emitters [20,21], chemical sensors [22,23], probe tips for atomic force microscopes (AFM) [24–26], saturable optical absorbers for ultrafast all-optic switches [27–29], and nano-sized infrared detectors/emitters [30,31]. In any application, the 1D geometry, nanoscale size, and the physical/chemical properties of SWNTs are of great importance.
However, in order to completely achieve such innovative applications, the following problems should be resolved:
1) Direct growth of SWNTs on Si or other flat substrates.
2) Elucidation of the function of the catalyst that is optimal for the growth of SWNTs and construction of guidelines for the selection of a catalyst.
3) Morphologically aligned growth of SWNTs on Si or other flat substrates.
4) Elucidation of anisotropic optical properties of SWNTs toward light polarization. 5) Separation of bulk-synthesized SWNTs based on metallic/semiconducting
distinction, or ideally, their chirality.
6) Selective growth of SWNTs as either metallic or semiconducting SWNTs, or ideally, chirality-specific growth.
A brief overview of these topics follows. Regarding problem 1, a SWNT-based FET has often been fabricated from bulk-produced SWNTs dispersed and spun coated on Si/SiO2
substrates [15–19]. However, the yield of electrical devices fabricated by this method is considerably low because favorably isolated SWNTs on Si have to be found by atomic force microscopy (AFM) prior to the device fabrication. Kong et al. [32] demonstrated for the first time that SWNTs could be grown on Si substrates by CVD. However, the SWNTs in that study were indirectly grown on the surface of the Si substrate, that is, the SWNTs were grown from Fe-Mo catalyst mixed with patterned alumina islands [32]. These supporting islands (3 × 3 µm2) are not essential for the functioning of the device; therefore,
it is desireble to eliminate them in order to enable high-density fabrication of the devices. A method of growing SWNTs directly on the surface of the Si/SiO2 substrate is developed in
Section 2.3, in which the catalyst metal is directly supported on the Si/SiO2 surface without
using an intermediate supporting layer.
Regarding problem 2, several types of catalysts, either monometallic or bimetallic, have been proposed for the growth of SWNTs. Empirically, it is known that a bimetallic catalyst such as Fe-Mo [32–36], Fe-Co [13,37], or Co-Mo [38–40] is more effective than a monometallic catalyst in enhancing the growth of SWNTs. Section 2.1 discusses the effect of the Fe-Co catalyst in terms of a thermo-gravimetric analysis (TGA) and thermodynamic properties of catalytic metals. In section 2.4, the role of the Co-Mo catalyst on Si/SiO2
surface is elucidated, and a new model for catalyst dispersion is proposed, which is different from the previously proposed model for the Co-Mo system [39,40].
Regarding problem 3, significant effort was devoted to the morphologically controlled growth of SWNTs on solid surfaces. The vertical growth of multi-walled carbon nanotubes
(MWNTs) on a flat substrate has been successfully achieved [41–43]; however, when SWNTs are concerned, they have only been aligned parallel to the substrate surface [44-46]. Since it is well known that the transport properties of SWNTs are superior to those of MWNTs [14], the achievement of vertically aligned growth of SWNTs on flat substrates would accelerate their application as a cold cathode for electron emission electrodes. In Chapter 3, a new method, which is easy and reproducible, is developed for the vertical growth of SWNTs uniformly over the quartz substrate, and the growth process and mechanism are investigated in detail.
Regarding problem 4, SWNTs are also considered as a promising material for optical devices [27–29]. Since a SWNT has a 1D shape, its optical properties are expected to exhibit anisotropy toward light polarization with respect to the axis of SWNTs. However, it should be noted that the fundamental anisotropic optical properties of SWNTs have not yet been elucidated to a great extent. This is partly because it is difficult to prepare a well-aligned SWNT film that exhibits sufficient light absorption. Using the vertically aligned SWNT film developed in Chapter 3, the anisotropic optical absorption properties and Raman scattering characteristics are elucidated in Chapter 4.
Problem 5 is presently being resolved for metallic/semiconducting separation [47,48]. Regarding problem 6, the preferential growth of semiconducting SWNTs was recently reported [49] although chirality-specific growth, an important target for the future, has not yet been achieved.
The scope and originality of this thesis are related to the resolutions of problems 1–4. Although all of these have originally been investigated and resolved in this thesis, the most important originalities of this thesis lie in the resolutions of problems 3 and 4. In Chapter 2, a new method for the direct growth of SWNTs on Si and quartz substrates is presented, extensively analyzed, and discussed with respect to problems 1 and 2. In Chapter 3, high density, vertically aligned growth of SWNTs on the substrates—with respect to problem 3—is achieved, and a mechanism for vertical growth is investigated and modeled. In Chapter 4, using a vertically aligned SWNT film grown on quartz substrates, the polarization-dependent optical absorption property of SWNTs—with respect to problem 4—is elucidated. Finally, the contents of the thesis are summarized in Chapter 5.
A detailed introduction and background for each topic accompanies the beginning of the respective section or chapter.
1.2 Structural representation of SWNTs
The structure of the sp2 carbon network of a two-dimentional (2D) graphene sheet is schematically presented as a hexagonal lattice in Fig. 1-1a. The shadowed rhombus indicates a unit cell of the graphene, which contains two non-equivalent C atoms. The distance between neighboring atoms ac-c is 1.42 Å, and vectors a1 and a2 represent the unit
vectors of the cell. The Brillouin zone of the graphene is denoted in Fig. 1-1b as a shadowed hexagon, and vectors b1 and b2 are the reciprocal vectors. These are expressed as
= = 2 - , 2 3 , 2 , 2 3 2 1 a a a a a a (1) and = = a a a a π π π π 2 , 3 2 , 2 , 3 2 2 1 b b (2)
based on the x-y and kx-ky coordinates, respectively, as shown in Fig. 1-1. In these equations,
the lattice constant of the 2D graphene is defined as a ≡ |a1| = |a2| = 1.42 Å × 31/2 = 2.46 Å.
By convention, high symmetry points at the center, corner, and the midpoint of the neighboring corners of the Brillouin zone are denoted as Γ, M, and K points, respectively.
The unit cell of SWNTs is enlarged when compared to that of the graphene due to the lower symmetry of SWNTs. Figure 1-2 shows an unrolled hexagonal lattice of a SWNT, in which the unit cell of a certain type of SWNT is indicated as a shadowed area. The vectors Ch and T that connect two crystallographically equivalent sites in the circumferential and
axial directions of SWNTs, respectively, are also shown. These vectors are termed the chiral vector and the translational vector, respectively, as further explained below.
b
b 1 b2 ky kx Γ MK y x a1 a2a
ac-cb
b 1 b2 ky kx Γ MKb
b 1 b2 ky kx b1 b2 ky kx b1 b2 ky kx Γ MK Γ MK y x a1 a2a
ac-c y x a1 a2a
y x a1 a2a
ac-cFig. 1-1. (a) Unit cell and (b) Brillouin zone of 2D graphite represented as the shadowed rhombus and hexagon, respectively. ai and bi (i = 1, 2) are unit vectors and reciprocal lattice vectors, respectively.
The high-symmetric points in the 2D Brillouin zone conventionally called Γ, K, and M point, are also shown.
The chiral vector Ch is expressed in terms of real-space unit vectors a1 and a2 and two integers n and m (0 ≤ m ≤ n) as ) , ( 2 1 m n m n h = a + a ≡ C (3)
The type of SWNT is completely specified by the two integers (n, m) through the definition given in Eq. 3. Since the length of Ch indicates the circumferential length of the SWNT, the
diameter of the SWNT, dt, is expressed as
π π π nm m n a d h h h t + + = ⋅ = = C C C 2 2 (4)
Here, a ≡ |a1| = |a2| = 1.44 Å × 31/2 = 2.49 Å is the lattice constant of the honeycomb lattice
of the SWNT. A slightly greater C–C bond length in SWNTs compared to that in the graphene (1.42 Å) should be noted.
The angle formed by Ch and a1 is termed chiral vector θ, and its value is 0 ≤ θ ≤ 30° due
to the hexagonal symmetry of the honeycomb lattice; specifically, it is expressed as
nm m n m n h h + + + = ⋅ = 2 2 1 1 2 2 cos a C a C θ (5)
The translational vector T is defined as the unit vector of a 1D SWNT, which is parallel to the SWNT axis. From the relationship Ch⋅T = 0,
a2 θ
C
h a1T
x y Axial direction Circumferential direction (n, m) = (4, 2) a2 θC
h a1T
x y Axial direction Circumferential direction (n, m) = (4, 2)Fig. 1-2. Unrolled hexagonal lattice of a SWNT. The chiral vector Ch and translational vector T are
presented for the case of Ch = 4a1 + 2a2 SWNT. Its unit cell is denoted as shadowed area in which N = 28 hexagons are contained. The angle between a1 and Ch gives the chiral angle θ (0 ≤ θ ≤ 30°).
R R d m n t d n m t t t t t + ≡ = + =− + = 1a1 2a2 (1, 2), 1 2 , 2 2 T (6)
where dR is the greatest common divisor (gcd) of (2m + n) and (2n + m). Using the above
defined dR, the number of hexagons in the unit cell of a SWNT N is expressed as
(
)
R h d nm m n N = + + × × = 2 2 2 1 2 a a T C (7)Therefore, there are 2N carbon atoms in the unit cell of a SWNT. For example, (n, m) = (4, 2) SWNT shown in Fig. 1-2 has 28 hexagons in the unit cell.
Since the unit cell of a SWNT is 2D and specified by the orthogonal lattice vectors Ch
and T, as shown in Fig. 1-2, the reciprocal lattice vectors corresponding to the circumferential direction K1 and the axial direction K2 are defined such that the following
relationships are satisfied:
0 , 2 2 1 2 1 = ⋅ = ⋅ = ⋅ = ⋅K T K C K T K Ch π h (8)
Solving these relations using Eqs. 6 and 7, K1 and K2 are expressed as
(
2 1 1 2)
1 1 b b K t t N − + = (9)(
1 2)
2 1 b b K m n N − = (10)Figure 1-3 shows the reciprocal lattice vectors K1 and K2 for (n, m) = (4, 2) SWNT. The
first Brillouin zone of the SWNT is expressed as a line segment W-W’ as shown in Fig. 1-3a. Therefore, N line segments µK1 (µ = 1, ⋅⋅⋅, N – 1) give rise to N discrete wave vectors,
which originate from the quantized wave vector in the direction of Ch due to the periodic
boundary condition imposed in this direction.
The electronic structure of a SWNT can be obtained from that of 2D graphite. When the energy dispersion relation of 2D graphite is denoted as Eg, 2D, N pairs of 1D energy
dispersion relation Eµ(k) are expressed as
) and , 1 , , 0 ( , ) ( 1 2 2 2D , T T K K K µ µ π π µ = ⋅ ⋅⋅ − − < < + =E k N k k E g (11)
Here, k denotes the wave number along the SWNT axis. If these energy dispersion curves are collected (or folded) into the first Brillouin zone of the 2D graphite by translating them using multiples of K1 and K2, Fig. 1-3a is equivalently expressed as Fig. 1-3b in the reduced
are limited from the case of 2D graphite. The line indicating the possible wave vector shown in Fig. 1-3b will hereafter be referred to as “cutting line”.
Such a quantized wave vector of SWNTs causes a sharp divergence in their eDOS, termed “van Hove singularities,” that is characteristic of 1D materials. Figure 1-4 shows the eDOS of (n, m) = (4, 2) SWNT calculated by the tight-binding method with parameters γ0 =
2.9 eV, s = 0, and ac–c = 0.144 nm. Since it is obvious that the cutting line of this
SWNT—described by Eq. 11—does not pass the K-point, in which the valence and conduction bands meet in the case of 2D graphite, the (n, m) = (4, 2) SWNT is semiconducting in which eDOS is absent at the Fermi level. On the other hand, when the
Γ W W’ K2 K1 b1 b2 (n, m) = (4, 2)
a
K2 K1b
Γ W W’ K2 K1 b1 b2 (n, m) = (4, 2)a
Γ W W’ K2 K1 b1 b2 (n, m) = (4, 2)a
K2 K1b
K2 K1 K2 K1b
Fig. 1-3. (a) Brillouin zone of a SWNT represented by the line segment W-W’ for the case of (n, m) = (4, 2) SWNT, and (b) its equivalent representation displayed by the reduced-zone scheme. The vectors K1 and K2 are reciprocal lattice vectors correspond to Ch and T, respectively.
–4 –2 0 2 4 Energy (eV) (n, m) = (4, 2) http://www.photon.t.u-tokyo.ac.jp/~maruyama/kataura/1D_DOS.html –4 –2 0 2 4 Energy (eV) (n, m) = (4, 2) http://www.photon.t.u-tokyo.ac.jp/~maruyama/kataura/1D_DOS.html
Fig. 1-4. (a) 3D Brillouin zone of graphite and cutting lines for (n, m) = (4, 2) SWNT. (b) eDOS of (n, m) = (4, 2) SWNT calculated by tight-binding method with γ0 = 2.9 eV, s = 0, and ac-c = 0.144 Å.
cutting line passes the K-point in the case of e.g. (n, m) = (5, 2) SWNT, the SWNT is metallic in which eDOS is at the Fermi level. In general, mod(n – m) = 0 SWNTs are metallic and mod(n – m, 3) ≠ 0 SWNTs are semiconducting. One of the most important characteristics of SWNTs is that the difference of metallic/semiconducting transport properties is determined solely by the chirality.
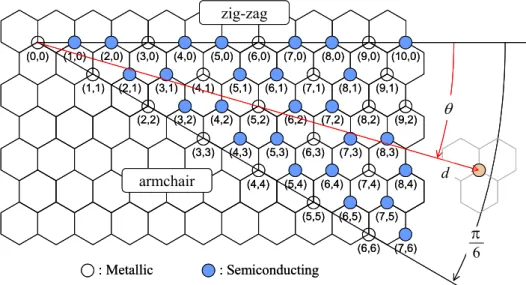
Figure 1-5 shows the chiral mapping of (n, m) SWNTs that are either metallic (open circles) or semiconducting (solid circles). Any chirality is specified either by two integers (n, m) or equivalently, a combination of diameter d and chiral angle θ, as schematized in this figure. Among these, the SWNTs with m = 0 (i.e., θ = 0°) and n = m (i.e., θ = 30°) chirality are termed “zig-zag” and “armchair” types, respectively. This is because the edges of their tubes look like a zigzag and an armchair, as shown in Fig. 1-6a and 1-6b, respectively. The SWNTs that do not belong to either of these types are the “chiral” type, as shown in Fig. 1-6c.
The fundamental characteristics, structure, and notational system presented in this section will be used in subsequent chapters, in which specific topics are studied in detail.
(0,0) (1,0) (2,0) (3,0) (4,0) (5,0) (6,0) (7,0) (8,0) (9,0) (10,0) (1,1) (2,1) (3,1) (4,1) (5,1) (6,1) (7,1) (8,1) (9,1) (2,2) (3,2) (4,2) (5,2) (6,2) (7,2) (8,2) (9,2) (3,3) (4,3) (5,3) (6,3) (7,3) (8,3) (4,4) (5,4) (6,4) (7,4) (8,4) (5,5) (6,5) (7,5) (6,6) (7,6) θ d : Semiconducting : Metallic zig-zag armchair 6 π (0,0) (1,0) (2,0) (3,0) (4,0) (5,0) (6,0) (7,0) (8,0) (9,0) (10,0) (1,1) (2,1) (3,1) (4,1) (5,1) (6,1) (7,1) (8,1) (9,1) (2,2) (3,2) (4,2) (5,2) (6,2) (7,2) (8,2) (9,2) (3,3) (4,3) (5,3) (6,3) (7,3) (8,3) (4,4) (5,4) (6,4) (7,4) (8,4) (5,5) (6,5) (7,5) (6,6) (7,6) θ d : Semiconducting : Metallic zig-zag armchair 6 π 6 π
Fig. 1-5. The (n, m) of SWNTs that are metallic (open circles) and semiconducting (solid circles), respectively, denoted on the map of chiral vectors (n, m). Any chirality is specified either by two integers (n, m) or, equivalently, a combination of diameter d and chiral angle θ.
Zig-zag type (n, m) = (10, 0) (θ= 0°, d = 0.794 nm) Armchair type (n, m) = (8, 8) (θ= 30°, d = 1.1 nm) Chiral type (n, m) = (10, 5) (θ= 19.1°, d = 1.05 nm)
a
b
c
a1 a1 a1 Zig-zag type (n, m) = (10, 0) (θ= 0°, d = 0.794 nm) Armchair type (n, m) = (8, 8) (θ= 30°, d = 1.1 nm) Chiral type (n, m) = (10, 5) (θ= 19.1°, d = 1.05 nm)a
b
c
a1 a1 a1Fig. 1-6. Structure of (a) zig-zag type, (b) armchair type, and (c) chiral type SWNTs represented by (n, m) =(10, 0), (8, 8), and (10, 5) tubes.
References for Chapter 1
1. S. Iijima, T. Ichihashi, Nature 363 (1993) 603.
2. R. Saito, G. Dresselhaus, M.S. Dresselhaus, Physical Properties of Carbon Nanotubes, Imperial College Press, London, 1998.
3. A. Thess, R. Lee, P. Nikolaev, H. Dai, P. Petit, J. Robert, C. Xu, Y.H. Lee, S.G. Kim, A.G. Rinzler, D.T. Colbert, G.E. Scuseria, D. Tománek, J.E. Fischer, R.E. Smalley, Science 273 (1996) 483.
4. C. Journet, W. K. Maser, P. Bernier, A. Loiseau, M. L. de la Chapelle, S. Lefrant, P. Deniard, R. Lee, J. E. Fisher, Nature 388 (1997) 756.
5. H. Dai, A. G. Rinzler, P. Nikolaev, A. Thess, D. T. Colbert, R. E. Smalley, Chem. Phys. Lett.
260 (1996) 471.
6. B.C. Satishkumar, A. Govindaraj, R. Sen, C.N.R. Rao, Chem. Phys. Lett. 293 (1998) 47. 7. H.M. Cheng, F. Li, G. Su, H.Y. Pan, L.L. He, X. Sun, M.S. Dresselhaus, Appl. Phys. Lett. 72
(1998) 3282.
8. K.B. Shelimov, R.O. Esenaliev, A.G. Rinzler, C.B. Huffman, R.E. Smalley, Chem. Phys. Lett.
282 (1998) 429.
9. A.G. Rinzler, J. Liu, H. Dai, P. Nikolaev, C.B. Huffman, F.J. Rodriguez-Macias, P.J. Boul, A.H. Lu, D. Heymann, D.T. Colbert, R.S. Lee, J.E. Fischer, A.M. Rao, P.C. Eklund, R.E. Smalley, Appl. Phys. A 67 (1998) 29.
10. P. Hou, C. Liu, Y. Tong, S. Xu, M. Liu, H. Cheng, J. Mater. Res. 16 (2001) 2526.
11. I.W. Chiang, B.E. Brinson, R.E. Smalley, J.L. Margrave, R.H. Hauge, J. Phys. Chem. B 105 (2001) 1157.
12. P. Nikolaev, M.J. Bronikowski, R.K. Bradley, F. Rohmund, D.T. Colbert, K.A. Smith, R.E. Smalley, Chem. Phys. Lett. 313 (1999) 91.
13. S. Maruyama, R. Kojima, Y. Miyauchi, S. Chiashi, M. Kohno, Chem. Phys. Lett. 360 (2002) 229.
14. Carbon Nanotubes: Synthesis, Structure, Properties and Applications, edited by M.S. Dresselhaus, G. Dresselhaus, and Ph. Avouris, Springer-Verlag, Berlin, 2001.
15. S.J. Tans, M.H. Devoret, H. Dai, A. Thess, R.E. Smalley, L.J. Geerligs, C. Dekker, Nature 386 (1997) 474.
16. R. Martel, T. Schmidt, H. R. Shea, T. Hertel, P. Avouris, Appl. Phys. Lett. 73 (1998) 2447. 17. S. J. Tans, A. R. M. Verschueren, C. Dekker, Nature 393 (1998) 49.
18. A. Bachtold, P. Hadley, T. Nakanishi, C. Dekker, Science 294 (2001) 1317. 19. P. Avouris, Chem. Phys. 281 (2002) 429.
20. W.B. Choi, D.S. Chung, J.H. Kang, H.Y. Kim, Y.W. Jin, I.T. Han, Y.H. Lee, J.E.Jung, N.S. Lee, G.S. Park, J.M. Kim, Appl. Phys. Lett. 75 (1999) 3129.
21. W. Zhu, C. Bower, O. Zhou, G. Kochanski, S. Jin, Appl. Phys. Lett. 75 (1999) 873. 22. T. Someya, J. Small, P. Kim, C. Nuckolls, J.T. Yardley, Nano Lett. 3 (2003) 877. 23. J. Li, Y. Lu, Q. Ye, M. Cinke, J. Han, M. Meyyappan, Nano Lett. 3 (2003) 929.
24. S.S. Wong, E. Joselevich, A.T. Woolley, C.-L. Cheung, C.M. Liber, Nature 394 (1998) 52. 25. J.H. Hafner, C.-L. Cheung, C.M. Lieber, Nature 398 (1999) 761.
26. J.H. Hafner, C.-L. Cheung, A.T. Woolley, C.M. Lieber, Progress in Biophys. Molecular Biology 77 (2001) 73.
27. Y.C. Chen, N.R. Raravikar, L.S. Schadler, P.M. Ajayan, Y.P. Zhao, T.M. Lu, G.C. Wang, X.C. Zhang, Appl. Phys. Lett. 81 (2002) 975.
28. Y. Sakakibara, S. Tatsuura, H. Kataura, M. Tokumoto, Y. Achiba, Jpn. J. Appl. Phys. 42 (2003) L494.
29. S. Yamashita, Y. Inoue, S. Maruyama, Y. Murakami, H. Yamaguchi, M. Jablonski, S.Y. Set, Opt Lett. 29 (2004) 1581.
30. J.A. Misewich, R. Martel, P. Avouris, J.C. Tsang, S. Heinze, J. Tersoff, Science 300 (2003) 783.
31. M. Freitag, Y. Martin, J.A. Misewich, R. Martel, P. Avouris, Nano Lett. 3 (2003) 1067. 32. J. Kong, H.T. Soh, A.M. Cassell, C.F. Quate, H. Dai, Nature 395 (1998) 878.
33. J.H. Hafner, M.J. Bronikowski, B.R. Azamian, P. Nikolaev, A.G. Rinzler, D.T. Colbert, K.A. Smith, R.E. Smalley, Chem. Phys. Lett. 296 (1998) 195.
35. M. Su, B. Zheng, J.A. Liu, Chem. Phys. Lett. 322 (2000) 321.
36. A.R. Harutyunyan, B.K. Pradhan, U.J. Kim, G.G. Chen, P.C. Eklund, Nano Lett. 2 (2002) 525. 37. K. Mukhopadhyay, A. Koshio, T. Sugai, N. Tanaka, H. Shinohara, Z. Konya, J. B. Nagy,
Chem. Phys. Lett. 303 (1999) 117.
38. B. Kitiyanan, W.E. Alvarez, J.H. Harwell, D.E. Resasco, Chem. Phys. Lett. 317 (2000) 497. 39. W.E. Alvarez, B. Kitiyanan, A. Borgna, D.E. Resasco, Carbon 39 (2001) 547.
40. J.E. Herrera, L. Balzano, A. Borgna, W.E. Alvarez, D.E. Resasco, J. Catalysis 204 (2001) 129. 41. Z.F. Ren, Z.P. Huang, J.W. Xu, J.H. Wang, P. Bush, M.P. Siegal, P.N. Provencio, Science 282
(1998) 1105.
42. S. Fan, M.G. Chapline, N.R. Franklin, T.W. Tombler, A.M. Cassell, H. Dai, Science 283 (1999) 512.
43. B.Q. Wei, R. Vajtai, Y. Jung, J. Ward, R. Zhang, G. Ramanath, P.M. Ajayan, Nature 416 (2002) 495.
44. Y. Zhang, A. Chang, J. Cao, Q. Wang, W. Kim, Y. Li, N. Morris, E. Yenilmez, J. Kong, H. Dai, Appl. Phys. Lett. 79 (2001) 3155.
45. E. Joselevich, C.M. Lieber, Nano Lett. 2 (2002) 1137.
46. J.E. Fischer, W. Zhou, J. Vavro, M.C. Llaguno, C. Guthy, R. Haggenmueller, M.J. Casavant, D.E. Walters, R.E. Smalley, J. Appl. Phys. 93 (2003) 2157.
47. R. Krupke, F. Hennrich, H.v. Lohneysen, M.M. Kappes, Science 301 (2003) 344.
48. D. Chattopadhyay, I. Galeska, F. Papadimitrakopoulos, J. Am. Chem. Soc. 125 (2003) 3370. 49. Y. Li, D. Mann, M. Rolandi, W. Kim, A. Urai, S. Hung, A. Javey, J. Cao, D. Wang, E.
Chapter 2:
2.1 Characteristics of SWNT growth from zeolite-supported catalysts
2.1.1 Research background
To date, the unique physical properties of SWNTs have suggested several novel applications [1] that would not be possible to achieve with conventional materials; further, there is much scope to realize such inventions using SWNTs. Therefore, a low-cost synthesis technique of high-quality SWNTs is currently a pressing necessity.
In addition to the initial laser-furnace [2] and arc-discharge [3] techniques, a variety of studies have been reported [4–13] using the chemical vapor deposition (CVD) technique that is suitable for mass production. Several types of carbon sources, support materials, and synthesis conditions have so far been tested, but the best approach has not yet been attained. Toward this goal, our group reported [14] that SWNTs with remarkable purity were synthesized at a temperature as low as 600°C using alcohol (ethanol and methanol). Further merits of using alcohol lie in its harmlessness, low cost, and easy-handling properties.
There have been no reports that support the validity of the SWNT yield using a simultaneous combination of Raman, TGA, and transmission electron microscopy (TEM), other than a report by Alvarez et al. [11], in which MWNTs coexisted as a byproduct. Furthermore, in a majority of the reports, the characteristics of the reported highest yield were not presented. It is the author’s belief that a comprehensive discussion should be made regarding the definition of SWNTs yield, with an clear notation of the upper yield limit for practical quality. In this section, the effects of CVD reaction time and pre-reduction of catalytic metal on the quality and yield of synthesized SWNTs are investigated in order to discuss the feasibility of using our alcohol CCVD method for mass production.
2.1.2 Catalyst preparation and experimental procedure
The catalyst powder mentioned in this section is prepared as follows: Cobalt acetate (CH3CO2)2Co-4H2O and iron acetate (CH3CO2)2Fe were dissolved in ethanol along with
Y-type zeolite powder (TOSOH Corp. HSZ-390HUA, over 99% SiO2) so that the weight
concentration of each metal species over the total catalyst powder (i.e., zeolite + metal) is 2.5 wt%. Their typical amounts are 108.4 mg (Co acetate), 81.1 mg (Fe acetate), 20 ml (ethanol), and 1 g (zeolite powder). The mixture was sonicated for 1 h in a beaker submerged in a bath-type sonicator; subsequently, it was placed in a furnace maintained at 80°C for 1 h for evaporation of the ethanol. Sonication and evaporation were alternatively repeated until the contents of the beaker dried uniformly. The resultant white-yellow
powder was ground into fine powder by a mortar and stored for future use in a furnace at a temperature of 80°C. This procedure was developed based on the procedure originally presented in Refs. 15 and 16.
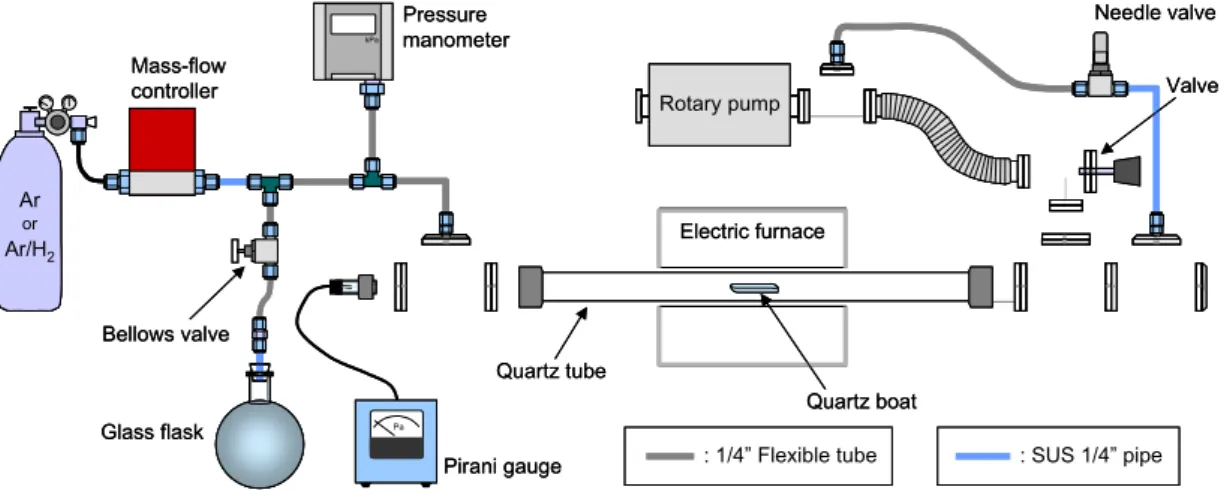
Figure 2-1 shows a schematic of the CVD apparatus used in Sections 2.1 and 2.2. For the CVD procedure, 30–50 mg of the catalytic powder was sparsely mounted on a quartz boat, and the boat was then is placed at the center of a quartz tube (26 mm inner diameter, 1 m length). As shown in Fig. 2-1, a 30-cm central portion of the quartz tube was heated in an electric furnace with an Ar flow of approximately 300 sccm, so that the pressure inside the tube could be maintained at 300 Torr by operating only the “needle valve.” After the reaction temperature was achieved typically within 30 min, the supply of Ar was stopped and the quartz tube was evacuated by opening the “valve,” as shown in Fig. 2-1. Subsequently, ethanol vapor was introduced keeping the pressure at just before entrance of the quartz tube constant as measured by the “pressure manometer.” Finally, the ethanol supply was stopped and the furnace was turned off before returning the system to room temperature with an Ar flow of 100 sccm. In some experiments, instead of pure Ar, Ar containing 3% of hydrogen (referred to as “Ar/H2”) was used for the reduction purpose.
As-prepared blackened powder was characterized by TGA, Raman spectroscopy, and TEM. TGA was performed using Seiko Instruments Inc. Exter 6000 and TG/DTA 6300 under a heating rate of 5 °C/min with an Ar flow of 100 sccm. In every TGA measurement, a sample weighing 10 ± 1 mg was used in order to reduce the TG error to below 1%, and the temperature was maintained at 100°C for 2 h prior to the start of the measurement in order to ensure reproducibility. Raman measurement was conducted using Chromex 501is
Rotary pump Pa Quartz tube kPa Pressure manometer Pirani gauge Electric furnace Quartz boat Needle valve Valve Glass flask Mass-flow controller Bellows valve Ar Ar/H2 or : SUS 1/4” pipe : 1/4” Flexible tube Rotary pump Rotary pump Rotary pump Pa Pa Quartz tube kPa kPa Pressure manometer Pirani gauge Electric furnace Quartz boat Needle valve Valve Glass flask Mass-flow controller Bellows valve Ar Ar/H2 or : SUS 1/4” pipe : SUS 1/4” pipe : 1/4” Flexible tube : 1/4” Flexible tube Fig. 2-1. Schematic description of CVD apparatus used in Section 2.1 and 2.2.
and Andor Technology DV401-FI as the spectrometer and CCD system, respectively, along with an optical system, Seki Technotron Corp. STR250. A laser wavelength of 488 nm was used in all the measurements.
2.1.3 Definition of SWNT yield
Recent findings by TG or temperature-programmed oxidation (TPO) analyses [9,11,17–21] are utilized to estimate the SWNT yield. The burning temperature of SWNTs is greatly influenced by the condition of the SWNTs specimen; therefore, caution must be exercised in comparing these results. It is remarkable that when catalytic metal particles are mixed with SWNTs, the decomposition temperature is somewhat lower than that of purified SWNTs [17–20]. At least, the burning temperatures of purified and annealed SWNTs produced by the laser furnace method [2,18] or the HiPco method [7,19,20] are in the same temperature range of 500–700°C.
Since amorphous carbon decomposes at approximately 300–500°C [9,11,17], which is lower than the decomposition temperature of SWNTs, its existence is readily recognized from the TG or TPO curves. However, when graphitized carbon products such as MWNTs coexist with SWNTs, it becomes considerably difficult to specify the amount of SWNTs using only the TGA or TPO curves. As pointed out by Alvarez et al. [11], this is because a certain type of well-graphitized product burns at slightly higher temperature range that overlaps the range of SWNTs. As a method for estimating the amount of each constituent, Alvarez et al. [11] decomposed their TPO curves into several Gaussian-Lorentzian components and attempted to estimate the amount of each carbon species, including amorphous carbons and MWNTs. However, this method has large scope for freedom in the choice of fitting parameters; hence, although physically effective, it may not be the most effective method for accurate yield estimation.
Therefore, the most appropriate method is to perform the estimation on a specimen that contains negligible amounts of amorphous carbon and MWNTs, for which Gaussian-Lorentzian decomposition is not required. The absence of amorphous carbon and MWNTs can be confirmed by TGA and TEM, respectively. The yield of SWNTs in this study is defined as the ratio of the weight loss between 500 and 700°C to the weight that remained at 1000°C; both are measured by TGA. In other words, the yield is a representative ratio of the weight of SWNTs to that of the catalytic powder.
2.1.4 Effect of CVD time and reduction of catalyst on SWNT yield
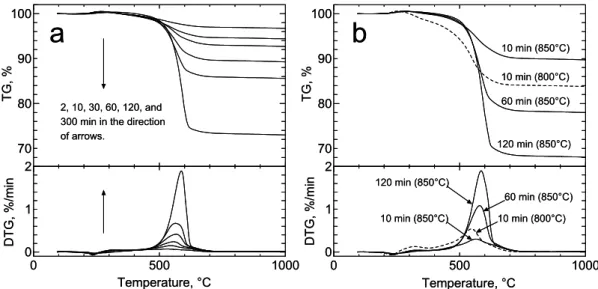
Figure 2-2a shows the TG and DTG curves of the as-prepared powders for several CVD reaction times when Ar was used during the heating of the electric furnace. The reaction temperature and pressure were 800°C and 10 Torr, respectively. For these conditions, this temperature was confirmed to be optimal (i.e., achieving minimum impurities) by Raman and TEM analyses. In our previous report [14], SWNTs with sufficiently high quality/purity were synthesized even at 650°C; however, this was possible because the pressure was much lower (2–5 Torr) than that in the present study in which the conditions for the highest yield are discussed. A slight weight gain at approximately 250°C is due to the oxidation of catalytic metals [19,20], and the following weight loss up to 500°C is due to the burning of amorphous carbons. The weight loss between 500 and 700°C was attributed to the burning of SWNTs, which strongly depends on the CVD reaction time. It should be noted that the burning temperature of the current SWNTs is equal to that of purified and annealed SWNTs that are synthesized by the laser-furnace [18] and HiPco [19,20] methods, indicating that the sidewalls of the SWNTs in this study are of good quality and are devoid of metal particles. The gradual shift of the DTG peaks toward a higher temperature is attributed to the increase in the diameter of SWNTs or thickening of the bundles. In the 300-min case, this shift is partially due to the formation of MWNTs. TEM observations displayed no multi-layered carbons such as MWNTs in the 120-min case, while a small amount of MWNTs was observed in the 300-min case (data not shown).
70 80 90 100 0 500 1000 0 1 2 TG, % DTG, %/min Temperature, °C 10 min (850°C) 10 min (800°C) 60 min (850°C) 120 min (850°C) 10 min (850°C) 120 min (850°C) 10 min (800°C) 60 min (850°C) 70 80 90 100 0 500 1000 0 1 2 TG, % DTG, %/min Temperature, °C 2, 10, 30, 60, 120, and 300 min in the direction of arrows.
a
b
70 80 90 100 0 500 1000 0 1 2 TG, % DTG, %/min Temperature, °C 10 min (850°C) 10 min (800°C) 60 min (850°C) 120 min (850°C) 10 min (850°C) 120 min (850°C) 10 min (800°C) 60 min (850°C) 70 80 90 100 0 500 1000 0 1 2 TG, % DTG, %/min Temperature, °C 2, 10, 30, 60, 120, and 300 min in the direction of arrows.a
b
Fig. 2-2. TG/DTG curves when (a) Ar and (b) Ar/H2 were used during the heat-up of the electric furnace. The ethanol pressure during CVD reaction was 10 Torr in all cases. The reaction temperature in panel (a) was 800°C for all cases.
A series of experiments were carried out using Ar/H2, and their TG and DTG results are
presented in Fig. 2-2b. The ethanol pressure during the reaction was 10 Torr. For a comparison with the curves in Fig. 2-2a, the first experiment was conducted under the conditions of 800°C and 10 min. The TG curve in the case of Ar/H2 (dashed line) exhibits a
greater total carbon yield than in the case of Ar (Fig. 2-2a). This increase is thought to arise from the additional reduction of catalytic metals that would otherwise be reduced by carbon atoms at a lower speed. A side effect, i.e., a simultaneous increase of amorphous carbon, can be suppressed by employing a higher reaction temperature. The solid lines in Fig. 2-2b represent the TG/DTG curves of SWNTs synthesized at 850°C, showing that the amount of amorphous carbon was suppressed to the same extent as that in Fig. 2-2a. It is noted that this comparison implies not only that Ar/H2 enhances the yield of SWNTs but also that Ar
lowers the reaction temperature, which can be an important controllable parameter in the production of SWNTs.
Figure 2-3 shows the Raman spectra corresponding to Fig. 2-2b. Detailed interpretations of the Raman spectra are presented in elsewhere [22]. The decrease in the D-band magnitude from “10 min at 800°C” to “10 min at 850°C” coincides with the observation in Fig. 2-2b. Although the magnitudes of the D band gradually increased with the reaction time, they retained sufficiently good quality, according to the TEM observations. Since the TGA results indicate a negligible amount of amorphous carbon compared with SWNTs
100 200 300 2 1 0.9 0.8 Intensi ty(arb.uni ts) Raman Shift (cm–1) Diameter (nm) 10 min (800°C) 10 min (850°C) 60 min (850°C) 120 min (850°C) 0 500 1000 1500 Raman Shift (cm–1) 10 min (800°C) 10 min (850°C) 60 min (850°C) 120 min (850°C) 100 200 300 2 1 0.9 0.8 Intensi ty(arb.uni ts) Raman Shift (cm–1) Diameter (nm) 10 min (800°C) 10 min (850°C) 60 min (850°C) 120 min (850°C) 0 500 1000 1500 Raman Shift (cm–1) 10 min (800°C) 10 min (850°C) 60 min (850°C) 120 min (850°C)
Fig. 2-3. Raman spectra corresponding to Fig. 2-2b taken with 488 nm laser light. The left panel is a magnification of the low-frequency area of the right. The gas used in the heating-up of the electric furnace and the ethanol pressure during CVD reaction were Ar/H2 and 10 Torr, respectively.
even for longer-CVD-time cases, the D band increase in this case may partly be ascribed to the double resonance effect by SWNTs with defects. The left panel displays the radial breathing mode (RBM) of SWNTs, from which the diameter distribution of SWNTs can be estimated using the relationship “d (nm) = 248/ν (cm-1)” [23,24], where d is the diameter of a SWNT and ν is the Raman shift. The observed increases in the diameter with CVD reaction time are partly because larger catalytic particles, which would produce SWNTs with larger diameter, require a longer time until they are activated and saturated with C atoms. As the reaction time increases, SWNTs begin to grow from larger catalyst particles, and at 300 min (shown in Fig. 2-2a), catalytic particles that are large enough to produce MWNTs are finally activated. Since it is more difficult to properly anneal SWNTs grown from larger catalyst particles at the moment of separation from the catalyst [5], these SWNTs are considered to possess a greater amount of defects. The above reasons serve to explain the increase in the D-band magnitude with CVD time that is observed in Fig. 2-3.
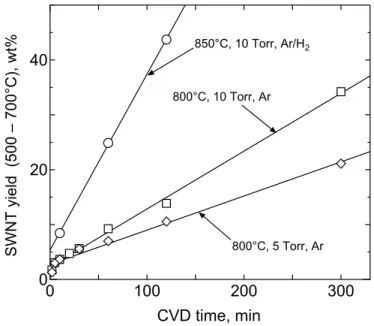
Figure 2-4 shows the time sequence plots of the SWNT yields. The error arising from TG was ± 0.5%. The definition of the SWNT yield is not strictly applicable for the 300-min case in which MWNTs were observed. This figure also displays the enhanced yield in the case of “850°C, 10 Torr, Ar/H2” compared with that of “800°C, 10 Torr, Ar”.
0 100 200 300 0 20 40 CVD time, min SW NT yield (500 – 700°C), wt% 850°C, 10 Torr, Ar/H2 800°C, 10 Torr, Ar 800°C, 5 Torr, Ar
Fig. 2-4. Time progresses of SWNT yields for the conditions of ‘850°C, 10 Torr, Ar/H2’ (circle), ‘800°C, 10 Torr, Ar’ (square), and ‘800°C, 5 Torr, Ar’ (diamond), for the temperature, pressure, and gas used in the heating-up of the electric furnace, respectively. A straight line for each condition denotes a least-squares fit. Note that a small amount of multi-layered carbon products were observed in cases of 300 minutes.
2.1.5 Microscopic analyses of obtained SWNTs on zeolite support
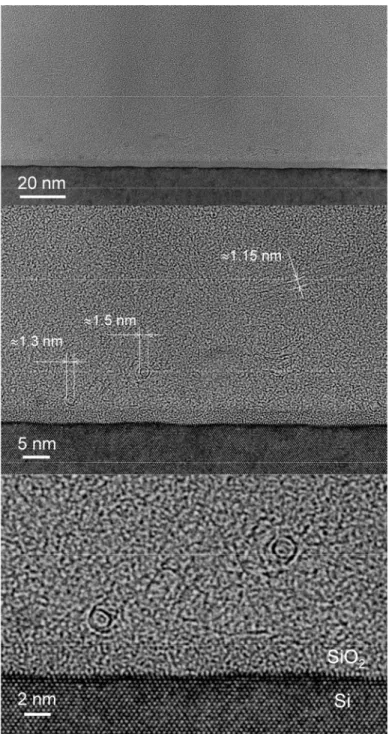
The quality of the above-described SWNTs was investigated by TEM. The as-grown sample was sonicated in methanol for 5 min and the solution was dropped onto a TEM grid. Figure 2-5 presents a few representative TEM images. In the context of the simultaneous achievement of yield and quality, “850°C, 10 Torr, 60 min, Ar/H2” (Fig. 2-5a) was the best
among the tested cases. The quality of the “850°C, 10 Torr, 120 min, Ar/H2” case was
almost the same (Fig. 2-5b) but these SWNTs had thicker bundles, and that of the “10 Torr, 60 min, Ar” case followed them. In this study, therefore, the practical limit of the reaction time in order to assure sufficient quality/purity of the product is 120 min, in which a SWNT yield 40% relative to the weight of the zeolite support powder with Fe-Co catalyst was achieved. This corresponds to a yield of more than 800% over the weight of the catalytic metal since the total metallic weight in the catalytic powder was 5%. The “as-grown” high quality of our SWNTs is evident when the TEM images (Fig. 2-5) are compared with those presented in previous reports, for example [7–11,13,19]. The choice of ethanol for the carbon feedstock appears to be a crucial factor.
Figure 2-6 shows FE-SEM micrographs for the as-grown stage of the “850°C, 10 Torr, 60 min, Ar/H2” SWNTs obtained at different magnifications. The low-magnification image
reveals that zeolite powder particles of several hundreds of nanometers were bound to each other by web-like SWNT bundles. The surface of the zeolite powder was densely covered with SWNT bundles whose typical thickness is 10–20 nm. Thinner bundles of ~10 nm were observed at the highest magnification particularly near the surface of the zeolite particle, and the thickness of the bundles appears to increase toward the zeolite surface. At the outermost surface, where the bending stiffness of the thickened bundles exceeded the van der Waals attraction force from the surface of zeolite, the bundles finally depart into space. It should be noted that the surfaces of the SWNT bundles are smooth and no contamination is observed on them; this also verifies the high quality of the pure SWNTs grown by the proposed method.
Fig. 2-5. TEM images for ‘as-grown’ SWNTs synthesized at the conditions of (a) ‘850°C, 10 Torr, 60 min, Ar/H2’, and (b) ‘850°C, 10 Torr, 120 min, Ar/H2’, for the temperature, pressure, time, and gas used during the heat-up of the electric furnace, respectively. Note the high purity of SWNTs without contaminants such as metallic particles, amorphous carbons, or MWNTs.
Fig. 2-6. FE-SEM micrographs for the ‘850°C, 10 Torr, 60 min, Ar/H2’ SWNTs in ‘as-grown’ state on zeolite support powder, taken at several different magnifications. The same sample has been investigated and presented in Figs. 2-2 - 2-5.
2.1.6 Effect of catalyst metal selection on growth of SWNTs
Previous experiments have used a catalyst prepared by an impregnation of Fe and Co acetates into Y-type zeolite powder, as described in Section 2.1.2. The use of Fe-Co catalyst leads to a high yield of the SWNTs, as seen in Fig. 2-4. This subsection investigates the effect of different catalyst metals on the growth of SWNTs on SiO2
supports. Mo, Fe, Co, and Ni, in particular, are examined because they are often used and are thought to be suitable as catalysts for SWNT growth. They are d-orbital transition metals known to have strong catalyst activity in general [25].
Figure 2-7 shows the Raman spectra, measured with 488-nm laser light, of SWNTs grown using different catalyst metals supported by the impregnation of their metallic acetates into Y-type zeolite powder. In all the cases, the weight% of metal over the support was set as 5 wt%. The CVD experiments were performed under the same conditions: 800°C, 5 Torr, and 10 min for reaction temperature, ethanol pressure, and reaction time, respectively, with the use of Ar while heating up the electric furnace. The output powders appeared to be colored almost white (Mo), gray (Fe, Ni), and black (Co), and they are investigated later in greater quantitative detail. With the exception of Mo (Fig. 2-7a), the Raman spectra obtained with a high G/D ratio at ~1593 cm-1 and a clear indication of RBM
100 200 300 400 2 1 0.9 0.8 0.7 Intensity (arb.units) Raman Shift (cm–1) Diameter (nm) (a) Mo 5 wt% (b) Fe 5 wt% (c) Co 5 wt% (d) Ni 5 wt% CVD: 800°C, 5 Torr, 10 min Raman: 488 nm, x10 1000 1200 1400 1600 Raman Shift (cm–1) (a) Mo 5 wt% (b) Fe 5 wt% (c) Co 5 wt% (d) Ni 5 wt% 100 200 300 400 2 1 0.9 0.8 0.7 Intensity (arb.units) Raman Shift (cm–1) Diameter (nm) (a) Mo 5 wt% (b) Fe 5 wt% (c) Co 5 wt% (d) Ni 5 wt% CVD: 800°C, 5 Torr, 10 min Raman: 488 nm, x10 1000 1200 1400 1600 Raman Shift (cm–1) (a) Mo 5 wt% (b) Fe 5 wt% (c) Co 5 wt% (d) Ni 5 wt%
Fig. 2-7. Raman scattering spectra measured with 488 nm laser light from SWNTs grown from (a) Mo, (b) Fe, (c) Co, or (d) Ni catalyst supported on USY-zeolite powder through impregnation of their acetates as described in Section 2.1.2. The metallic concentration over the support powder is 5 wt% for all cases..
in lower frequency region are identified as those of SWNTs. It is evident that the diameter of the produced SWNT increases in the order of Fe < Co < Ni, indicating that the diameter of the metal particles formed on the SiO2 support also varied in the same order.
This experimental observation can be explained in terms of the thermodynamic properties of metals, according to the methodology originally proposed by Hu et al. [26] used for explaining the morphologies of sputtered metals on TiO2 substrates. Table 2-1 lists
several thermodynamic properties of the metals employed in Fig. 2-7. ∆Hf°oxide and
∆Hf°sublimation denote the heat of formation of metal oxide per mole of the metal and the heat
of sublimation of the metal, respectively, both at standard state, cited from Ref. 27. The former assumes the oxidized state shown in the table and the latter is the so-called cohesive energy that well correlates with the melting point of the metal. An alternative property of
∆Hf°sublimation, experimentally measured surface energy γ cited from Ref. 28, is also shown
in Table 2-1.
These thermodynamic properties are reflected in the behavior of the metals supported on the oxidized surface provided there are no significant changes in the chemical states at the elevated temperature (~800°C) at which CVD is performed. Since ∆Hf°sublimation (or γ)
represents the affinity of metals with themselves and ∆Hf°oxide represents that of metals with
oxygen, these ratios should provide a measure of the degree of wetting of the metal on the SiO2 support. The last two rows of Table 2-1 show these ratios, and the agreement of their
tendency with the experimental observation in Fig. 2-7 is excellent. Other studies have also reported these tendencies in the catalyst for SWNT growth. For example, the SEM
Table 2-1. Thermodynamic properties of Fe, Co, Ni, and Mo.
Element Mo Fe Co Ni
Atomic number [-] 42 26 27 28
Melting point [K] 2895 1811 1770 1728
Oxidized state MoO3 Fe2O3 Co3O4 Ni2O3
∆Hf°oxide [kJ/mol]
(oxide per mol of metal) -745.58 -412.40 -297.26 -244.92
∆Hf°sublimation [kJ/mol]
(cohesive energy of metal) 658.58 416.59 424.96 427.95
γ × 103 [kJ/m2]
(surface energy of metal) 3.00 2.48 2.55 2.45 -∆Hf°sublimation / ∆Hf°oxide [-] 0.883 1.01 1.43 1.75
-γ/ ∆Hf°oxide× 106 [mol/m2] 4.02 6.00 8.58 10.0
micrograph of the Si substrate after C2H2 molecular beam epitaxy (MBE) growth of carbon
nanotubes at 750°C from vacuum-deposited Ni catalyst layer (thickness 5 nm) reveals significant agglomeration of Ni metal, as large as ~50 nm in diameter [29]. Even at a reduced amount (~1 nm) of deposited Ni, the catalyst agglomerates into ~10 nm particles, resulting in the growth of only MWNTs. Since Ni has often been used for growing vertically aligned MWNTs on a flat substrate [30,31], such an empirical choice of catalyst could be quantitatively explained using the method shown in Table 2-1.
Figure 2-8 shows the TGA curves of SWNT-grown zeolite powders that were examined in Fig. 2-7 along with that of our standard Fe-Co (2.5 wt% each) catalyst used in Figs. 2-2 to 2-6. Once again, all the CVD experiments were performed at 800°C, 5 Torr, and 10 min. For monometallic catalyst, it is recognized that Co yields the largest amount of SWNTs, while Ni and Fe yield a lower amount. TGA was not performed on the sample with Mo catalyst examined in Fig. 2-7 because virtually no production of SWNT was confirmed by the result of Raman scattering analysis. This result indicates the existence of an optimum point in the choice of catalyst. Based on the current discussion, it is reasoned that Fe and Ni produce a lower amount of SWNTs because they exhibit excess wetting and agglomerating
0 500 1000 95 100 0 500 1000 –0.1 0 0.1 0.2 TG, % DTG, %/min : Fe/Co 2.5 wt% each : Co 5 wt% : Ni 5 wt% CVD: 800°C, 5 Torr, 10 min Temperature (°C) SWNT : Fe 5 wt%
Fig. 2-8. TG and DTG curves measured from as-prepared SWNTs grown from Fe, Co, Ni, and Fe/Co catalyst supported on Y-type zeolite powder. The metallic concentration over the support powder is 5 wt% for all cases. The elevating speed of temperature and flow rate of air during TG measurements were 5 °C/min and 100 sccm, respectively.
on the SiO2 support, respectively. On the other hand, Co exhibits the best performance
among these because the wettability is moderate; hence, particle formation is appropriate for the efficient growth of SWNTs.
As shown in Fig. 2-8 with a solid curve, the yield of SWNTs can be further enhanced by the use of a bimetallic Fe-Co catalyst. Several studies have demonstrated the effectiveness of the use of bimetallic catalysts; this will be investigated and discussed in depth in Section 2.3 and 2.4. The effect of bimetals on the surface of the SiO2 support is considered to be as
follows: The metal with higher wettability to SiO2 (such as Fe or Mo) comes closer to the
SiO2 surface and stabilizes the other metal species (such as Co or Ni) that works as the
main catalyst for the SWNT growth. Thus, the main catalyst (i.e., Co or Ni) is dispersed and even protected from deactivation due to a chemical reaction with SiO2 (e.g., oxidation
or silicidation) by the underlying wetting metal (i.e., Fe or Mo) that serves as a sacrificing layer. It should be noted that this discussion (i.e., the effectiveness of bimetal) is limited to the case of the supported catalyst used for the growth of SWNTs. In the case of a floated catalyst, in which the wettability of the metal to the support is irrelevant, many studies have demonstrated that monometallic Fe serves as an excellent catalyst for SWNTs such as in the HiPco process [4,7].
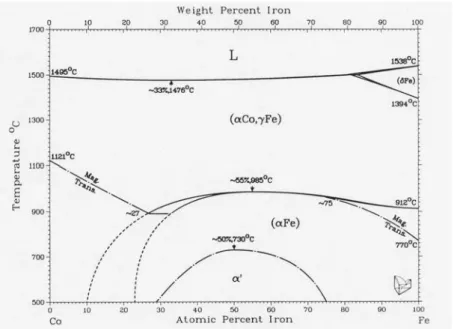
Finally, for subsection 2.1.6, Fig. 2-9 shows a phase diagram for the Fe-Co alloy system, cited from Ref. 29. Since both metals do not form a eutectic compound, they can work respectively, as described above.
2.1.7 Summary
In Section 2.1, the growth of SWNTs by the alcohol CCVD method was investigated and characterized by means of Raman scattering and TG analyses. The bimetallic Fe-Co catalyst supported through the impregnation of its acetate solution into Y-type zeolite powder is effective and feasible for the bulk production of SWNTs. The effect of reduction on the yield and diameter of the resultant SWNTs was elucidated through the comparative experiments. The reduction of the catalyst prior to the CVD reaction was shown to be effective in enhancing the growth of SWNTs.
The definition of SWNT yield has been clearly described in this study based on the appropriate interpretation of TGA results with a support by TEM observations. It has been demonstrated that a yield of SWNTs greater than 40% with sufficiently high quality can be achieved from ethanol within a CVD time of 120 min; thus, the feasibility of the proposed method toward mass production was confirmed. The reduction of the catalytic metal, which leads to an effective enhancement of the yield, plays an important role in the synthesis of SWNTs. Finally, the effect of the choice of catalyst metal on the growth of SWNTs was investigated in terms of the thermodynamic properties of the metal catalysts Fe, Co, Ni, and Mo. It was clarified that the ratio ∆Hf°sublimation/∆Hf°oxide (or γ/∆Hf°oxide) explains the
observed difference in the growth of SWNTs from different monometallic catalysts; further, it provides a theory-based index for the choice of catalyst for SWNT growth. The effect of the bimetallic catalyst was also explained in this discussion. Further detailed investigations and discussions will be presented later in Section 2.3 and 2.4.
2.2 Catalyzed growth of SWNTs from mesoporous silica thin films
2.2.1 Research background and motivation
So far, several studies [30-33] have been reported to synthesize carbon nanotubes directly on silicon wafer as a preliminary step for incorporating them into electronic circuits. However, this approach has resulted in the occasional production of multi-walled nanotubes (MWNTs) [31-33] due to a sintering of deposited/sputtered catalytic metals, which can be caused by their higher CVD temperature (typically 900°C) and almost perfect flatness of Si surface. From this concern, mesoporous silica (MPS) could be an ideal material for achieving well-regularized synthesis of carbon nanotubes with an expected effect of preventing sintering of catalytic metals.
To date, several attempts have been made to synthesize carbon nanotubes using MPS as a catalytic support [34-41]. Powders of various types of MPS were employed for mass production [34,37,38], but they all have resulted in MWNTs. Among them, Okamoto et al. [38] have reported growth of some amount of SWNTs in addition to MWNTs. Films of MPS were sometimes formed on solid substrates [35, 36, 39-41], but their major products were MWNTs and no successful synthesis of SWNTs has yet been reported. Although the growth of SWNTs was insisted by Huang et al. [41], no experimental evidence has been given by the authors concerning whether the grown nanotubes were SWNTs or MWNTs.
In this section, a new methodology of synthesizing high-quality SWNTs is proposed employing a 3-dimensional (3D) MPS thin film with accessible pores on the surface, which has near-“SBA-16” cubic structure. The method of metal loading differs from any of the past reports [35,36,39-41], where the catalytic metal was pre-mixed in the stage of silica formation. By this, the ability of MPS thin film to support of catalyst for the growth of SWNTs are demonstrated and the role of MPS layer are discussed in order to solve aforementioned problems in the selective growth of SWNTs on flat substrates.
2.2.2 Preparations and experiments
A thin film of 3D MPS was coated on a Si substrate based on the procedure developed by Yamakita [42], which had been established from the original recipe shown by Zhao et al. [43] for the fabrication of SBA-16 type MPS. First, TEOS (tetra-ethyl-ortho-silicate), ethanol, H2O, and HCl were mixed and stirred for 1 h at 65 °C to form a sol-gel solution.
This solution was mixed with an ethanol solution of amphiphilic triblock copolymer [(C2H2O)106 - (C3H4O)70 - (C2H2O)106] (BASF, F127) and stirred for another 2 h at room
temperature. The self-assembled polymers served as a structure-directing agent (SDA) in the formation of mesopores. The overall composition of prepared mixture was fixed to {TEOS : H2O : HCl : Ethanol : polymer = 1 : 9.2 : 0.021 : 40 : 7.2 × 10⁻³} in molar ratio
[42]. The solution thus prepared was mounted on a piece of Si substrate (2 cm × 2 cm) by the dip-coating method at a constant pull-up rate of 6 cm/min. After the coating, the piece was dried in air at 80°C overnight and calcinated in air at 500°C for 4 h to remove the polymers, by which an MPS thin film with a typical thickness of 50 nm was formed [42].
Subsequently, catalytic metal was loaded on the MPS-coated Si substrate (referred to as “MPS/Si substrate”). Iron acetate (CH3CO2)2Fe and cobalt acetate (CH3CO2)2Co-4H2O
were dissolved in ethanol (typically 20 ml) to form a metal acetate solution so that the weight concentration of both metals were made equal, either 0.01 wt % or 0.001 wt % in this report. The MPS/Si piece was placed on the bottom of a beaker containing the metal acetate solution and was then transferred into a desiccator for evacuation by a rotary pump for 1 h. It is crucial to set the initial solution level below 10 mm to avoid sudden boiling during the evacuation. With this process, air remaining inside the mesoporous film was replaced with the solution. The piece's surface was washed immediately after drawn-out from the solution with ethanol by two different procedures, as described in a later section. The metal-loaded MPS/Si piece was heated up to about 400 °C in the flow of He/O2 (5 %
O2) to remove organic residues and to form oxidized bimetallic particles inside (or partly on
the surface) of the thin film. As reference experiments, silica-coated Si substrates (referred to as “Silica/Si substrate”) without mesoporous structure were employed to examine the role of the mesopores. This silica/Si piece was fabricated by identical procedures for the metal loading process but without addition of the polymers.
The subsequent CVD procedure and employed CVD apparatus are the same as those presented in subsection 2.1.2. The reaction temperature, time, and ethanol vapor pressure employed in this study are 750°C, 10 min, and 10 Torr, respectively. The gas used while heating up and cooling down of the electric furnace is Ar/H2 (3 % H2). Thereby synthesized
SWNTs are characterized with FE-SEM observation (HITACHI, S-900) and Raman spectroscopic analysis (CHROMEX 501is and ANDOR DV401-FI for the spectrometer and CCD system, respectively). Laser wavelength of 488 nm is used for all Raman measurements.
2.2.3 Results and discussions
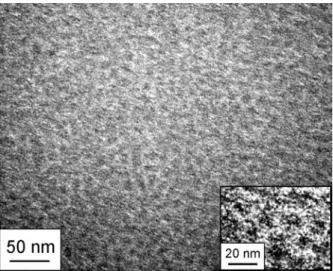
Figure 2-10 presents a FE-SEM image of the MPS/Si surface before catalytic metal was loaded. Platinum film with a thickness of less than 0.5 nm (measured by a quartz crystal microbalance) was sputtered on the surface to enhance the visibility, and the observation was performed at 6 kV, where no charge-up occurred. The dark circular apertures correspond to the mesopores formed in the silica framework. The inset reveals that the mesopores were periodically located with an approximate interval of 15 nm.
Figure 2-11 shows the pore size distribution of this MPS film determined by the
Fig. 2-10. FE-SEM image of platinum-sputtered MPS/Si surface before loading of catalytic metal. taken by Hitachi S-900 at 6 kV. The dark apertures are the mesopores formed in silica framework.
2 3 4 5 6 7 8 910 20
0 0.01
Pore diameter, nm
Absorption, cc / (nm g)
Barrett-Joyner-Halenda analysis using the MPS films coated on glass substrates in the N2
absorption/desorption measurement. A sharp peak at 6 nm corresponds to the mesopores, and a less remarkable peak around 2.6 nm is ascribed to the diameter of connecting holes between the pores (refer to Ref. 44 for 3D schematic of SBA-16 type MPS).
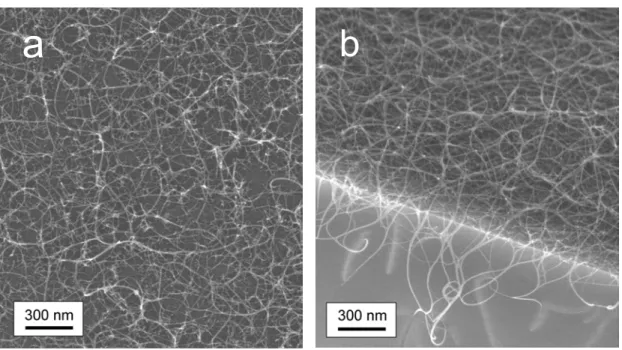
Figure 2-12 shows FE-SEM images of the MPS/Si surfaces after the CVD reaction with several magnifications. The metallic concentrations of the acetate solution used in Figs. 2-12a and 2-12b were 0.01wt% and 0.001 wt%, respectively. In both cases, the substrate surface was rinsed with ethanol immediately after the metal loading for about 3 s. The bright lines represent the bundles of SWNTs, which look somewhat blurred and thicker than actual: This is due to a change in the local emission property of secondary electrons, often observed for the SWNTs grown on Silica/Si surface [45]. The SWNTs in Fig. 2-12a look sparser and less uniform than those in Fig. 2-12b. Notably, metal particles larger than 10 nm (bright dots) are densely inhabited on the MPS surface, where some of them seem to have sintered. These particles are seen to ‘clog’ the mesopores beneath them, which might be a partial reason for such sparser population of SWNTs.
In contrast, SWNTs shown in Fig. 2-12b look more densely and uniformly populated and
a
b
a
b
Fig. 2-12. FE-SEM micrographs of MPS/Si surface after the CVD reaction when the metallic concentration in the solution used in the metal loading process was (a) 0.01 wt% and (b) 0.001 wt%, measured by Hitachi S-900 at 10 kV. The employed washing treatment was a light rinsing in ethanol. Horizontal lines denote 100 nm.
very few metal particles are found on the surface. Then it is reasonably speculated that a certain amount of SWNTs were grown from inside of the MPS thin film. Another noticeable difference lies in the visibility of the surface: The surface structure is hardly recognizable in Fig. 2-12a, while in Fig. 2-12b the fine structure of the MPS surface is clearly observed. Note that these two substrates were treated in the same batch in the processes of preparation, metal loading, CVD, and SEM observation. Usually, the surface of MPS cannot be observed without sputtering of metal particles, as exemplified in Fig. 2-10. This improved visibility was caused by a uniform coverage of its surface with SWNTs, which can act as an excellent conductor.
In order to examine the function of the MPS layer, SWNTs synthesized on the MPS/Si were compared with those on the Silica/Si substrate at a fixed metallic concentration of 0.001 wt%. Figure 2-13 presents Raman spectra of the SWNTs synthesized on the MPS/Si and Silica/Si substrates measured with 488 nm laser light, and for each substrate two types of washing treatment were employed: The first method is that employed in Fig. 2-12, or a rinse of the surface with ethanol for about 3 s (denoted as ‘lightly rinsed’). The other method is a soak of the substrate into ethanol (typically 20 ml) for 10 minutes before it was drawn out from the ethanol and dried in air (denoted as ’10 min soaked’). In each case, spectra were measured at five different locations chosen randomly, and they were
0 500 1000 1500 Raman Shift (cm–1) MPS/Si Lightly rinsed Lightly rinsed 10 min soaked 10 min soaked MPS/Si Silica/Si Silica/Si * * + * + : Si : System 200 300 1 0.9 0.8
Intensity (arb. units)
Raman Shift (cm–1) Diameter (nm) MPS/Si MPS/Si Lightly rinsed Silica/Si Silica/Si 10 min soaked Lightly rinsed 10 min soaked * + 0 500 1000 1500 Raman Shift (cm–1) MPS/Si Lightly rinsed Lightly rinsed 10 min soaked 10 min soaked MPS/Si Silica/Si Silica/Si * * + * + : Si : System 200 300 1 0.9 0.8
Intensity (arb. units)
Raman Shift (cm–1) Diameter (nm) MPS/Si MPS/Si Lightly rinsed Silica/Si Silica/Si 10 min soaked Lightly rinsed 10 min soaked * +
Fig. 2-13. Raman spectra of MPS/Si and Silica/Si substrates after the synthesis of SWNTs measured with 488 nm laser light. The metallic concentration during the metal loading process was 0.001 wt% for all cases. For each substrate, two types of washing treatment noted in text were employed.
![Figure 2-3 shows the Raman spectra corresponding to Fig. 2-2b. Detailed interpretations of the Raman spectra are presented in elsewhere [22]](https://thumb-ap.123doks.com/thumbv2/123deta/9881467.989781/26.892.194.697.701.999/figure-raman-spectra-corresponding-detailed-interpretations-spectra-presented.webp)