Preparations and Characterization of Chitin Nanofibers and Related Materials
July, 2014
Ajoy Kumar Dutta
Department of Chemistry and Biotechnology
Graduate School of Engineering
Tottori University
CONTENTS
General Introduction 1
Chapter1. Preparation of α-Chitin Nanofibers by High Pressure Water
Jet System: Impact of Number of Passes on Nanofibrillation 6
1.1 Introduction 1.2 Experimental
1.3 Results and Discussion 1.4 Conclusion
Chapter 2. Simple Preparation of β-Chitin Nanofibers from Squid Pen 26
2.1 Introduction 2.2 Experimental
2.3 Results and Discussion 2.4 Conclusion
Chapter 3. Novel Preparation of Chitin Nanocrystals by H2SO4 and
H3PO4 Hydrolysis 40
3.1 Introduction 3.2 Experimental
3.3 Results and Discussion 3.4 Conclusion
Chapter 4. Simple Preparation of Chitosan Nanofibers by High Pressure
Water Jet System 55
4.1 Introduction 4.2 Experimental
4.3 Results and Discussion 4.4 Conclusion
Chapter 5. Facile Preparation of Surface N-halamine Chitin Nanofiber
to Endow Antimicrobial Activities 70
5.1 Introduction 5.2 Experimental
5.3 Results and Discussion 5.4 Conclusion
General Summary 88
References 92
List of Publications 106
Acknowledgements 107
List of Figures
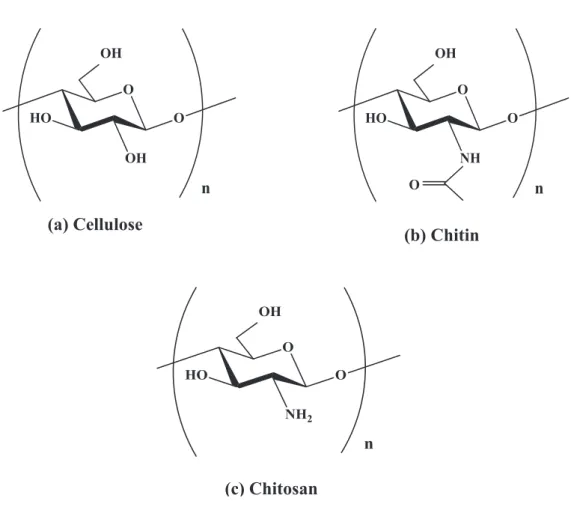
Figure 1. Chemical structure of (a) cellulose, (b) chitin, and
(c) chitosan. 2 Figure 2. FE-SEM micrograph of α-chitin powder. 8
Figure 3. FE-SEM micrographs of α-chitin fibers after several passes
treatments by HPWJ system. The scale bar length is 400 nm. 14 Figure 4. FT-IR spectrum of α-chitin nanofibers at several passes. 15
Figure 5. Average widths of α-chitin nanofibers as a function of
number of passes. 17 Figure 6. Molecular weights of α-chitin nanofibers as a function of
number of passes. 18 Figure 7. Regular light transmittance of α-chitin nanofiber suspensions
at 600 nm as a function of number of passes. 19 Figure 8. Viscosity of α-chitin nanofiber suspensions as a function
of number of passes. 20 Figure 9. Density of α-chitin nanofiber sheets as a function of
number of passes. 21 Figure 10. Yong’s moduli of α-chitin nanofiber sheets as a function
of number of passes. 22 Figure 11. Tensile strength of α-chitin nanofiber sheets as a function
of number of passes. 23 Figure 12. Regular light transmittance of α-chitin nanofiber suspensions
at 600 nm as a function of number of passes. 24
Figure 13. SPM images of β-chitin nanofibers after (a) 1, (b) 5, (c) 10, (d)
30 and (e) 50 passes treatments. The scale bar length is 1 μm. 31 Figure 14. Regular light transmittances of α-chitin nanofibers (diamond)
and β-chitin nanofibers (circle) at 400 nm graphed against the
number of passes. 34 Figure 15. Viscosity of β-chitin nanofibers slurry graphed against the
number of passes. 35 Figure 16. Density of β-chitin nanofiber sheets graphed against the
number of passes. 36 Figure 17. Young’s moduli of β-chitin nanofibers graphed against the
number of passes. 37 Figure 18. Tensile strength of β-chitin nanofibers graphed against
the number of passes. 38 Figure 19. SPM image of H-CNC. The scale bar length is 1 μm. 47
Figure 20. SPM images of (a) S1-, (b) S2-, (c) S3-, and (d) S4-CNC.
The scale bar length is 1 μm. 48 Figure 21. SPM images of (a) P1-, (b) P2-, and (c) P3-CNC. The
scale bar lengths are 1 μm. 48 Figure 22. X-ray diffraction profiles of (a) H-, (b) S3-, and (c) P2-CNCs. 50
Figure 23. Digital images and their UV-Vis transmittances of (a) H-, (b)
S3-, and (c) P2-CNC dispersions with 0.1wt. % concentration. 52 Figure 24. (a) TGA and (b) derivative of TGA curves of H-, S-3,
and P2-CNCs in Argon. 53
Figure 25. FE-SEM micrograph of chitosan flakes. 59
Figure 26. SEM images of chitosan nanofibers after several passes
treatments by HPWJ system. The scale bar length is 300 nm. 61 Figure 27. Degree of relative crystallinity of chitosan nanofibers as a
function of number of passes. 62 Figure 28. Regular light transmittance of chitosan nanofiber suspensions at
600 nm graphed against the number of passes. 63 Figure 29. Viscosity of chitosan nanofiber suspensions as a function
of number of passes. 64 Figure 30. Density of chitosan nanofiber sheets as a function of
number of passes. 65 Figure 31. Yong’s moduli of chitosan nanofiber sheets graphed
against the number of passes. 66 Figure 32. Tensile strength of chitosan nanofiber sheets graphed
against the number of passes. 67 Figure 33. Coefficient of thermal expansion of chitosan nanofiber
sheets as a function of number of passes. 68 Figure 34. Surface N-chlorination of chitin nanofiber. 72
Figure 35. Effect of sodium hypochlorite concentration on active
chlorine content loaded on chitin nanofiber. 78
Figure 36. Effect of chlorination time on active chlorine content
in chitin nanofiber film. 79
Figure 37. FT-IR spectra of (a) chitin nanofiber film and (b) the
chlorinated derivative with 2.63% active chlorine content. 80
Figure 38. UV-Vis spectra of (a) chitin nanofiber film and (b) the
chlorinated derivative with 2.63% active chlorine content. 81
Figure 39. X-ray diffraction profiles of (a) chitin nanofiber film and (b)
the chlorinated derivative with 2.63% active chlorine content. 82
Figure 40. Derivative TG analysis of (a) chitin nanofiber film and (b) the
chlorinated derivative with 2.63% active chlorine content. 82
Figure 41. SEM images of (a) chitin nanofiber film and (b) the chlorinated
derivative with 2.63% active chlorine content. 83
Figure 42. Storage stability and rechargeability of chlorinated chitin
nanofiber film. 84
Figure 43. Antifungal effect of chlorinated CNF films with 2.69% active chlorine content. Spores were sandwiched between CNF films for 24 h. Spores were harvested and placed on cellulose membr- ane for microscopic observation. Data represent the mean of th- -ree independent experiments and error bars. Asterisks indicate
significant differences with Tukey’s test between films (P<0.05). 85
List of Tables
Table 1. Degree of relative crystallinity of α-chitin nanofbers. 16
Table 2. Coefficient of thermal expansion of α-chitin nanofiber sheets. 23
Table 3. Width of β-chitin nanofibers. 32
Table 4. Degree of relative crystallinity of β-chitin nanofibers. 33
Table 5. Coefficient of thermal expansion of β-chitin nanofibers. 39
Table 6. Sulfuric acid hydrolysis of chitin to prepare chitin nanocrystals
(S-CNC). 44 Table 7. Phosphoric acid hydrolysis of chitin to prepare chitin nanocrystals
(P-CNC). 44 Table 8. Degree of relative crystallinity of chitin nanocrystals. 51
Table 9. Percentage reduction of E. coli and S. aureus. 85
General Introduction
Chitin is the second most widely occurring biopolymer in the world behind cellulose, and is synthesized in quantities of approximately 1010 to 1011 tons each year.1 Chitin is composed of β-1,4 linked N-acetylglucosamine units, though some deacetylation (5-10 %) is typically present in natural systems. They are structurally similar, but chitin has unique characteristics because of its C-2 acetamide group [Figure 1(a), (b)]. The major forms of chitin in animals include, the exoskeletons of crustaceans and mollusks, the backbone of squids and the cuticles of insects. 2 In recent years, chitin has attracted much attention in the scientific community because of its unusual combination of biological activities and mechanical and physical properties.3 As such;
chitin has found applications in biomedicines, foods, and cosmetics, and as nanocomposites, and electrochemical biosensors.2, 4 - 8
Depending on its biological origin, chitin has been found in three polymorphic forms, as α-, β-, and γ-chitin.9 These polymorphic forms differ in their arrangement of chains within crystalline regions, indicating different networks of hydrogen bonds. The α-type is characterized by an anti-parallel arrangements of adjacent chains, the β-type by a parallel arrangement, and the γ-type having a mixed arrangement of chitin chains.10 Most chitins have α-type crystalline structure, while the β-type present in squid pen and tubeworms,11 and the γ-type in cocoon fibers of the Ptinus beetle and the stomach of Loligo.12 The crystallinity of chitins influences the accessibility of internal sorption sites to solvent, reducing the solubility of chitins in most common solvents.
Chitosan [Figure 1(c)] is a naturally occurring linear cationic polysaccharide generated by the deacetylation of chitin. It’s environmentally friendly, non-toxic, and antimicrobial properties have led to significant interest in the biomedical applications of chitosan, including for drug deliveries, as artificial tissue scaffolds for functional tissue engineering, and for wound-healing dressings.13-15 Chitosan has also been widely studied for its applications in food, food-film packaging, the textile industry, water purification and metal chelation.16 - 20
Figure 1. Chemical structure of (a) cellulose, (b) chitin, and (c) chitosan.
(a) Cellulose㻌
(b) Chitin
㻌
(c) Chitosan
Nanofibers are typically defined as fibers smaller than 100 nm in at least one dimension. At this scale, nanofibers have a larger surface area; greater mechanical, electrical, and optical properties; and greater chemical reactivity than larger fibers.
These features suggested that nanofibers may have promising applications, especially in nanofibers-reinforced composites, tissue engineering scaffolds, drug delivery, and filter media.21 - 24 Interest has increased, however, in the production of nanofibers from biopolymers, owing to their “green” characteristics. This includes biocompatibility, and biodegradability, as well as ecological safety, low toxicity, renewability, and sustainability.25
Considering all of the factors, we hypothesized that the natural polymer chitin and its derivative chitosan could act as raw material in the synthesis of nanofibers.
Moreover, an eco-friendly, facile process, using high pressure water jet technology, was deliberately used throughout the study to synthesize nanofibers. These nanofibers were subsequently characterized in detail, including their morphology, chemical and crystalline structure, transparency, viscosity, and mechanical properties. Finally, antimicrobial activities were generated by modifying surface of the chitin nanofibers.
Chapter 1 describes the preparation of α-chitin nanofibers using a high pressure water jet (HPWJ) system, along with the effect of different passes on nanofibrillation.
The number of passes was found to strongly affect the nanofiber morphology, molecular weight, thickness and length. Scanning probe microscopy (SPM) showed that the thickness of individualized nanofibers ranged from 4 to 6 nm. Although the mechanical properties of chitin nanofiber sheets were improved by increasing the number of passes
to 30, their chemical and crystalline structures remained unaltered even at higher passes, despite applying a high pressure of 245 MPa during each cycle.
Chapter 2 describes the preparation of β-chitin nanofibers from squid pen chitin.
The morphology of these nanofibers was characterized by SPM, with the results supported by the viscosity and transmittance of nanofibers slurry. Nanofibers 3-4 nm thick were isolated, with their chemical structure remained unaffected. The crystalline structure and crystallinity of these nanofibers were maintained fully after applying HPWJ technology.
Chapter 3 describes the preparation of chitin nanocrystals (CNCs) after hydrolyzing chitin powder using hydrochloric, sulfuric and phosphoric acids generating H-CNCs, S-CNCs and P-CNCs. The dimensions of the CNCs depended on the acid to chitin ratio, as well as the hydrolysis time. The mean cross-sectional widths of H-, S- and P-CNCs were found to be 9.3 nm, 8 nm, and 7.3 nm, respectively. All forms of nanocrystals homogeneously dispersed in water, although, P-CNCs had the highest thermal stability.
Although, electrospinning is the conventional method used to extract chitosan nanofibers, Chapter 4 describes HPWJ system for nanofibers isolation. Powdered chitosan was converted into thinner nanofibers, with nanofibrillation stopped after about 10 passes. Although, thickness of these nanofibers did not change notably after 10 passes, their crystallinity decreased gradually because of the increase in high collisions forces generated during the extensive cycles of treatments. Therefore, the mechanical
properties and thermal expansion of the chitosan nanofiber sheets improved only up to 10 passes, with further treatment resulting in a deterioration of these properties.
In chapter 5, the surface of chitin nanofiber (CNF) film was modified to N-halamine by the reaction of the film with sodium hypochlorite solution at room temperature, endowing the film with antibacterial and antifungal properties. The amount of active chlorine content loaded on the CNF film depended on the sodium hypochlorite concentration and reaction time. FT-IR, UV-Vis, XRD, and TG analyses showed that the N-H bond was replaced by an N-Cl bond and that the reaction took place at the CNF surface. After chlorination, the characteristic nanochitin morphology was maintained.
Although the active chlorine content of the film gradually decreased because of disassociation of the N-Cl bond, chlorine could be transferred to the CNF by another treatment with sodium hypochlorite solution. The chlorinated CNF film showed strong efficacies against Gram-negative and -positive bacteria, such as of Escherichia coli and Staphylococcus aureus, respectively, will kill all pathogens within 30 min. Moreover, incubation of the films with the fungi Alternaria alternata and Penicillium digitatum showed 100% and 80% inhibition of spore germination, respectively.
Chapter 1
Preparation of α-Chitin Nanofibers by High Pressure Water Jet System: Impact of Number of Passes on Nanofibrillation
1. 1 Introduction
Chitin, a β-(1→4)-linked 2-amino-2-deoxy-D-glucosamine, is a natural polysaccharide of major importance, and found mainly in two marine crustaceans, shrimp and crabs.2 It is the second most abundant biopolymer, after cellulose, representing its huge availability throughout the world. In spite of chitin’s nanofibrillar morphology and attractive properties, in particular biodegradability, biocompatibility, and non-toxicity, most chitin is thrown away as underutilized waste. Therefore, it is important to make effective use of chitin as an environmental friendly “green” material.
Chitin nanofiber has attracted attention with great interest due to their extremely large and active surface areas, while several methods have been employed to prepare them.26 - 28 In recent years, Ifuku et al. effectively prepared chitin nanofibers from crab and prawn shells, in addition to mushroom cell walls.29 - 31 The nanofibers found to have uniform morphology with 10-20 nm width and high aspect ratios. The most fascinating feature was the homogeneous dispersibility of nanofibers in water that helped to shape the fibers into desired forms. A grinder instrument was utilized to obtain chitin nanofibers.The complex hierarchical organization of chitin consisting of aggregate of
nanofibers, shown in Figure 2, was disintegrated by the shearing forces generated by a specially designed pair of grinding stones.
Recently, a novel high pressure water jet (HPWJ) system was developed by Sugino Machine Co., Ltd. to downsize materials in nano-size form.32 Kose et al.
prepared chitin nanofibers using this system.33 The sample in the form of slurry was fed from the tank, as soon compressed by a hydraulic piston, and ejected at high pressure from a pair of nozzles. Atomization of chitin occurred due to the collisions of ejected pairs of jets into the chamber. However, Ifuku et al. stated that the nanofibrillaiton can be improved by using a milder acidic condition, in this system.34 Moreover, chitin nanofibers from the HPWJ system are more advantageous in high-volume production, maintaining the product quality, and allowing less contamination compared with the disintegration by a grinder.
In this study, the author describes the preparation of α-chitin nanofibers using HPWJ system, wherein 1 to 100 passes of mechanical treatments directly applied over the chitin’s samples to study the effects of various passes on nanofibrillation. The morphological changes of nanofibers were investigated by scanning electron microscopy (SEM), along with their chemical structure, crystallinity, molecular weight, transparency, viscosity, and mechanical properties. Although, chitin nanofibers with desired properties are of huge demand for specific commercial applications, there had been no reports in detail.
1. 2 Experimental
1. 2. 1 Materials
α-Chitin powder from crab shell and acetic acid were purchased from Nakalai Tesque and Kanto Reagent, respectively, and were used as received. The acrylic monomer, poly (propylene glycol) diacrylate, was obtained from the Shin-Nakamura Chemical Co., Ltd.
Figure 2. FE-SEM micrograph of α-chitin powder. Reproduced with permission from ref. 55. Copyright 2013, American Scientific Publishers.
1. 2. 2 Preparation of Chitin Nanofibers
Dry chitin powder was dispersed in water at 1 wt. %. Acetic acid was added at pH 3 to aid the nanofibrillation by cationization of the amino group. The chitin was crushed roughly with a domestic grinder. The slurry was stirred for 1 h under vacuum to remove air bubbles and then was passed through the HPWJ system (Star Burst Mini, HJP-25001S, Sugino Machine Co., Ltd.) equipped with a ball-collision chamber. The
slurry was ejected from a small nozzle having a diameter of 100 μm under high pressure (245 MPa), soon after collided with a ceramic ball with a diameter of 12.7 mm. The suspension was passed through 1, 5, 10, 30, 50, and 100 mechanical treatments, consecutively.
1. 2. 3 Preparation of Chitin Nanofiber Sheets and Composites
Fibrillated chitin nanofibers were dispersed in neutral water at a fiber content of 0.1 wt. %. The suspension was vacuum-filtered using a membrane filter. The obtained chitin nanofiber sheets were dried by hot-pressing at 100 oC for 30 min. The dried sheets were cut into 5 cm × 5 cm squares of approximately 54 μm thickness and with a weight of approximately 10 mg. The squares were impregnated with bi-functional acrylic resin monomer with 2 wt. % of 2-hydroxy-2-methylpropiophenone photo initiator under reduced pressure for 24 h. The monomer-impregnated sheets were radically polymerized using UV curing equipment (Spot Cure SP-7, Ushio Inc.) for 8 min at 40 mW cm−1. The composite films thus obtained were approximately 76 μm thick, with a fiber content of approximately 43%, calculated based on the dry weights of the squares and nanocomposites.
1. 2. 4 Characterization
1. 2. 4. 1 Examination of Morphological Changes
For field emission scanning electron microscopic (FE-SEM) observation,
chitin powder was dried in a vacuum drying oven. The sample was coated with an approximately 2 nm layer of Pt by an ion sputter coater and observed by FE-SEM (JSM-6700F; JEOL, Ltd.) operating at 2.0 kV.
SPM observations were performed with a nanocute model SPM apparatus (Seiko Instruments Inc., Japan). Chitin nanofibers slurry was dispersed in water, with a concentration of 0.1 mg mL-1, by an ultrasonic homogenizer just for one minute. A few drops (40 μL) of the suspension was spread on a freshly cleaved mica round disk, dried up and was examined with the help of scanning probe microscopy (SPM) observation.
SPM observations were performed with a nanocute model SPM apparatus (Seiko Instruments Inc., Japan). Images were recorded as 256 × 256 pixel images for 5 μm wide square. SPM images (topographic images) were used to measure the widths of chitin nanofibers by selecting the measuring points along the fiber axes.
1. 2. 4. 2 Determination of Chemical and Crystalline Structure
Chemical structure of chitin nanofibers were determined by the FT-IR Spectroscopy. Infrared spectra of the samples were recorded with an FT-IR spectrophotometer (Spectrum 65, Perkin-Elmer Japan Co., Ltd.,) equipped with an ATR attachment.
X-ray diffraction studied was carried out to investigate the crystalline structure of the chitin and its nanoifbers. The profiles of the nanofibers were obtained with Ni-filtered CuKα from an X-ray generator (Ultima IV, Rigaku) operating at 40 kV and
30 mA. The diffraction profile was detected using X-ray goniometer scanning from 5o to 35o. The crystalline index (CI) was determined by following the equation: CI = (I110 − Iam) × 100/I110, where I110 is the maximum intensity of the [110] plane and Iam is the intensity of the amorphous diffraction at approximately16o .35
1. 2. 4. 3 Molecular weight determination
The molecular weight of chitin powder and dry chitin nanofibers were measured by the Viscosity Method with an Ubbelohde viscometer (no. 2) (Kusano Science Corporation, Tokyo, Japan) at 25 ± 0.2 °C. The specific viscosities, ηsp were calculated from the following equation:
ߟSP =ቆ ݐ
ݐޚെ ͳቇሺͳሻ
Here the parameters t and to were the flow times of the solvent with and without the sample, respectively. Three flow time measurements were done for each solution. The flow time data were used to calculate the specific viscosity and then the intrinsic viscosity by a linear regression of the specific viscosity versus concentration.
Finally, with the intrinsic viscosity results, the Mark-Houwink-Sakurada equation was used to calculate the molecular weight of chitin and its nanofibers:
[η] = K (Mw) a (2) Here K (7.6×10⁻⁵ dL g-1) and a (0.95) are empirical constant valid for a specific polymer-solvent system at a given temperature.36 η is the intrinsic viscosity and Mw is the molecular weight.
1. 2. 4. 4 Measurements of Light Transmittance and Viscosity
The light transmittances of chitin nanofiber dispersions (0.1 wt. %) and the composites were measured using a UV-Vis spectrophotometer (V550; JASCO, Tokyo, Japan).
The viscosity of the chitin nanofibers dispersions with 1.0 wt. % was measured using a Brookfield digital viscometer DV-E using spindle no. LV-4 (Brookfield Engineering Laboratories, Middleboro, MA).
1. 2. 4. 5 Determinations of Mechanical Properties
The Young’s modulus and tensile strength analysis of sheets were evaluated using a universal testing instrument (AG-X, Shimadzu, Tokyo, Japan) for samples 50 mm long and 10 mm wide. At least five specimens were tested for their nanofiber sheets.
The coefficients of thermal expansion (CTE) of the sheets were measured with a thermomechanical analyzer (Q400, TA Instruments, Newcastle, DE). Specimens were 30 mm long and 3 mm wide, with a 20 mm span. The measurements were carried out from 30 to 165 oC by elevating the temperature at a rate of 5o min-1 in a nitrogen atmosphere in tensile mode under a load of 0.05 N. The CTE values were determined in the second run in order to dry the sample completely in the first run.
1. 3 Results and Discussion
1. 3. 1 Morphological Change of Chitin Powders
Scanning electron microscopic (SEM) observations are depicted in Figure 3.
These illustrated the morphological changes of dry chitin powder into nanofibers by HPWJ, after 1to100 cycles of treatments. Even after only one pass, the chitin aggregates shown in Figure 2 were considerably disintegrated into the mixture of tens of nano-sized and submicron-sized fibers. The significant morphological change of solid chitin even after one cycle of treatment was caused by the electrostatic repulsive forces among the nanofibrills resulted from the cationization of amino groups in acidic condition. The presence of small amount of acid just crushed the strong hydrogen bonds among the fibrills in chitin. After 5 passes, chitin nanofibres morphology changed remarkably. Most of chitin aggregates were well fibrillated into nano-sized fibers.
However, chitin nanofibers morphology did not change notably above 10 passes, although, a small amount of sub-micron-sized fibers continued to be fibrillated until 30 passes. Basically, at around 30 passes, nanofibrillatoin ended completely. On the other hand, the nanofibers length shortened above 30 passes, due to the strong collision forces created from the extensive cycles of treatments by the system. Therefore, morphology of chitin nanofibers persistently depended on the number of passes of HPWJ system.
1. 3. 3 Chemical and Crystalline Structures of Chitin Nanofibers
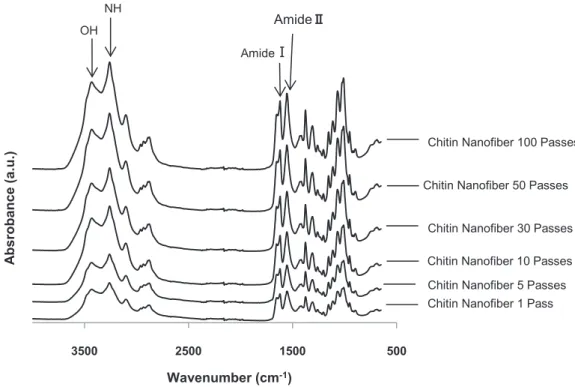
The FT-IR spectra of the isolated chitin nanofibers treated by the HPWJ system
after 1, 5, 10, 30, 50, and 100 passes, are depicted in Figure 4. All spectra of the obtained nanofibers were in excellent agreement with the spectrum of commercial chitin.
For instance, the OH stretching band at 3424 cm−1, the NH stretching band at 3259 cm−1, the amide I band at 1652 and 1621 cm−1, and the amide II band at 1554 cm−1 of the chitin nanofibers are characteristic of α-chitin. This suggests that the original chemical structures of chitin were maintained after the HPWJ mechanical treatments even with 100 passes.
Figure 3. FE-SEM micrographs of α-chitin fibers after several passes treatments by HPWJ system. The scale bar length is 400 nm. Reproduced with permission from ref. 55. Copyright 2013, American Scientific Publishers.
The crystalline structure of the nanofibers fibrillated by the HPWJ system after several passes was studied by wide-angle X-ray diffraction (WXRD). All diffraction patterns coincided closely with those of the original chitin powder. The diffraction
400 nm㻌
1pass 5 passes 10 passes
100 passes 50 passes
30 passes
peaks of the chitin nanofibers observed at 2θ = 9.2, 19.1, 20.9, and 23.1o corresponded to [020], [110], [120], and [130] planes, respectively. They were typical antiparallel crystal patterns of α-chitin.37 Thus, the original crystalline structure was maintained after the HPWJ treatments. Table I shows the degree of relative crystalline indices of chitin nanofibers determined from X-ray diffraction profiles. The degree of the relative crystalline index of the original chitin powder was 83.7%. After the HPWJ treatments from 1 to 100 passes, there were no significant differences in the relative degree of crystallinity (83.3-84.4%). This indicates that even 100 passes of HPWJ treatments did not damage the crystalline structure of the chitin fibers, although the system employed a super high-pressure water jet of 245 MPa.
Figure 4. FT-IR spectra of α-chitin nanofibers at different passes.
500 1500
2500 3500
Absrobance (a.u.)
Wavenumber (cm-1) AmideϨ
Amideϩϩ
Chitin Nanofiber 1 Pass Chitin Nanofiber 50 Passes
Chitin Nanofiber 30 Passes Chitin Nanofiber 10 Passes Chitin Nanofiber 5 Passes OH
NH
Chitin Nanofiber 100 Passes
Table 1. Degree of relative crystallinity of α-chitin nanofbers.
1. 3. 2 Cross-sectional Widths of Chitin Nanofibers
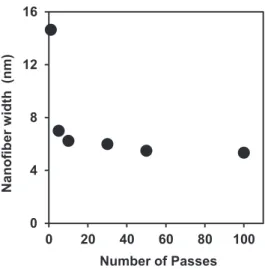
The scanning probe microscopic (SPM) technology was used to make an authentic measurement of the chitin fibrils widths. Such measurements were made for 100 points on isolated fibrils of individual images of each passes that resulted in the histograms. The histogram reflected chitin fibrils of different thickness ranging from 3 to 8 nm. However, this was an average scenario of chitin nanofibers thickness. The effect of individual cycles of treatments by HPWJ system can be explained from Figure 5, which shows the cross-sectional widths of chitin nanifibers for individual passes. The widths of nanofibers changed drastically from 14.65 nm at 1pass to 7 nm at 5 passes and then steadily reached to 6 nm at 30 passes, after which the fiber thickness did not change remarkably. However, chitin nanofibrils with thickness of ӌ 1 nm was noted surprisingly in all passes, except for 1 pass. The variations of nanofibers widths were in good agreement with the morphological changes of chitin nanofibers.
Number of Passes Original 1 5 10 30 50 100
Relative Crystallinity (%) 83.7 83.3 84.3 84.3 84.2 84.4 84.4
Figure 5. Average widths of α-chitin nanofibers as a function of number of passes.
Reproduced with permission from ref. 56. Copyright 2013, American Scientific Publishers.
1. 3. 4 Molecular Weights of Chitin and its Nanofibers
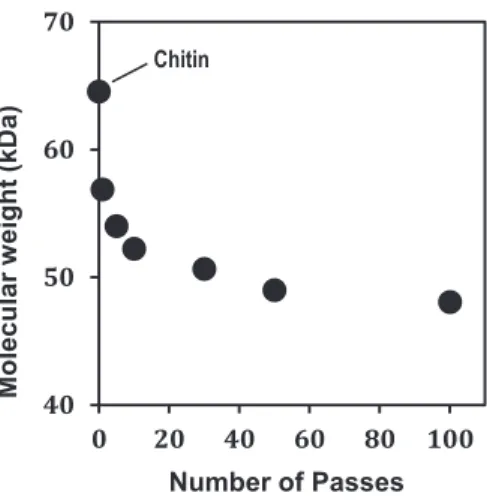
The Huggins viscosity relation is represented on the viscosity/concentration plots. Extrapolation yielded the intrinsic viscosity [η] for chitin and its nanofibers solutions. Molecular weight was then determined by the help of Mark-Houwink-Sakurada equation (Equation 2). Figure 6 shows the molecular weight of chitin and its nanofiber as a function of number of passes. The molecular weight of original chitin is 64.56 kDa. On the other hand, the molecular weight of chitin nanofibers decreased gradually from 1 pass (56.87 kDa) to 30 passes (50.66 kDa).
These trends of molecular weight are similar with the morphological changes of chitin nanofibers. The probable reason is that the chain scissions of chitin molecules at glycosidic linkage occurred only up to a certain passes.
0 4 8 12 16
0 20 40 60 80 100
Nanofiber width (nm)
Number of Passes
Figure 6. Molecular weights of α-chitin nanofibers as a function of number of passes.
Reproduced with permission from ref. 56. Copyright 2013, American Scientific Publishers.
1. 3. 5 Transparency and Viscosity of Chitin Nanofiber Suspensions
Figure 7 shows the regular light transmittances at 600 nm of chitin nanofiber slurry with 0.1 wt. % concentration fibrillated by the HPWJ system. Transparency is strongly associated with chitin fiber thickness because, when the solid fibers dispersed at nano level, the suspension became transparent. Generally, chitin does not disperse at all but precipitates in water, which has been a longstanding issue for the application of chitin. On the other hand, after the HPWJ treatment, chitin slurries dispersed homogeneously in water for at least a month. Thus, chitin nanofibers were easy to handle and shape into desired forms. At one pass, the light transmittance of chitin slurry was only 27.3%. At 5-30 passes, the transmittance increased steeply, to 45.9-73.9%, respectively. Above 30 passes, the transparency reached almost its peak. This trend indicates that, up to 30 mechanical treatments, chitin fibers were fibrillated into thinner
40 50 60 70
0 20 40 60 80 100
Molecular weight (kDa)
Number of Passes Chitin
nanofibers, increasing their transparency. However, above 30 passes, the nanofibers were mostly fibrillated and further disintegration was difficult, resulting in saturated transparency. These trends agreed well with the results of SEM.
Figure 7. Regular light transmittance of α-chitin nanofiber suspensions at 600 nm as a function of number of passes. Reproduced with permission from ref. 55. Copyright 2013, American Scientific Publishers.
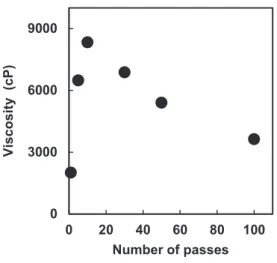
The viscosities of the chitin nanofiber slurry with 1.0 wt. % fibrillated by the HPWJ system are shown in Figure 8, graphed against the number of passes from 1 to 100. The viscosity increased from 2010 cP at one pass to 8330 cP at 10 passes. On the other hand, above 10 passes, the viscosity decreased abruptly to 3630 cP at 100 passes.
Viscosity is strongly affected by nanofibers morphology. That is, the thinner and shorter chitin nanofibers are, and the more frequently the fibers become entangled, which increases viscosity. The viscosity data indicate that, up to around 10-30 passes, the nanofibers became thinner as the number of passes increased, indicating that the nanofibrillation was mostly completed. After this, the fiber length decreased as the
0 30 60 90
0 20 40 60 80 100
Transmittance (%)
Number of passes
fibers started to break, thereby lowering viscosity.
Figure 8. Viscosity of α-chitin nanofiber suspensions as a function of number of passes.
Reproduced with permission from ref. 55. Copyright 2013, American Scientific Publishers.
1. 3. 6 Characterizations of Chitin Nanofiber Sheets
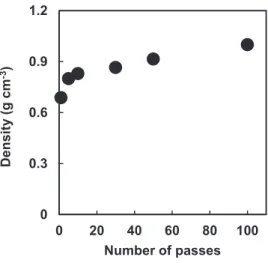
Chitin nanofiber sheets were easily prepared by vacuum-filtration. Figure 9 show the density of the chitin nanofiber sheets as a function of the number of passes. At 1-10 passes, the density steeply increased to 0.69 to 0.83 g cm-3, respectively. On the other hand, above 10 passes, the value did not change significantly. The sheet density related to the chitin nanofiber morphology shown in Figure 3. It was assessed that the thinner and shorter chitin nanofibers are, the more the nanofibers are packed densely in the sheet.
0 3000 6000 9000
0 20 40 60 80 100
Viscosity (cP)
Number of passes
Figure 9. Density of α-chitin nanofiber sheets as a function of number of passes.
Reproduced with permission from ref. 55. Copyright 2013, American Scientific Publishers.
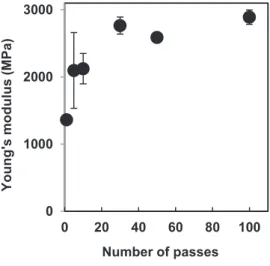
Since chitin nanofibers from crab shell have an antiparallel extended crystal structure, they have a high Young’s modulus and high tensile strength.38 Figures 10 and 11 show the tensile Young’s moduli and fracture strengths, respectively, of the chitin nanofiber sheets against the number of passes from 1 to 100. As the number of passes increased, Young’s moduli and fracture strengths increased. However, above 30 passes, these values did not change significantly. Basically, the fibers mechanical properties were strongly associated with nanofiber thickness. As the nanofibers became thinner, the surface area increased, which further increased the number of the hydrogen bonds between nanofibers that driven the improved mechanical properties of the chitin nanofiber sheet. Moreover, as the nanofibers became thinner, sheet density increased, which also affected mechanical properties. Since the chitin nanofiber sheets did not show a decrease in Young’s moduli or in tensile strength above 30 cycles of the HPWJ treatment, the crystalline chitin fibers were not severely degraded even with 100 passes.
0 0.3 0.6 0.9 1.2
0 20 40 60 80 100
Density (g cm-3)
Number of passes
Figure 10. Yong’s moduli of α-chitin nanofiber sheets as a function of number of passes.
Reproduced with permission from ref. 55. Copyright 2013, American Scientific Publishers.
Figure 11. Tensile strength of α-chitin nanofiber sheets as a function of number of passes. Reproduced with permission from ref. 55. Copyright 2013, American Scientific Publishers.
0 1000 2000 3000
0 20 40 60 80 100
Young's modulus (MPa)
Number of passes
0 20 40 60 80
0 20 40 60 80 100
Tensile strength (MPa)
Number of Passes
Thermal expansion is inversely related with Young’s modulus. Since the Young’s modulus of a chitin nanofiber (not a sheet) is estimated to be at least 150 GPa, its coefficient of thermal expansion (CTE) is very small.38, 39 Table 2 shows the CTE values of chitin nanofiber sheets. The CTEs of all chitin nanofiber sheets were less than 10 ppm K-1, and the HPWJ treatments did not significantly change the CTE. This result also supports that the characteristic extended crystalline structure of chitin nanofibers did not change after repeated fibrillation treatment.
Table 2. Coefficient of thermal expansion of α-chitin nanofiber sheets.
1. 3. 7 Transparency of Chitin Nanofibers Composite
Bacterial cellulose nanofiber-reinforced plastic films were recently reported by Yano et al.40 The nanocomposite was optically transparent due to the nanofiber size effect. The results of this study could be applicable to chitin nanofibers for transparent nanocomposites.31, 41, 42 Since the transparency depends strongly on fiber thickness, it will provide relative morphological information about the nanofibers. Thus, chitin nanofiber composite films with acrylic resin were prepared. The author chose poly (propylene glycol) diacrylate resin purposely as a matrix substance to see the
Number of Passes 1 5 10 30 50 100
Thermal Expansion (ppm K-1) 8.15 6.74 7.06 6.78 7.39 8.21
morphological changes in nanofibers. The refractive index (RI) of the resin was 1.468, which is not very close to that of chitin nanofiber (approximately 1.50). This difference causes a loss of transparency, since it causes light scattering at the interface between the nanofiber and the resin. Figure 12 shows the regular light transmittances of the composites as a function of the number of passes. The changes in transparency also indicate that the nanofibers became thinner as the number of passes increased. However, above 30 passes, the transparency of the nanocomposite was saturated, as the chitin nanofibers were mostly fibrillated. Since the light transmittance of neat poly (propylene glycol) was approximately 90% at 600 nm, optical losses of the nanocomposite film was very small, though the fiber content at 30 passes is high (43%).
Figure 12. Regular light transmittance of α-chitin nanofiber suspensions at 600 nm as a function of number of passes. Reproduced with permission from ref. 55. Copyright 2013, American Scientific Publishers.
0 30 60 90
0 20 40 60 80 100
Transmittance (%)
Number of passes
1. 4 Conclusion
The effects of HPWJ system on nanofibrillation of α-chitin at different passes was discussed in terms of several properties including the morphology, chemical structure, and crystallinity. SEM images showed that the nanofibrillation of chitin slurry significantly affected by the number of passes, although at around 10 passes disintegration ended remarkably. The thickness of nanofibers decreased as the number of passes increased gradually up to 30 passes. The light transmittance of the chitin nanofiber slurry and the nano-composite with acrylic resin showed the similar trend. On the other hand, above 30 passes, the nanofibers started to break. However, X-ray diffraction profiles of the chitin nanofibers showed that the HPWJ treatment did not reduce crystallinity, even with the high collision forces generated by HPWJ system.
Therefore, mechanical properties were improved by nanofibrillation, and extensive cycles of treatment did not reduce their properties. The HPWJ system is advantageous in the commercial application of chitin nanofibers from the standpoints of quality stability, high-volume production, and low contamination. These detailed characterizations of chitin nanofibers will hope to play an important role to find out its commercial use.
Chapter 2
Simple Preparation of β-Chitin Nanofibers from Squid Pen
2.1 Introduction
Nature provided a variety of hierarchical structures, such as cellulose, chitin, silk, and keratin, which supported living bodies physically in plants and animals, from immemorial past. Thus, chitin occurs in nature as structural polysaccharide and is present in the exoskeleton of arthropods, in the cuticle of insects and in the cell walls of fungi. Two major naturally occurring chitin crystalline polymorphs are, namely, α-chitin and β-chitin. Most chitins have α-type crystal structure, while the β-type is present in squid pen and tubeworms.11 In α-chitin, the piles of molecular chains are arranged in an antiparallel mode, while that of β-chitins have a parallel chain packing mode.37, 43 Therefore, it was suggested that α-chitin has strong inter- and intra-sheet hydrogen bonding, compared to β-chitin. 44
Nanofibers possesses several amazing characteristics, for instance, a very large surface area to volume ratio, flexibility in surface functionalities, and superior mechanical performance,45 along with the ability to form a highly porous mesh.46 Therefore, nanofibres has been considered as a prime candidate for many significant applications in the area of electro-optical film, nanofiber-reinforced composites, microelectronics, and tissue engineering scaffold.47-50 Hence, the preparation of
nanofibers from various sources and their characterization, have been a matter of interest in recent time.
It was found that β-chitins exhibit higher reactivity in various modification reactions and higher affinity for solvents than α-chitin.51 - 53 Nonetheless, there had been no reports on detail characterization of β-chitin nanofibers. Although, Fan et al.
prepared β-chitin nanofibers by using an ultrasonic homogenizer, the isolated nanofibers could not sustain their natural crystallinity, unexpectedly. 54
Recently, the author successfully prepared α-chitin nanofibers by applying novel HPWJ technology.55 Chitin nanofibers prepared by this system had excellent morphology with fiber thickness of 4 to 6 nm, high crystallinity and mechanical properties.56 The system was beneficial in response to excellent formability, maintaining product quality, and for low contamination. Herein, the author deliberately used the novel HPWJ technology to prepare β-chitin nanofibers from squid pen, under slight acidic condition. Besides, isolated nanofibers characterized in detail relating to their morphology, chemical structure, crystallinity, viscosity, and mechanical properties.
2. 2. Experimental
2. 2. 1. Materials
β-Chitin powder originating from squid pen was kindly provided by Koyo Chemical Co. Ltd. as a commercial product and used without further purification.
2. 2. 2. Preparation of Chitin Nanofibers
β-Chitin nanofibers were prepared according to our previously reported protocol, with slight modification.55 In brief, squid pen chitin powder were dispersed in water at 1 wt. % and a small amount of acetic acid was added to the chitin dispersion to facilitate the nanofibrillation (pH ~ 3). The slurry was stirred for 1 h under vacuum to remove air bubbles. Finally, HPWJ system (Star Burst Mini, HJP-25001S, Sugino Machine Co., Ltd.), equipped with a ball-collision chamber, was employed to achieve successful disintegration. The slurry was ejected from a small nozzle of diameter of 100 μm under high pressure (240 MPa), soon after collided with a ceramic ball with a diameter of 12.7 mm. The slurry was passed through 1, 5, 10, 30, and 50 times mechanical treatments, on a regular basis.
2. 2. 3. Preparation of Chitin Nanofiber Sheets
Nano-fibrillated β-chitin nanofiber slurry was dispersed in distilled water at a fiber content of 0.1 wt. %. The dilute dispersion was vacuum-filtered using a membrane filter. The obtained chitin nanofiber sheets were dried by hot-pressing at 100 oC for 30 min. The dried sheets were cut into 5 cm x 5 cm squares of approximately 45 μm thickness and with an average weight of 11 mg.
2. 2. 4 Characterization
Infrared spectra of the samples were recorded with an FT-IR spectrophotometer (Spectrum 65, Perkin-Elmer Japan Co., Ltd.,) equipped with an ATR attachment.
For field emission scanning electron microscopic (FE-SEM) observation, chitin powder was dried in a vacuum drying oven. The sample was coated with an approximately 2 nm layer of Pt by an ion sputter coater and observed by FE-SEM (JSM-6700F; JEOL, Ltd.) operating at 2.0 kV.
Scanning probe microscopic (SPM) observations were performed with a nanocute model SPM apparatus (Seiko Instruments Inc., Japan). Samples for SPM measurements were prepared by applying one drop of an aqueous chitin dispersion (0.1mg mL-1) on a freshly cleaved mica round disk followed by oven drying.
X-ray diffraction profiles of the nanofibers were obtained with Ni-filtered CuKα from an X-ray generator (Ultima IV, Rigaku) operating at 40 kV and 30 mA. The diffraction profile was detected using X-ray goniometer scanning from 5o to 35o. The crystalline index (CI) was determined by following the equation: CI = (I110 − Iam) × 100/I110, where I110 is the maximum intensity of the [110] plane and Iam is the intensity of the amorphous diffraction at approximately16o.35
The light transmittances of chitin nanofiber dispersions with 0.1 wt. % were measured using a UV-Vis spectrophotometer (V550; JASCO, Tokyo, Japan).
The viscosity of the chitin nanofibers dispersions with 1.0 wt. % was measured using a Brookfield digital viscometer DV-E using spindle no. LV-4 (Brookfield Engineering Laboratories, Middleboro, MA).
The Young’s modulus and tensile strength analysis of sheets were evaluated using a universal testing instrument (AG-X, Shimadzu, Tokyo, Japan) for samples 50 mm long and 10 mm wide. At least five specimens were tested for their nanofiber sheets.
The coefficients of thermal expansion (CTE) of the sheets were measured with a thermomechanical analyzer (Q400, TA Instruments, Newcastle, DE). Specimens were 30 mm long and 3 mm wide, with a 20 mm span. The measurements were carried out from 30 to 165 oC by elevating the temperature at a rate of 5o min-1 in a nitrogen atmosphere in tensile mode under a load of 0.05 N. The CTE values were determined in the second run in order to dry the sample completely in the first run.
3. 3. Results and Discussion
3. 3. 1. Morphological Changes of Chitin Powders
SPM micrographs are depicted in Figure 13 that postulated the deformation of dry chitin powder into nanofibers after successive HPWJ treatments. At 1 pass, aggregate of chitin fibers were observed (Fig. 13(a)). On the other hand, chitin morphology changed drastically, only after 5 passes mechanical treatments of the chitin dispersion (Fig.
13(b)). The thick aggregate of fibrous chitin surprisingly was broken down into
individualized nanofibers with a uniform network. After 5 passes, the fibers width decreased due to further fibrillation of micron-sized fibers (Fig. 13(c)). However, further mechanical treatments, especially after 10 passes, resulted in no significant changes in nannofibers formation. Although the average fibers diameters decreased to some extent, from 5.1 nm at 10 passes to 4.6 nm at 30 passes and 3.8 nm at 50 passes (Table 3). Fan et al. earlier reported the isolation of β-chitin nanofibers with 3-4 nm cross-sectional width.54 The persisting results pointed toward the success of nano-fibrillation by the HPWJ system. Conversely, above 30 passes, the fibers started to break, due to the strong mechanical forces driven by extensive treatments, shortening their lengths. Thus, the nanofibers morphology and the number of passes are closely correlated.
Figure 13. SPM images of β-chitin nanofibers after (a) 1, (b) 5, (c) 10, (d) 30 and (e) 50 passes treatments. The scale bar length is 1μm. Reproduced with permission from ref.
75. Copyright 2013, American Scientific Publishers.
1μm㻌
(b)
㻌
(cc)㻌(e)
㻌
(a)(dd)
Table 3. Width of β-chitin nanofibers.
2. 3. 2. Chemical and Crystalline Structures of Chitin Nanofibers
The FT-IR spectra were used to study the chemical structure of β-chitin nanofibers processed after 1, 5, 10, 30, and 50 passes by the HPWJ system. FT-IR spectra of the isolated nanofibers (data are not shown) were in good agreement with the spectrum of commercial β-chitin, for instance, the OH stretching band at 3431 cm-1, the NH stretching band at 3265 cm-1, the amide I band at 1652 and 1621 cm-1, and the amide II band at 1554 cm-1. This suggested that the chitin nanofibers had the original chemical structures of chitin even though high mechanical forces were applied during the treatments.
Wide-angle X-ray diffraction was used to examine the crystalline structure of the fibrillated nanofibers by the HPWJ system after several passes. The original squid pen and its nanofibers had major diffraction peaks at 2θ = 9o and 20o, which corresponds to the [020] and [110] planes, respectively. The peaks appeared at about the same reflection plane in each sample. Thus, the HPWJ system retains the original crystalline structure of β-chitin. Table 4 shows the degree of relative crystallinity of β-chitin powder and its nanofibers determined from X-ray diffraction profiles. The degree of the
Number of Passes 1 5 10 30 50
Fibers Width (nm) 13.2 6.0 5.1 4.7 3.8
relative crystallinity of the original β-chitin powder was 58.1%. However, there were no significant differences in the relative degree of crystallinity (57.8 - 57.4%), though 1 to 50 passes treatments straightly applied over the dispersions at the time of processing.
This revealed that the crystallinity of chitin nanofibers was apparently independent on the number of mechanical treatments, as no damage of crystalline part occurred, even though a super-high-pressure water jet (240 MPa) was employed by the system. So the challenge of maintaining the natural crystallinity in nanofibers was successful, compared with other report.54
Table 4. Degree of relative crystallinity of β-chitin nanofibers.
2. 3. 3. Transparency and Viscosity of Chitin Nanofiber Dispersions
The regular light transmittances of fibrillated chitin nanofibers slurry with 0.1 wt. % concentration at 400 nm wavelength are shown in Figure 14 graphed against the number of passes. Transparency is strongly associated with the thickness of chitin fibers, especially at shorter wavelength. As can be seen from the figure, squid pen β-chitin dispersed easily in water compared to α-chitin. That is, the suspension became transparent when the individualized nano-sized fibers dispersed in aqueous system.
Different molecular chain packing, 37, 42 weak intermolecular forces, 44 and low degree
Number of Passes Original 1 5 10 30 50
Relative Crystallinity (%) 58.1 57.8 58.0 58.2 57.6 57.4
of crystallinity (Table 4) of β-chitin might be responsible for its dispersion behavior in water. At one pass, the light transmittance of β-chitin slurry was 73.4%. However, the transmittance steeply increased to 83.7%, at 5 passes. Finally, the transparency reached almost at its peak (86.99%) at 10 passes. These results suggested that, up until 10 passes, chitin fibers were fibrillated regularly into thinner nanofibers. Above 10 passes, on the other hand, distinct disintegration was almost impossible on increasing further cycles of treatments. Namely, remarkable fibrillation already accomplished, which lead to saturated transparency. These trends are in decent agreement with the results of SPM.
Figure 14. Regular light transmittances of α-chitin nanofibers (diamond) and β-chitin nanofibers (circle) at 400 nm graphed against the number of passes. Reproduced with permission from ref. 75. Copyright 2013, American Scientific Publishers.
Figure 15 shows the viscosities of the chitin nanofiber slurry with 1.0 wt. %, fibrillated by the HPWJ system graphed against the number of passes. The viscosity of 1 pass β-chitin nanofibers slurry is 1560 cP. Though, the viscosity improved with
0 30 60 90
0 10 20 30 40 50
Transmittance (%)
Number of Passes
increasing the number of passes and reached to 3060 cP at 5 passes. In contrast, above 10 passes, the viscosity did not change cheekily up until 50 passes. Nanofibers morphology is brightly linked to viscosity, which in turns linked to fibers length and thickness. That is, the thinner and longer nanofibers are, and the more frequently they become entangled, which accelerate viscosity. The viscosity data indicated that, at around 5-10 passes, maximum entanglement of nanofibers occurred. Specifically, fibers with maximum length and considerable thickness are available within this part of analysis. Above 10 passes, the fibers length decreased, in addition to diameters, as the fibers started to break, and thereby lowering viscosity. These data are in excellent agreement with those obtained from the SPM images. On the other hand, α-chitin nanofibrs viscosity was superior, due to the greater entanglement of nanofibers.
Therefore, it was believed that the length of α-chitin nanofibrs are greater than that of β-chitin nanofibers, which assessed from the SPM micrographs of both types of chitin nanofibers.
Figure 15. Viscosity of β-chitin nanofibers slurry graphed against the number of passes.
Reproduced with permission from ref. 75. Copyright 2013, American Scientific Publishers.
0 1000 2000 3000 4000
0 10 20 30 40 50
Viscosity (cP)
Number of passes
2. 3. 4. Characterization of Chitin Nanofiber Sheets
Due to nano-size dimensions, chitin nanofibers were dispersed homogeneously in water and this unique property assisted to shape nanofibers into desired sheets by vacuum-filtration. The density of the chitin nanofiber sheets, in Figure 16, graphed against the number of passes. The sheet density of β-chitin nanofiber is 0.89 g cm-3, at 1 pass,jumped to 0.95 g cm-3 at 10 passes. Then again, above 10 passes, the value did not change meaningfully. However, Nanofibers morphology (shown in Fig. 13) and sheet density are correlated. The smaller and shorter β-chitin nanofibers can pack more easily than the α-chitin nanofibers, which result relatively higher sheets densities of β-chitin.
Figure 16. Density of β-chitin nanofiber sheets graphed against the number of passes. Reproduced with permission from ref. 75. Copyright 2013, American Scientific Publishers.
0 0.4 0.8 1.2
0 10 20 30 40 50
Density (gcm-3)
Number of passes
The Young’s moduli and tensile strength of chitin nanofibers sheets are depicted in Figures 17 and 18, respectively, graphed against the number of passes. Young’s moduli of β-chitin nanofiber sheets improved with increasing the number of treatments, and reached to a peak value of 2739.34 MPa at 5 passes than 1655.42 MPa at 1 pass.
Moreover, the value did not change significantly following the further treatments from 10 to 50 passes. A similar trend for α-chitin nanofiber sheets was noted earlier. On the other hand, tensile strength of chitin nanofiber sheets sharply increased from 28.39 MPa at 1 pass to 48.08 MPa at 5 passes. Later on, the values began to decrease abruptly from 10 passes (38.03 MPa) and finally, reached to the lowest value at 50 passes (19.68 MPa).
These data completely deviated from the α-chitin nanofiber sheets. In general, the mechanical properties of nanofiber sheets were found to be related with the aspect ratio (length: width) of fibers. Being, the nanofibers became thinner (Table 3) with the number of passes, the aspect ratio essentially increased up to some extent. That is, the
Figure 17. Young’s moduli of β-chitin nanofibers graphed against the number of passes. Reproduced with permission from ref. 75. Copyright 2013, American Scientific Publishers.
0 1000 2000 3000 4000
0 10 20 30 40 50
Young's modulus (MPa)
Number of passes
longer and thinner nanofibers extended the number of hydrogen bonds between the fibers. In contrast, at higher passes, as mentioned earlier from the SPM images (Fig. 13), the fibers lengths shortened, which of course, dropped the aspect ratio of β-chitin nanofibers. In addition, the relative crystallinity of β-chitin is also low (Table 4). These could affect in a direct deterioration of the tensile property of chitin nanofiber sheets. It is beyond doubt that the mechanical properties are also affected by the sheet density.
Figure 18. Tensile strength of β-chitin nanofibers graphed against the number of passes. Reproduced with permission from ref. 75. Copyright 2013, American Scientific Publishers.
Basically, Young’s modulus and coefficient of thermal expansion (CTE) are anisotropic to each other. Young’s modulus of a chitin nanofiber (not a sheet) estimated to be at least 150 GPa, whereas, its coefficient of thermal expansion (CTE) is very small.36, 37 Table 5 shows the CTE values of β-chitin nanofiber sheets. The CTEs of all chitin nanofiber sheets, prepared from several passes, were less than 10 ppm K-1. So, the
0 20 40 60
0 10 20 30 40 50
Tensile strength (MPa)
Number of passes
CTE did not change significantly after HPWJ treatments. This result also supports upholding of the characteristic extended crystalline structure of chitin nanofibers even after repeated fibrillation treatments.
Table 5. Coefficient of thermal expansion of β-chitin nanofiber sheets
2.4. Conclusion
Dry squid pen powder was transformed into nanofibers successfully by applying the HPWJ system. The morphology, chemical structure, crystallinity, viscosity, mechanical properties and thermal expansion of nanofibers was demonstrated elaborately. SPM images revealed that chitin nanofibers fibrillated to thinner fibers uniformly up to 10 passes. Light transmittances and viscosity of chitin nanofibers slurry also supported the SEM observations. Nanofibers with mean cross-sectional width of 3-4 nm were possible to isolate, although extensive cycles of treatment reduced the fibers lengths. The original β-chitin structure was maintained by the HPWJ system, in addition to the notable crystallinity of chitin nanofibers. The mechanical properties were improved by nano-fibrillation up to a particular range of treatments.
These detailed characterizations are expected to play a vital role in developing commercial applications for the β-chitin nanofibers.
Number of Passes 1 5 10 30 50
Thermal expansion (ppm K-1) 9.17 8.06 8.65 7.87 9.48
Chapter 3
Novel Preparation of Chitin Nanocrystals by H
2SO
4and H
3PO
4Hydrolysis
3.1. Introduction
Whiskers are very promising reinforcing materials for composites, owing to their high stiffness and strength.57 These whiskers are almost free from defect and as a result, their properties are comparable to perfect crystals.21 Inorganic nanofillers are mostly used to prepare nanocomposites with polymer matrices, although their processability, biocompatibility, and biodegradability are much more limited than those of naturally organic ones. However, increasing environmental awareness reflects the importance of using renewable raw materials for sustainable development. Polysaccharides are such natural gift with renewable, semi-crystalline properties to use as ideal nanofillers.
Chitin has been known to form microfibrillar arrangements, where the fibrils are tightly bound to each other through a large number of hydrogen bonds. These fibrils are typically embedded in a protein matrix and their diameters ranges from 2.5 to 2.8 nm depending on their biological origin.58 Chitin microfibrils are consisted of alternative amorphous and crystalline domain. When chitin is subjected to strong acid treatment, disordered and low lateral ordered regions are hydrolyzed and dissolved, indicating water-insoluble, highly crystalline residues remain intact that have a higher resistance to
acid attack. These highly ordered nanocrystals have potentials to be used as highly functional materials.
Meanwhile, several groups isolated chitin nanocrystals (CNCs) from many chitins of different origins, such as squid pen59, Riftia tubes60, crab shells 58, 61 - 65, and shrimp shells 58, 66 - 71, using conventional hydrolysis in HCl solution (H-CNC). The final step of almost all types of nanocrystals preparation involved ultrasonic homogenization. The isolated nanocrystals had multiple aspect ratio and were studied as nanocomposite materials for reinforcement, as nanoscaffold in tissue engineering, and for other applications.59 - 64, 71 - 73 Basically, the incorporation of CNCs to polymer matrices improved the thermomechanical properties of nanocomposites up to a certain extent. It is worth noting that the thermochemical behavior significantly depended on the crystalline nature of the CNCs, although most of the authors had no specific report on it. In addition, Sriupayo et al. reported that nanocomposites suffered thermal instability upon heat treatment.68 Recently, Espinosa et al. isolated thermally stable cellulose nanocrystals by surface functionalization, through phosphoric acid hydrolysis, while the prepared nanocomposite remained transparent up to 180 oC.74
In recent years, the author successfully prepared nanofibers from commercially available crab shell and squid pen chitin, respectively, using a novel high pressure water jet (HPWJ) system.55, 75 This HPWJ treatment was advantageous over conventional technology in its atomization efficiency for preparing some bionanomaterials. In this study, the author made an attempt to prepare CNCs after hydrolyzing chitin powder through relatively stronger acids like H2SO4 (S-CNC) and H3PO4 (P-CNC), for the first