B10
A Reservoir Operation Scheme for Integrated Water Resource Modelling
〇Maochuan HU, KenjiTANAKA, Takahiro SAYAMA, Shigenobu TANAKA
There are more than 2700 dams in Japan with the purpose of flood control, power generation, irrigation water and industrial water, etc. Dam operation has considerable potential impact on water cycle. This study developed a reservoir operation scheme for integrated water resources modelling. An operation rule was developed for each reservoir based on effective reservoir capacity, purposes, dam inflow, seasons, and water demand in the downstream. Taking Nagano and Gifuprefectures as case study, 12 dams with storage capacity more than 10 million cubic meters were selected. To date, the validation by comparing simulated dam outflow and observations indicated 10 of dams had the value of NSE > 0.5. In the near future, this scheme was validated by changes in the performance of an integrated water resource model with this scheme or not in the Kisogawa River Basin. Then, future changesin water resources and river discharge under climate changewill be predicted by using the integrated water resources model with reservoir operation schemein the Kisogawa River Basin.
Keywords: Dams, water resource model, hydrology, irrigation
1. Introduction
In Japan, more than 2700 dam reservoirs have beenconstructed for various purposes such as power generation, disaster management, irrigation waterand industrial water, etc.Water regulation by dam operations has considerable effects on natural water cycle. For example, storing water in rainy season and releasing in dry season may decrease base flow of downstream in rainy season and increase it in dry season. It is necessary to consider dam reservoir operations in water resource modelling. The problem is how to incorporate reservoir operations into water resource models. This study developed a new algorithm for simulating individual dam operation in a water resource model.
2. Methods
2.1 Reservoir operation scheme
According to the requirements of the water resource model development by our research group, the dams were divided into two categories based on intended purposes. First category is the dams for irrigation water or disaster management (drought and flood).
Second is the ones without the purposes of irrigation water and disaster management. For the second one, the dam outflow was set same as inflow. For the first category, the operation rules were shown in Fig.1The dam capacity was divided into three levels, minimum capacity (Vmin), normal top capacity (Vuc, the values in rainy and dry season would be different) and effective top maximum (Vmax). The algorithm is: 𝑄 = 0 𝑖𝑓 𝑉 ≤ 𝑉𝑚𝑖𝑛 Q = {𝑄𝑤𝑒𝑡 𝑖𝑓 𝑉𝑚𝑖𝑛 < 𝑉 ≤ 𝑉𝑢𝑐 𝑖𝑛 𝑟𝑎𝑖𝑛𝑦 𝑠𝑒𝑎𝑠𝑜𝑛𝑄𝑑𝑟𝑦 𝑖𝑓 𝑉𝑚𝑖𝑛 < 𝑉 ≤ 𝑉𝑢𝑐 𝑖𝑛 𝑑𝑟𝑦 𝑠𝑒𝑎𝑠𝑜𝑛 𝑄 = 𝑘 × (𝑉 − 𝑉𝑢𝑐 𝑉𝑚𝑎𝑥 ∗ 𝑟) 𝑝 𝑖𝑓 𝑉𝑢𝑐 < 𝑉 < 𝑉𝑚𝑎𝑥 𝑄 = 𝑖𝑛𝑓𝑙𝑜𝑤 𝑖𝑓 𝑉 ≥ 𝑉𝑚𝑎𝑥
whereQwet and Qdry are certain percentiles of daily inflow; k, r and p are coefficients. If outflow (Q) less than downstream water demand (Qdemand) multiplied by the coefficient of a, then Q = a*Qdemand.
The value of each parameterwasevaluated by sensitivity test. The Qwet and Qdry were 85% and 45% percentile of inflow. The values of k, r, p were 0.8, 0.02 and 0.35 respectively.
Figure 1Schematic diagram of dam operation
2.2 Case study
The integrated water resource model was applied in Nagano and Gifu prefectures to validate the model performance and evaluate the effects of climate change on water resource and river discharge. First, 12 dams with storage capacity more than 10 million cubic meterslocated at Nagano and Gifu prefectures (shown in Table 1) were selected to validate the performance of developed operation scheme. Using observationsof dam inflow as input, the performance in terms of Nash-Sutcliffe Efficiency (NSE) was estimated by comparing the simulated and observed outflow. Then, the performances of integrated water resource model with the reservoir operation scheme or not were evaluated by comparing simulated and observed river discharge at several stations located at the downstream of dams in the Kisogawa River Basin. The index of Root Mean Square Error (RMSE) andNSE were used.There are 7 of 12 dams in the Kisogawa River Basin. Finally, the water resource model including reservoir operation scheme was used to predict the future changes in water resources and river discharge in the Kisogawa River Basin.
3. Results and Future
The results of validation on 12 dams were shown in Table 1. For the dams with the ratio of effective top capacity and annual mean total inflow less than 0.2, the performances were better than the ones with the value more than 0.2. The values of NSE were more
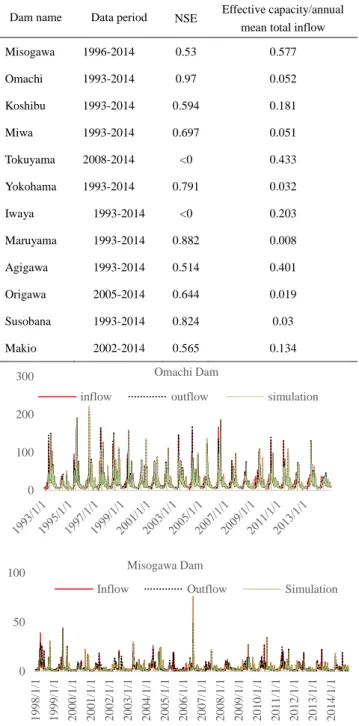
than 0.5 in 10 of 12 dams. This scheme cannot present the outflows in Iwaya dam and Tokuyama dam. The reason requires more study in depth. The inflow, simulated outflow and observed outflow at the dams of Misogawaand Omachi were indicated in Fig.3. To date, the results on the application of water resource model in the Kisogawa basinand water resource prediction are not completed, which will present in the future.
Table 1Validation results on the dams with capacity more than 106 m3
Dam name Data period NSE Effective capacity/annual mean total inflow Misogawa 1996-2014 0.53 0.577 Omachi 1993-2014 0.97 0.052 Koshibu 1993-2014 0.594 0.181 Miwa 1993-2014 0.697 0.051 Tokuyama 2008-2014 <0 0.433 Yokohama 1993-2014 0.791 0.032 Iwaya 1993-2014 <0 0.203 Maruyama 1993-2014 0.882 0.008 Agigawa 1993-2014 0.514 0.401 Origawa 2005-2014 0.644 0.019 Susobana 1993-2014 0.824 0.03 Makio 2002-2014 0.565 0.134
Figure 2 Inflow, outflow and simulations at Misogawa and Omachi dams Initial Water capacity (V) V <= Vmin (minimum capacity) Yes Q = 0 (outflow) No Vmin < V <=Vuc (normal top capacity) Vuc < V <= Vmax (effective max capacity) No V > Vmax Q = Dam inflow Yes Q = k*((V -Vuc)/ (Vmax*r))**p (parameters of k,p,r) Wet season Yes Q = Qwet (constant outflow in wet season) No Q = Qdry (constant outflow in dry season) Q = max (Q, a*Qdemand) (water demand in dam downstream and parameter)
0 100 200
300 Omachi Dam
inflow outflow simulation
0 50 100 1 9 9 8 /1 /1 1 9 9 9 /1 /1 2 0 0 0 /1 /1 2 0 0 1 /1 /1 2 0 0 2 /1 /1 2 0 0 3 /1 /1 2 0 0 4 /1 /1 2 0 0 5 /1 /1 2 0 0 6 /1 /1 2 0 0 7 /1 /1 2 0 0 8 /1 /1 2 0 0 9 /1 /1 2 0 1 0 /1 /1 2 0 1 1 /1 /1 2 0 1 2 /1 /1 2 0 1 3 /1 /1 2 0 1 4 /1 /1 Misogawa Dam