Evolutionary Power Modeling for Energy Efficiency in CPU-GPU based systems
7
0
0
全文
(2) IPSJ SIG Technical Report. metaheuristics, as high level procedures, help to find good enough solutions for modeling heterogeneous, scalable and distributed systems based on fragmentary information and making few assumptions about the problem [2]. Feature Engineering (FE) methods are used to select adequate features, avoiding the inclusion of irrelevant parameters that reduce generality [3]. FE properties help, not only to find relevant variables, but their combinations and correlations, offering a straightforward problem formulation thus generating better solutions. GE is particularly useful to solve optimization problems and build accurate models of complex systems. This technique provides solutions that include non-linear terms while still offering FE capabilities, thus bypassing the barrier of analytical modeling. Also, as GE is an automatic technique, little designer’s expertise is required to process high volumes of data. We propose a GE-based approach to find optimized power models that accurately describe and estimate the consumption of high-end Cloud servers. We provide a general methodology that can be applied to a broad set of server architectures and working conditions. Our work makes the following key contributions: • In this paper we provide a methodology for the automatic generation of fast and accurate power models to describe the performance of supercomputers based on CPU-GPU systems. • We provide a method for data acquisition for metrics from the whole system as well as specific parameters from both CPU and GPU devices during runtime. In this work, we also propose an interpolation-based technique to align the different metrics that may be collected asynchronously from the system. • Our proposed modeling technique is able to include combinations and correlations of variables due to FE and SR performed by GE. Therefore, the power models incorporate the automatic selection of representative features that best describe power performance. The remainder of this paper is organized as follows: Section 2 gives further information on the related work on this topic. Section 3 presents the different phases of our modeling methodology in terms of data acquisition, data alignment, feature selection and model generation. In Section 4, we present a case of use for the TSUBAME-KFC supercomputer. Finally, in Section 5 the main conclusions are drawn.. 2.. Related Work. The current state-of-the-art offers different analytical power models to describe the performance of CPU-based high-end servers. Some research as the work presented by Pelley et al. [4] focus on the development of linear regression models, thus power consumption is presented as a linear function of the CPU usage. Other modeling strategies [5] formulate server power as a quadratic function of the CPU usage. However, these techniques do not consider correlations between the different variables to derive the analytical model. The approach presented by Bohra et al. [6] is based on a robust fitting technique to determine the power model, taking. c 2017 Information Processing Society of Japan. Vol.2017-HPC-158 No.2 2017/3/8. also into account the correlation between the total system power consumption and the utilization of the different resources. Our work follows a similar approach but it also incorporates the contribution of the static power consumption, and the effect of applying DVFS techniques. Currently, many research works also focus on modeling the power consumption of GPUs. Research by Nagasaka et al. [7] and Lim et al. [8] analyze the correlation of GPU’s performance counters on the energy consumed by CUDA applications. On the other hand, Ge et al. [9] studies the effects of frequency management on GPU’s energy efficiency. However, this research works only take into account the energy consumption of entire applications, not considering power variations during runtime. Moreover, linearity or input parameter limitations are barriers associated to classical modeling. The fast generation of accurate power models for high-end servers is a complex challenge that designers have not yet fulfilled by analytical approaches. Research by Song et al. [10] provides an instantaneous evaluation of power during runtime for the GPU device using Machine Learning techniques. Our methodology presented in this paper, based on evolutionary computation, follows a similar approach, but also considers the power consumption of the entire node based on CPU-GPU devices. Moreover, our work also provides an automatic feature selection to select those metrics that have a higher impact on power consumption. In our previous work we have used a Particle Swarm Optimization algorithm (PSO) metaheuristic to identify analytical models, providing accurate power estimations [11]. PSO help to simplify the resultant power model by reducing the number of predefined parameters, variables and constants used in our analytical formulation. However, this technique is a parameter identification mechanism, so it does not provide the features that best represent the system power consumption. Some other features could be incorporated to enhance the power estimation. Also, in recent work, we apply an evolutionary algorithm combined with a classical regression to enforce linearity, convexity and differentiability properties to complex system models [12]. This technique achieve very good accuracy results, but limits the degrees of freedom penalizing accuracy against output linearity properties. A Grammatical Evolution based modeling technique has been also proposed by J.C. Salinas-Hilburg [13] to model specific contributions to power for CPU and memory devices for HPC workloads. However, to the best of our knowledge, this approach has not been yet used to model the power consumption of the whole server and also for systems that incorporates GPU devices. The work presented in this paper aims to outperform previous approaches in the area of power modeling for CPU-GPU systems in several aspects. Our approach proposes an automatic method for the identification of accurate instantaneous power models particularized for each target architecture. We propose an extensive modeling methodology consistent with current architectures. Also, our procedure takes into account the main sources of power consumption to obtain a multiparametric model, allowing the development of novel power optimization approaches. Different parameters are combined by our 2.
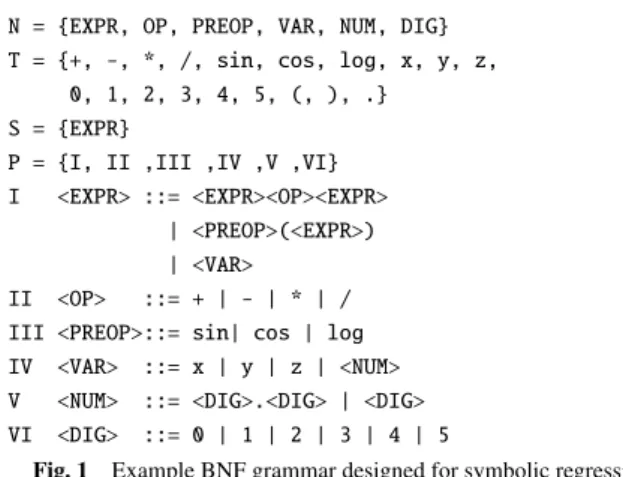
(3) Vol.2017-HPC-158 No.2 2017/3/8. IPSJ SIG Technical Report. evolutionary technique, thus enhancing the generation of an optimized set of features. Our methodology allows to obtain models that describe the power performance during runtime, for workloads that are subject to vary significantly.. 3.. Modeling Methodology. Our proposed modeling methodology consists of 4 different stages: (i) data acquisition, (ii) data alignment, (iii) feature extraction and (iv) model generation. In this section we provide further details of our methodology for modeling CPU-GPU systems. 3.1 Data Acquisition In order to obtain a complete data set that allows us to accurately model a CPU-GPU heterogeneous system we propose monitoring various metrics. For CPU and GPU devices we profile the following parameters during runtime: • Power consumption: Real power measurements help us to train the models and provide the accuracy of our power estimations. • Temperature: These metrics offer the thermal profile during runtime and help to infer potential power leakage sources correlated to temperature. The tradeoffs between temperature and power provide information for future cooling-computing joint power optimizations. • Frequency: Describing the correlations between device pstates and power consumption may lead to potential optimizations based on Dynamic Voltage and Frequency Scaling (DVFS). • Performance counters: They provide representative information for applications of different nature in terms of computing requirements. Then, we propose monitoring the power consumption and temperature of the entire computing infrastructure in order to obtain a global model for the heterogeneous system. 3.2 Data Alignment The operating system, the available sensors and the software tools, among others, limit the parameters that may be collected from the physical system. Moreover, the sampling rate for each metric will be also affected by these restrictions, and even there may exist parameters that can not be collected periodically, but in an asynchronous way. Additionally, some of the collected values may be corrupted during data acquisition, thus resulting on incomplete data sets. For these situations, in which multisensor sampling is not accurately synchronized, we propose the use of temporal interpolation to perform data alignment among the collected metrics. In the following subsections we provide further information of our automatic evolutionary-based modeling technique in terms of feature extraction and model generation. In our work, we propose an evolutionary technique that covers these both phases of our methodology. 3.3 Feature Extraction Supercomputers, as complex systems, can be defined as. c 2017 Information Processing Society of Japan. systems of interconnected agents (e.g. CPUs, GPUs, memory devices) that exhibit a global behavior resulting from the interaction of these agents [14]. So, inferring the global performance is a complex and time-consuming challenge that requires a deep knowledge of the operation and the physical phenomena. Therefore, fast and automatic modeling techniques are required, and that are more suitable for systems that have a huge amount of parameters. Our research focuses on obtaining a mathematical expression that represents power consumption. In this work, the power formulation is derived from experimental data collected in a real infrastructure. Our data set compiles values of the different variables that have been considered such as powers, temperatures, frequencies, pstates and performance counters. In this context, we consider the selection of the relevant features that will take part of our model as a Symbolic Regression (SR) problem. SR helps to simultaneously obtain a mathematical expression and include the relevant features to reproduce a set of discrete data. Genetic Programming (GP) has proven to be effective in solving a number of SR problems [15], but it presents some limitations like the excessive growth of memory computer structures, often produced in the phenotype of the individual. In the last years, Grammatical Evolution (GE) has appeared as a simpler optimization variant of GP [16]. GE allows the generation of mathematical models applying SR, where the model generation is achieved thanks to the use of grammars that define the rules for obtaining mathematical expressions. 3.4 Model Generation In this work we will use GE using grammars expressed in Backus Naur Form (BNF) [16] as this representation has been satisfactorily used by the authors to solve similar problems when combined with regressive techniques [12]. A BNF specification is a set of derivation rules, expressed in the form: <symbol>::=<expression>. (1). BNF rules are represented as sequences of Non-terminal (N) and Terminal (T) symbols. The former symbols use to appear on the left side of the equation, but they may appear also on the right, while the later are shown on the right side. In Equation 1, we can affirm that <symbol> and <expression> are non-terminals, although these do not represent a complete BNF specification, since those are always enclosed between the pair < >. This equation represents that the non-terminal <symbol> will be replaced (indicated ::=) by an expression. The rest of the grammar may define the set of different alternatives for the expression. A grammar is defined by the 4-tuple N, T, P, S , being N the set of non-terminals, T the set of terminals, P the production rules for the replacement of elements between N and T , and S the start symbol that should appear in N. The symbol “|” separates the different options within a production rule. Figure 1 shows an example of a BNF grammar, designed for symbolic regression. The final expression resulting from the GE execution will only consist of terminals of the T set. Non-terminals will be translated to terminal options by using the production rules in set P. Grammars can be adapted to bias the 3.
(4) IPSJ SIG Technical Report. N = {EXPR, T = {+, -, 0, 1, S = {EXPR} P = {I, II I <EXPR>. OP, PREOP, VAR, NUM, DIG} *, /, sin, cos, log, x, y, z, 2, 3, 4, 5, (, ), .}. ,III ,IV ,V ,VI} ::= <EXPR><OP><EXPR> | <PREOP>(<EXPR>) | <VAR> II <OP> ::= + | - | * | / III <PREOP>::= sin| cos | log IV <VAR> ::= x | y | z | <NUM> V <NUM> ::= <DIG>.<DIG> | <DIG> VI <DIG> ::= 0 | 1 | 2 | 3 | 4 | 5 Fig. 1 Example BNF grammar designed for symbolic regression. search of the relevant features because of the finite number of options in each production rule. In this work, our variables set <VAR> consists of the different parameters defined in subsection 3.1, which are potential contributors to the server power consumption. Our set of terminals consist of these variables, the operators +, −, ∗ and /, the preoperators exp, sin, cos and ln, and base-10 exponent format constants. Finally, they will be combined in a final expression describing power consumption. GE works like a classic Genetic Algorithm (GA) [17] in terms of structure and internal operators. Each individual is defined by a chromosome and a fitness value. Each chromosome consists of a specific number of genes, also called codons. Then, the population formed by a set of individuals is evolved by the algorithm. The fitness function is commonly a regression metric, as a Mean Squared Error (MSE), a Root Mean Square Deviation (RMSD) or a Coefficient of Variation (CV), and the chromosome consists of a string of integers. The GA operators are applied iteratively in order to improve the fitness function during the algorithm execution. These operators are the selection of the population, the crossover process, which combines the chromosomes, and the mutation of the resulting individuals, which occurs with a certain probability defined as mutation probability. Then, in the decoding stage, the GE algorithm computes the fitness function for each iteration, extracting the expression defined in each individual. Through the following example, we explain the GE decoding process to clearly explain how this unsupervised algorithm selects the features. In this example, we decode the following 7-gene chromosome using the BNF grammar shown in Figure 1. 21-64-17-62-38-254-2 First, we begin to decode the expression using the Start symbol S={EXPR} defined by the grammar in Figure 1. Solution = <EXPR> Then, we decode the first gene of the chromosome, 21, in rule I of the grammar. This rule has 3 different choices: (i) <EXPR><OP><EXPR>, (ii) <PREOP><EXPR> and (iii) <VAR>. Hence, the modulus operator is applied as a mapping function: 21 MOD 3 = 0 As result of the mapping function, the first option <EXPR><OP><EXPR> is selected, so this expression is used to substitute the non-terminal. The current expression after this. c 2017 Information Processing Society of Japan. Vol.2017-HPC-158 No.2 2017/3/8. decoding step is the following: Solution = <EXPR><OP><EXPR> The process continues with the substitution of the first non-terminal of the current expression <EXPR>, using the next codon, 64. The modulus is applied again to rule I. 64 MOD 3 = 1 In this case, the algorithm selects the second option offered by the grammar for this rule, <PREOP>(<EXPR>). The current expression is the following: Solution = <PREOPR>(<EXPR>)<OP><EXPR> The GE takes the next gene, 17, for decoding. At this point, <PREOP> is the first non-terminal in the current expression. Therefore, we apply the modulus operator to rule III to choose 1 of the 3 different choices. 17 MOD 3 = 2 So, the third option log is selected. The output of the decoding process at this point results in the expression: Solution = log(<EXPR>)<OP><EXPR> The following codon, 62, decodes <EXPR> using rule I. 62 MOD 3 = 2 Value 2 means to select <VAR>, the third option, resulting in the expression: Solution = log(<VAR>)<OP><EXPR> Next codon, 38, uses rule IV to decode <VAR>. 38 MOD 4 = 2 Non-terminal z is selected as the mapping function output means the third option. Solution = log(z)<OP><EXPR> Codon 254 decodes the Non-terminal <OP> with rule II: 254 MOD 4 = 2 This value means the third option, terminal *: Solution = log(z)*<EXPR> The last codon of the chromosome in this example, decodes <EXPR> with rule I: 2 MOD 3 = 2 The third option is selected so, the expression is substituted by the non-terminal <VAR>. In this step, the current expression is the following: Solution = log(z)*<VAR> At this point, GE algorithm has run out of codons. However, the decoding process has not obtained an expression with Terminals in each of its components. GE, solves this problem by reusing codons, starting from the first one in the chromosome, and during the decoding process, it is possible to reuse the codons more than once. This technique is known as wrapping, and it is inspired in the gene-overlapping phenomenon present in many organisms [18]. By applying wrapping to our example, the GE reuses the first gene, 21, which decodes <VAR> with rule IV. 21 MOD 4 = 1 The result of the mapping function selects the second option, non-terminal y, giving the final expression of the phenotype: Solution = log(z)*y As can be seen in this example, this process performs parameter identification like in classic regression methods. Moreover, when used together with an appropriate fitness function, GE is also able to infer the optimal set of features that best describes 4.
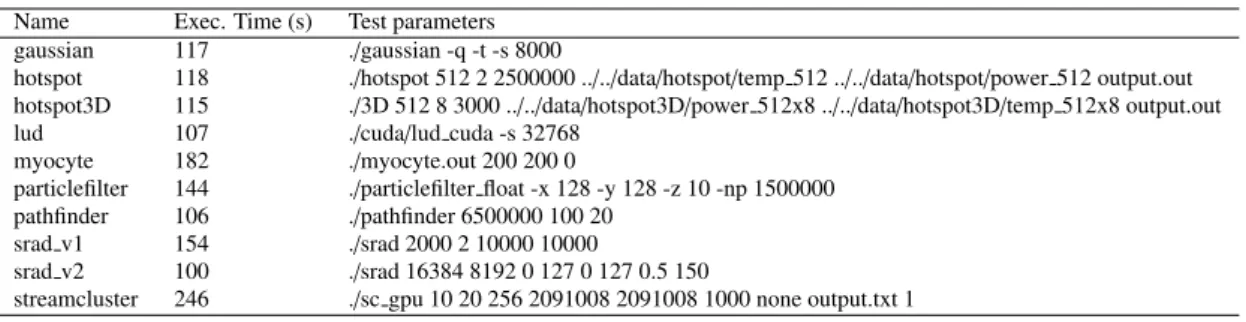
(5) IPSJ SIG Technical Report. the target system. So, the evolutionary algorithm computes the mathematical expression, performing both model identification and feature selection, being able to result into the most accurate power model.. 4.. Methodology Application: TSUBAME-KFC Case of Use. In this section we describe a particular case study for the application of the devised methodology presented in Section 3. The problem to be solved is the fast and accurate estimation of the power consumption in a heterogeneous CPU-GPU node performing HPC applications. This section presents ongoing work, so we provide the methods, the algorithms and partial results that help to understand our modeling approach. 4.1 Hardware Monitoring Setup Data have been collected gathering real measures from a node of TSUBAME-KFC. This supercomputer is a state-of-the-art prototype for the next-generation TSUBAME3.0, and achieved world No.1 on the Green500 in November 2013 and June 2014 [19]. Each of the nodes in TSUBAME-KFC consists of 2 CPUs and 4 GPUs in a dense 1U form factor. The CPUs are based on an Intel Xeon E5-2620 v2 (IvyBridge) with 6 cores 2.1GHz and two hardware threads per core. GPUs are NVIDIA Tesla K80. The system has a DDR3 memory of 64GB, 4 FDR InfiniBand HCA, and is running on a 64bit CentOS 7.0 Linux OS. The nodes provide GCC Intel compiler 4.8.5 and CUDA 8.0. 4.1.1 CPU Subsystems We monitor power per CPU package and per DRAM controller per second, using the Intel’s Running Average Power Limit (RAPL) interface. We use the Performance API (PAPI) RAPL component to collect these values from the interface. Temperature per CPU core is monitored via lm-sensors per second. Frequency is sampled per second and per hardware thread using Linux cpuinfo. Performance counters are collected also via PAPI using a modified version of the papiex tool *1 to provide performance counters per second. This tool allows us to monitor hardware counters during the application execution without the necessity of instrumenting its code. 4.1.2 GPU Subsystems The NVIDIA System Management Interface (nvidia-smi) is used to monitor power, temperature and frequency per GPU device and per second. This command line utility is provided for monitoring NVIDIA GPU devices, and is based on top of the NVIDIA Management Library (NVML). Collecting the performance counters periodically during runtime for GPU devices is not provided by current toolkits. This is not a trivial task, as GPU context may be retained during the execution of application kernels so it can not be done using an external tool. On the other hand, the nvprof profiling tool provided by NVIDIA, is used to collect and view profiling data from the command-line. When used together with the option –print-gpu-trace, this tool provides the values of the *1. http://icl.cs.utk.edu/ mucci/papiex/. c 2017 Information Processing Society of Japan. Vol.2017-HPC-158 No.2 2017/3/8. performance counters, asynchronously, after kernel executions. So, for those applications based on the execution of multiple kernels, this tool allows us to collect the performance metrics during application runtime, on an asynchronous way, without instrumenting the code. However, the temporal granularity would be imposed by kernels’ duration. For single kernel applications or those applications whose kernel durations make it unfeasible to obtain samples with enough granularity, code modifications should be implemented. Additionally, we plan to use the NVIDIA CUDA Profiling Tools Interface (CUPTI) to provide periodic profiling for performance counters. To implement this solution, it is necessary to instrument the sources of our proposed applications in order to preserve the context during kernel executions. 4.1.3 CPU-GPU System The overall power of the compute node is measured per second using Panasonic AKL 1000 Data Logger and Panasonic KW2G Eco-Power Meter. This monitoring infrastructure also allows us to profile the power consumption of the network and the cooling infrastructure for the entire TSUBAME-KFC system. Further details about these data profiling can be found in the research provided by Endo et al. [19]. 4.2 Experimental Workload We present an experimental scenario using various workloads with the purpose of building and validating our modeling approach. We define a set of different workload profiles that represent different computing patterns found in typical HPC infrastructures. For performance evaluation, we use CUDA and OpenMP applications from the Rodinia benchmark suite [20]. These applications allows to stress both CPU and GPU devices, also covering a wide range of computation patterns in heterogeneous computing. We have modified their input arguments to increase their runtime in order to collect more samples during their execution. Table 1 shows the profiled applications, their input parameters and their execution time for the CUDA implementation. We find different power profiles for the different benchmarks proposed in this work with a periodic resolution of one second. Applications as hotspot, gaussian, lud, myocyte, srad v1 and particlefilter show a uniform power profile during application execution. On the other hand, srad v2, streamcluster, hotspot3D and pathfinder present a highly variable power profile. This kind of applications represent a challenge on power modeling during runtime, as power variability may be predicted. Figure 2 presents the different profiles found for the selected applications for the CUDA Rodinia benchmark. For both applications, kernel executions are evenly distributed during the application runtime, alternated with memory operations. These benchmarks only run on one GPU and do not use any dual-precision logic. Additionally, NVIDIA Tesla K80 is a dual-GPU card, and to meet the PCI-E power specifications, its clock is slowered down. For these reasons, the power consumption during the execution of the applications shown in Figure 2 is lower than the Thermal Design Power (TDP). 5.
(6) Vol.2017-HPC-158 No.2 2017/3/8. IPSJ SIG Technical Report. Table 1 Execution time and test parameters for the Rodinia CUDA applications. Name gaussian hotspot hotspot3D lud myocyte particlefilter pathfinder srad v1 srad v2 streamcluster. Exec. Time (s) 117 118 115 107 182 144 106 154 100 246. Test parameters ./gaussian -q -t -s 8000 ./hotspot 512 2 2500000 ../../data/hotspot/temp 512 ../../data/hotspot/power 512 output.out ./3D 512 8 3000 ../../data/hotspot3D/power 512x8 ../../data/hotspot3D/temp 512x8 output.out ./cuda/lud cuda -s 32768 ./myocyte.out 200 200 0 ./particlefilter float -x 128 -y 128 -z 10 -np 1500000 ./pathfinder 6500000 100 20 ./srad 2000 2 10000 10000 ./srad 16384 8192 0 127 0 127 0.5 150 ./sc gpu 10 20 256 2091008 2091008 1000 none output.txt 1. inst_executed. 9. a) myocyte. 2.6. Number of instructions. 80 Power (W). 75 70 65 60. x 10. inst_executed spline interpolation. 2.4 2.2 2 1.8 1.6 1.4 1.2. 55 0. 50. 100 Time (s) b) streamcluster. 20. 40. 70 65 60 200. Number of instructions. Power (W). 75. 100 150 Time (s). 100. inst_executed. 9. x 10. 50. 80. Fig. 3 Spline interpolation applied to inst executed for lud application.. 80. 55 0. 60. Time (s). 150. inst_executed spline interpolation. 2.52 2.5 2.48 2.46 2.44 4. 4.5. 5. 5.5. 6. 6.5. 7. 7.5. Time (s) Fig. 2 Rodinia CUDA applications with heterogeneous power profiles.. Fig. 4 Zoom in of the spline interpolation applied to inst executed for lud application.. 4.3 Data alignment For data alignment we provide our multiparametric profiling data sets with Linux epoch traces. However, in the case of using nvprof for collecting GPU counters, our measurements are provided asynchronously, once each kernel finishes. Thus, in order to perform data alignment, we propose the use of MATLAB spline cubic interpolation function. Figure 3 shows spline interpolation applied to the inst executed metric collected during the execution of the lud Rodinia test configured as in Table 1. Figure 4 provides a zoom in, so the interpolated values can be appreciated.. First, the CUDA and OpenMP versions of the Rodinia benchmarks are executed independently in order to train and validate both models. We split the benchmarks into a training and a validation data set so we use different applications for both phases. For the training data set, the GE algorithm automatically selects those parameters that best describe the instantaneous power consumption and provide the final expression. In this work, our fitness function is an error metric between our model estimation and the real power measurement. We plan to use RMSD, but we are evaluating other alternatives to enhance the GE modeling process. After this subsystem modeling stage, we model the instantaneous power consumption for the entire TSUBAME-KFC node. We enforce the GE to incorporate the expressions of our subsystems models as features together with the other collected metrics. In this phase, we simultaneously stress both CPU and GPU subsystems using the Rodinia benchmarks, so the GE is able to incorporate those features that describe this behavior. For this purpose, we also plan to increase the number of applications incorporating more complex CPU-GPU offloading schemes.. 4.4 Feature Selection and Power modeling As stated in the previous Subsection 4.1, TSUBAME-KFC nodes provide power measurements for both CPU and GPU devices. So, we propose to model these devices independently in order to provide more accurate power distributions. Then, the model for the entire system would include both CPU and GPU submodels as well as other metrics considered by our modeling algorithm. This approach helps to infer a complex numerical model that has a high number of input metrics.. c 2017 Information Processing Society of Japan. 6.
(7) Vol.2017-HPC-158 No.2 2017/3/8. IPSJ SIG Technical Report. Taking into account the number of inputs and the amount of collected data, and based on our previous experience, we expect GE to provide an accurate model in no more than 150 hours. We also expect to obtain an average error below 10 watts between our model estimations and the real measurements.. 5.. Conclusions and Future Directions. The contribution of supercomputers to the global consumption is increasing dramatically, so placing them on a more scalable curve is a major challenge that has to be faced by service providers. The design of novel proactive energy-efficient policies requires a reliable prediction of their effect in terms of power. As complex systems scenarios, one of the biggest barriers is to find the relationships between the huge amount of potentially correlated variables. This problem complicates the design of general power models from a macroscopic analytical perspective. Therefore, a fast and accurate method is required to achieve overall power consumption prediction. The work presented in this paper makes contributions on the accurate power modeling of CPU-GPU based supercomputers. Our Gramatical Evolutionary (GE) based automatic approach does not require designer’s expertise to describe the complex relationships between parameters and power consumption sources. This algorithm performs Feature Engineering (FE) and Symbolic Regression (SR) that help to infer accurate models by incorporating only those features that best describe the power consumption. Our methodology can be considered as a starting point for implementing novel efficient policies for CPU-GPU heterogeneous supercomputers. The resulting power models could help to derive innovative energy optimization strategies that combine management approaches that consider the joint effect of different features. For future research we plan to apply and validate the present methodology using real HPC applications during runtime. We also propose the usage of the resulting models to use the tradeoffs between performance and energy efficiency in order to perform an optimal offloading of workload to the GPUs. Finally, we propose to complement these models with a thermal model to simultaneously optimize both computing and cooling resources. Acknowledgments The stay of Patricia Arroba in the Tokyo Institute of Technology has been supported by the Erasmus Mundus EASED (Euro-Asian Sustainable Energy Development) programme (Grant 2012-5538/004-001) coordinated by CentraleSuplec. References [1] [2]. [3] [4]. TOP500.org: The Green500 list, https://www.top500.org/green500/lists/2016/11/ (2016). ”Online; accessed 5-February-2017”. Bianchi, L., Dorigo, M., Gambardella, L. M. and Gutjahr, W. J.: A Survey on Metaheuristics for Stochastic Combinatorial Optimization, Natural Computing: An international journal, Vol. 8, No. 2, pp. 239– 287 (online), DOI: 10.1007/s11047-008-9098-4 (2009). Turner, C. R., Fuggetta, A., Lavazza, L. and Wolf, A. L.: A conceptual basis for feature engineering, Journal of Systems and Software, Vol. 49, No. 1, pp. 3 – 15 (1999). Pelley, S., Meisner, D., Wenisch, T. F. and VanGilder, J. W.: Understanding and Abstracting Total Data Center Power, Proc. of the. c 2017 Information Processing Society of Japan. [5]. [6]. [7]. [8]. [9]. [10]. [11]. [12]. [13]. [14] [15]. [16] [17]. [18]. [19]. [20]. 2009 Workshop on Energy Efficient Design (WEED) (2009). Warkozek, G., Drayer, E., Debusschere, V. and Bacha, S.: A new approach to model energy consumption of servers in data centers, Industrial Technology (ICIT), 2012 IEEE International Conference on, pp. 211–216 (online), DOI: 10.1109/ICIT.2012.6209940 (2012). Bohra, A. and Chaudhary, V.: VMeter: Power modelling for virtualized clouds, Parallel Distributed Processing, Workshops and Phd Forum (IPDPSW), 2010 IEEE International Symposium on, pp. 1–8 (online), DOI: 10.1109/IPDPSW.2010.5470907 (2010). Nagasaka, H., Maruyama, N., Nukada, A., Endo, T. and Matsuoka, S.: Statistical power modeling of GPU kernels using performance counters, International Conference on Green Computing, pp. 115–122 (online), DOI: 10.1109/GREENCOMP.2010.5598315 (2010). Lim, J., Lakshminarayana, N. B., Kim, H., Song, W., Yalamanchili, S. and Sung, W.: Power Modeling for GPU Architectures Using McPAT, ACM Trans. Des. Autom. Electron. Syst., Vol. 19, No. 3, pp. 26:1– 26:24 (online), DOI: 10.1145/2611758 (2014). Ge, R., Vogt, R., Majumder, J., Alam, A., Burtscher, M. and Zong, Z.: Effects of Dynamic Voltage and Frequency Scaling on a K20 GPU, Proceedings of the 2013 42Nd International Conference on Parallel Processing, ICPP ’13, Washington, DC, USA, IEEE Computer Society, pp. 826–833 (online), DOI: 10.1109/ICPP.2013.98 (2013). Song, S., Su, C., Rountree, B. and Cameron, K. W.: A Simplified and Accurate Model of Power-Performance Efficiency on Emergent GPU Architectures, 2013 IEEE 27th International Symposium on Parallel and Distributed Processing, pp. 673–686 (online), DOI: 10.1109/IPDPS.2013.73 (2013). Arroba, P., Risco-Martn, J. L., Zapater, M., Moya, J. M., Ayala, J. L. and Olcoz, K.: Server Power Modeling for Runtime Energy Optimization of Cloud Computing Facilities, Energy Procedia, Vol. 62, No. 0, pp. 401 – 410 (online), DOI: 10.1016/j.egypro.2014.12.402 (2014). Arroba, P., Risco-Mart´ın, J. L., Zapater, M., Moya, J. M. and Ayala, J. L.: Enhancing Regression Models for Complex Systems Using Evolutionary Techniques for Feature Engineering, J. Grid Comput., Vol. 13, No. 3, pp. 409–423 (online), DOI: 10.1007/s10723-014-93138 (2015). Salinas-Hilburg, J. C., Zapater, M., Risco-Martn, J. L., Moya, J. M. and Ayala, J. L.: Unsupervised power modeling of coallocated workloads for energy efficiency in data centers, 2016 Design, Automation Test in Europe Conference Exhibition (DATE), pp. 1345– 1350 (2016). Boccara, N.: Modeling Complex Systems, Graduate Texts in Physics, Springer (2010). Vladislavleva, E., Smits, G. and den Hertog, D.: Order of Nonlinearity as a Complexity Measure for Models Generated by Symbolic Regression via Pareto Genetic Programming, Evolutionary Computation, IEEE Transactions on, Vol. 13, No. 2, pp. 333–349 (online), DOI: 10.1109/TEVC.2008.926486 (2009). O’Neill, M. and Ryan, C.: Grammatical evolution, Evolutionary Computation, IEEE Transactions on, Vol. 5, No. 4, pp. 349–358 (online), DOI: 10.1109/4235.942529 (2001). Back, T., Hammel, U. and Schwefel, H.-P.: Evolutionary computation: comments on the history and current state, Evolutionary Computation, IEEE Transactions on, Vol. 1, No. 1, pp. 3–17 (online), DOI: 10.1109/4235.585888 (1997). Hemberg, E., Ho, L., ONeill, M. and Claussen, H.: A comparison of grammatical genetic programming grammars for controlling femtocell network coverage, Genetic Programming and Evolvable Machines, Vol. 14, No. 1, pp. 65–93 (online), DOI: 10.1007/s10710-012-9171-8 (2013). Endo, T., Nukada, A. and Matsuoka, S.: TSUBAME-KFC: A modern liquid submersion cooling prototype towards exascale becoming the greenest supercomputer in the world, 2014 20th IEEE International Conference on Parallel and Distributed Systems (ICPADS), pp. 360– 367 (online), DOI: 10.1109/PADSW.2014.7097829 (2014). Che, S., Boyer, M., Meng, J., Tarjan, D., Sheaffer, J. W., Lee, S.-H. and Skadron, K.: Rodinia: A Benchmark Suite for Heterogeneous Computing, Proceedings of the 2009 IEEE International Symposium on Workload Characterization (IISWC), IISWC ’09, Washington, DC, USA, IEEE Computer Society, pp. 44–54 (online), DOI: 10.1109/IISWC.2009.5306797 (2009).. 7.
(8)
図
関連したドキュメント
It is suggested by our method that most of the quadratic algebras for all St¨ ackel equivalence classes of 3D second order quantum superintegrable systems on conformally flat
The general context for a symmetry- based analysis of pattern formation in equivariant dynamical systems is sym- metric (or equivariant) bifurcation theory.. This is surveyed
We use these to show that a segmentation approach to the EIT inverse problem has a unique solution in a suitable space using a fixed point
In the present work, resuming from part of [9], we investigate a methodology based on the characteristic equation, which seems particularly practical for the scalar prototype
Thus, we use the results both to prove existence and uniqueness of exponentially asymptotically stable periodic orbits and to determine a part of their basin of attraction.. Let
“Breuil-M´ezard conjecture and modularity lifting for potentially semistable deformations after
Then it follows immediately from a suitable version of “Hensel’s Lemma” [cf., e.g., the argument of [4], Lemma 2.1] that S may be obtained, as the notation suggests, as the m A
Section 3 is first devoted to the study of a-priori bounds for positive solutions to problem (D) and then to prove our main theorem by using Leray Schauder degree arguments.. To show
