Tottori University research result repository
タイトル
Title
Elucidation of the Reaction Behavior of Silicon
Negative Electrodes in a Bis(fluorosulfonyl)amide‐
Based Ionic Liquid Electrolyte
著者
Auther(s)
Yamaguchi, Kazuki; Domi, Yasuhiro; Usui, Hiroyuki;
Sakaguchi, Hiroki
掲載誌・巻号・ページ
Citation
ChemElectroChem , 4 (12) : 3257 - 3263
刊行日
Issue Date
2017-09-12
資源タイプ
Resource Type
学術雑誌論文 / Journal Article
版区分
Resource Version
著者版 / Author
権利
Rights
© 2017 Wiley‐VCH Verlag GmbH & Co. KGaA, Weinheim
DOI
10.1002/celc.201700724
Elucidation of the Reaction Behavior of Silicon Negative
Electrodes in a Bis(fluorosulfonyl)amide-Based Ionic Liquid
Electrolyte
Kazuki Yamaguchi
[a,b,c], Yasuhiro Domi
[a,b,c], Hiroyuki Usui
[a,b,c], and Hiroki Sakaguchi
*[a,b,c] Abstract: Excellent cycling performance of a Si-alone electrode wasachieved in a bis(fluorosulfonyl)amide (FSA)-based electrolyte: a
high discharge capacity of 950 mA h g–1 was observed even at the
500th cycle. To elucidate the reaction behavior of the Si electrode in an FSA-based ionic liquid electrolyte, we investigated the change in the cross-sectional morphology of the Si active material layer, the distribution of Li in the layer, and the crystallinity of Si on the electrode surface. By cross-sectional scanning electron microscopic observation, we confirmed that the electrode thickness increased with the cycle number. The increase in thickness was less noticeable in the FSA-based electrolyte than in an organic electrolyte. An elemental analysis in the electrode revealed that a film derived from the electrolyte was formed not only on the surface but also inside of the electrode. Soft X-ray emission spectroscopy demonstrated that the distribution of Li in the FSA-based electrolyte was more uniform for the cross-section of the cycled electrode compared to that in an organic electrolyte. The results of Raman spectroscopy indicated that domains of amorphous Si were homogeneously distributed on the electrode surface in the FSA-based electrolyte. The uniform distribution of the lithiation–delithiation reaction should help to suppress disintegration of the active material layer.
Introduction
Lithium-ion batteries (LIBs) have been widely used in portable electronic devices, such as smartphones and laptop computers. While they have also used on a larger scale, e.g., as power sources in electric vehicles and stationary power supply systems, their energy densities are not yet sufficient for such large-scale applications. Silicon (Si) is an extremely promising negative electrode material for LIBs because the theoretical capacity of Si (Li15Si4: 3580 mA h g–1) is approximately ten times
higher than that of graphite (LiC6: 372 mA h g–1), which is used
currently.[1,2] However, Si undergoes a volumetric change of
380% upon going from Si to Li15Si4, which generates high
stresses and strains in the active material. The accumulation of strains under repeated charge–discharge cycling finally leads to disintegration of the active material layer; thus, Si electrodes
show poor cycling stability. In addition, Si has a low electrical conductivity and a low diffusion coefficient for Li+.[3-5] These are
the main obstacles to the practical application of Si-based electrodes.
The electrolyte is one of the most important components that determines the lifetime and safety of batteries. When Si is used as a negative electrode active material, the energy density of LIBs increases, which raises the fear of explosion or ignition. Thus, non-flammable electrolytes are needed to improve the safety of LIBs. Ionic liquids have excellent physicochemical properties as electrolyte solvents: negligible vapor pressure, non-flammability, high conductivity, and wide electrochemical window.[6-9] Therefore, ionic liquids have attracted much
attention as electrolyte solvents for use in LIBs. Some researchers reported negative-electrode performance of electrodeposited Si electrode in lithium bis(trifluoromethanesulfonyl)amide/1-butyl-1-methylpyrrolidinium bis(trifluoromethanesulfonyl)amide, which was relatively high cycling stability compared to that in an organic electrolyte.[10–12]
We previously investigated the electrochemical performance of Si-based electrodes in various ionic liquid electrolytes.[13-18] We
found that the cycling stabilities of Si-alone electrodes were significantly improved in some ionic liquid electrolytes. The Si-alone electrode notably exhibited excellent cycling performance in an ionic liquid that consisted of 1-((2-methoxyethoxy)methyl)-1-methylpiperidinium (PP1MEM) cation and bis(fluorosulfonyl)amide (FSA) anion.[18]
Lee et al. demonstrated the decomposition mechanism of FSA anion on a Si-based electrode using ab initio molecular dynamics simulation.[19] The S-F bond of the FSA anion rapidly
breaks and releases F–, most likely forming LiF in the surface
film, in combination with the release of SO2. They speculated
that the fast release of F– and SO
2 is associated with the
superior cycling performance in the FSA-based electrolyte. They also examined changes in the mass of the electrode during the first charge–discharge cycle using an in situ electrochemical quartz crystal microbalance. The results revealed that the surface film derived from FSA is stable compared with that derived from an organic electrolyte. Ishikawa et al. investigated the cycling performance of a silicon–nickel–carbon composite electrode in an FSA-based electrolyte.[20] Based on the results of
electrochemical impedance spectroscopy, they demonstrated that the excellent performance in an FSA-based electrolyte is associated with very low interfacial and charge–transfer resistances at the Si-based composite electrode. The authors confirmed the much lower resistances of a Si-alone electrode in an FSA-based electrolyte compared to that in a bis(trifluoromethanesulfonyl)amide-based electrolyte.[17]
Although the composition of the surface film and the interfacial resistance between the electrode and electrolyte have been studied previously as described above, the distribution of the lithiation–delithiation reaction on a Si electrode in an FSA-based
[a,b] K. Yamaguchi, Dr. Y. Domi, Dr. H. Usui, and Prof. H. Sakaguchi* [a] Department of Chemistry and Biotechnology, Graduate School of Engineering, and [b] Center for Research on Green Sustainable Chemistry, Tottori University
4-101 Minami, Koyama-cho, Tottori 680-8552, Japan E-mail*: sakaguch@chem.tottori-u.ac.jp
[c] K. Yamaguchi, Dr. Y. Domi, Dr. H. Usui, and Prof. H. Sakaguchi
Global Research Center for Environment and Energy based on Nanomaterials Science, National Institute for Materials Science Namiki 1-1, Tsukuba, Ibaraki 305-0044, Japan
Supporting information for this article is given via a link at the end of the document.
electrolyte is not yet fully understood. The lithiation distribution is important for understanding the utilization ratio of active material, which should contribute to the development of electrodes with higher capacity and longer life.
Soft X-ray emission spectroscopy (SXES) is a method for elemental analysis that can detect Li, whereas it is difficult to observe Li with other methods such as energy dispersive X-ray spectroscopy. Thus, with SXES, we can directly observe the lithiation distribution in the electrode. On the other hand, Raman spectroscopy enables us to identify the crystallinity of Si, since Raman bands of crystalline Si (c-Si) and amorphous Si (a-Si) appear at 520 and 490 cm–1, respectively.[21–23] After c-Si
electrochemically reacts with Li at room temperature to form Li15Si4 and then Li is extracted, it turns into a-Si.[2,24] Taking
advantage of this phenomenon, we previously visualized for the first time the distributions of c-Si and a-Si on an electrode surface after cycling by Raman mapping analysis[15]. The results
revealed that the lithiation–delithiation reaction proceeds uniformly on the electrode surface in a certain ionic liquid electrolyte, which may contribute to the excellent cycling performance. However, we did not determine whether the lithiation–delithiation reaction inside the electrode also proceeds uniformly. Hence, the interior of the electrode need to be investigated by cross-sectional observation. In this study, we tried to elucidate the reaction behavior of Si-alone electrodes in an FSA-based ionic liquid electrolyte based on cross-sectional scanning electron microscopic observation, SXES, and Raman spectroscopy. In addition, we attempted to further improve the cycling performance by controlling the extent of Li-extraction.
Results and Discussion
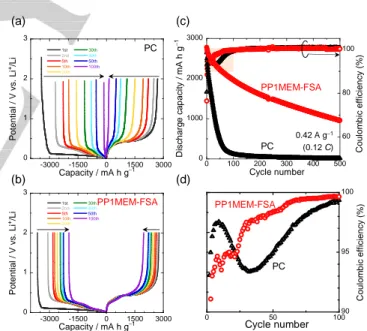
Figure 1a and b show the charge-discharge curves of the Si electrodes at 1st to 100th cycles in PC-based organic and FSA-based ionic liquid electrolytes. At the 1st cycle, potential plateaus were observed at around 0.1 and 0.4 V vs. Li+/Li on
charge and discharge curves in each electrolyte. These potential plateaus are attributed to the alloying and dealloying reactions of Si with Li. In addition, potential slopes were also observed more than 0.2 V vs. Li+/Li on charge curves in each electrolyte,
indicating that the electrolyte was decomposed to form a film on the electrode surface[25,26]. The Coulombic efficiencies at the 1st
cycle were 81% and 76% in PC and PP1MEM-FSA, respectively. These low efficiencies should be attributed to the electrolyte decomposition. However, the ideal film prevents continuous decomposition of electrolyte during subsequent cycles. Therefore, potential slopes were not clearly appeared on charge curves following 2nd cycle.
Figure 1c shows the cycling performance of a Si electrode in PP1MEM-FSA or PC. The Si electrode exhibited a high discharge capacity of 2700 mA h g–1 at the first cycle in the PC.
However, almost all of the capacity faded by the 100th cycle. In contrast, in the PP1MEM-FSA, the electrode showed not only a high initial discharge capacity of 2700 mA h g–1 but also
excellent cycling stability: the discharge capacity was approximately 950 mA h g–1 even at the 500th cycle. We
previously reported that a Si electrode exhibited a discharge capacity of 1000 mA h g–1 at the 100th cycle in 1 M
LiTFSA/PP1MEM-TFSA.[13,18] Although these ionic liquids
consisted of the same PP1MEM cation, the PP1MEM-FSA achieved superior cycling performance. Therefore, we focused on the FSA-based electrolyte in this study. The areal capacity is important factor in this field. The capacity was calculated and shown in Figure S1. An areal capacity of 0.15 mA h cm–2 in
PP1MEM-FSA was never high. However, a gas-deposition method is a suitable technique for forming thick films and does not require any conductive additive and binder for the preparation of thick-film electrodes. It is thus possible to directly observe an electrochemical reaction between pure Si and electrolytes.
Figure 1d shows an enlarged view of the initial Coulombic efficiency in Figure 1c. A drop in efficiency was observed at around the 30th cycle in the PC. Because a large change in the volume of Si during the charge–discharge process led to cracking and pulverization of the active material layer, the PC was decomposed on the newly exposed electrode surface. This is the reason for the drop in efficiency. In contrast, in the PP1MEM-FSA, the efficiency gradually increased with cycle number and remained above 95% after the 30th cycle, indicating that the extent of disintegration of the electrode in the PP1MEM-FSA was small compared to that in the PC.
Figure 1. Charge−discharge curves of Si electrodes in (a) 1 M LiTFSA/PC and (b) LiFSA/PP1MEM-FSA. (c) Cycling performance of Si electrode in 1 M
LiFSA/PP1MEM-FSA or LiTFSA/PC. (d) Enlarged view of the
corresponding Coulombic efficiency during the initial 100 cycles.
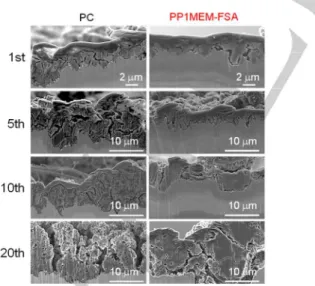
To elucidate the reaction behaviors of Si electrodes in each electrolyte, we observed changes in the morphology of the Si active material layer after the charge–discharge test by cross-sectional SEM, as shown in Figure 2. While the thickness of the Si active material layer was 1.6 µm before cycling (data not
0.42 A g−1 0 1000 2000 3000 60 80 100 0 100 200 300 400 500 D is c h ar g e c a p ac it y / m A h g − 1 Cycle number C o ul om b ic ef fi c ien c y ( % ) 90 95 100 0 50 100 Cycle number C o u lo m b ic e ff ic ie n c y ( % ) (c) (0.12 C) PP1MEM-FSA PC (d) 0 1 2 3 -3000 -1500 0 1500 3000 1st 2nd 5th 10th 20th 30th 40th 50th 100th P o te n ti a l / V v s . L i +/L i Capacity / mA h g−1 PC 0 1 2 3 -3000 -1500 0 1500 3000 1st 2nd 5th 10th 20th 30th 40th 50th 100th P o te n ti a l / V v s . L i +/L i Capacity / mA h g−1 PP1MEM-FSA (a) (b) PP1MEM-FSA PC
shown), it increased to 2.4 and 3.6 µm after the first cycle in the PP1MEM-FSA and PC, respectively. In addition, the thickness was estimated to be 10.4 and 14.9 µm after the 20th cycle in the PP1MEM-FSA and PC, respectively. Table 1 shows the variation in the thickness of the Si layer versus the number of cycles. The thickness of the Si layer increased with the cycle number in both electrolytes. In addition, the Si layer in the PP1MEM-FSA was thinner than that in the PC. The Si layer in the PC became porous after the 20th cycle, whereas that in the PP1MEM-FSA was not very porous. A similar phenomenon has been reported for other Si-based electrodes in PC.[27] Therefore,
this phenomenon can be attributed to the electrolyte rather than the electrode. PC-based organic electrolytes are generally decomposed to inhomogeneously form surface film on negative electrodes.[26] It is considered that Li+ is preferentially inserted
into the electrode through not the thicker parts but the thinner parts of the surface film, because the thicker parts inhibit the Li-insertion reactions. For non-uniform Li-Li-insertion, extreme volume expansion and contraction occur in the localized regions of the Si electrode, which intensively generates accumulated stress in these regions. This leads to severe disintegration of the Si electrode, which then results in poor cycling stability. In addition, the extreme volume changes bring about the formation of cracks. After Li-extraction from the Si electrode, the crack becomes larger, and a partial breakup of the electrode occurs. We consider this is the reason that the Si layer was porous in PC. On the other hand, a film derived from ionic liquid electrolyte is thin and stable.[28] In addition, we revealed that Li-insertion
uniformly occurs in PP1MEM-TFSA.[15] The uniform Li-insertion
into the Si electrode makes the Si layer expand uniformly. As a result, the stress uniformly generates over the entire surface. In other words, the Si electrode can reasonably avoid stress accumulation in localized regions, which suppresses the severe disintegration of the Si electrode. For this reason, the Si layer in PP1MEM-FSA was not as porous as that in PC.
Figure 2. Cross-sectional SEM images of lithiated Si electrodes after the 1st,
5th, 10th and 20th cycle in 1 M (left) LiTFSA/PC or (right) LiFSA/PP1MEM-FSA.
Table 1. Thickness of a lithiated Si layer after the 1st, 5th, 10th, and 20th
cycles estimated from Figure 2.
PC PP1MEM-FSA Before cycle 1.6 ± 0.3 µm 1st cycle 3.6 ± 0.9 µm 2.4 ± 0.7 µm 5th cycle 8.6 ± 2.7 µm 3.0 ± 0.9 µm 10th cycle 8.8 ± 2.8 µm 5.6 ± 1.2 µm 20th cycle 14.9 ± 2.7 µm 10.4 ± 4.5 µm
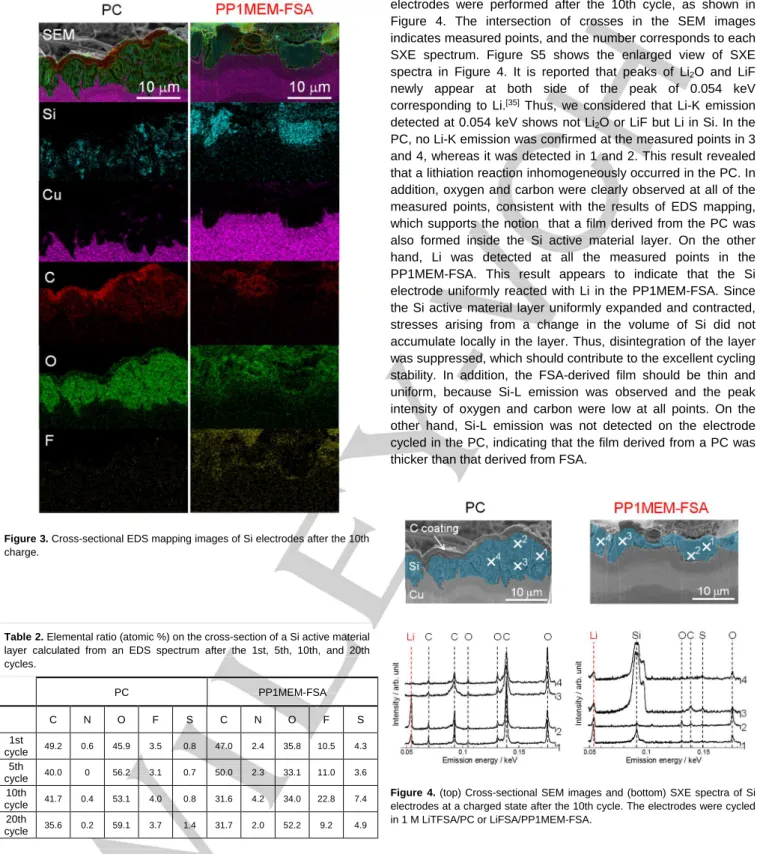
It is well known that the properties of films strongly affect battery performance.[26,29] To investigate the composition of the
film, an elemental analysis was performed for a cross-section of the electrode. Figure 3 shows the results of EDS elemental mapping after the 10th cycle in combination with SEM images. C and O were detected in the Si layer in the PC. This suggests that the electrolyte penetrated into the Si layer which became porous, and was reductively decomposed. It has been reported that the decomposition products of carbonate-based solvents are mainly lithium carbonate, lithium alkyl carbonate, and organic salts.[29–31] Among these, organic salts are soluble in
electrolytes, which means that a surface film composed of organic salts should be unstable during charge–discharge cycling. Although LiTFSA (LiN(SO2CF3)2) contains fluorine,
almost no F was detected, indicating that the organic solvent, i.e. PC, was mainly decomposed during a charge–discharge process. On the other hand, in the PP1MEM-FSA, we observed not only C and O, but also F. Indeed, F was confirmed after each cycle, as shown in Figures S2–4. Table 2 shows the ratios of all elements calculated from EDS spectra. In contrast to the PC, the FSA anion appeared to have decomposed, since S and N were detected in the PP1MEM-FSA. Some researchers have reported that the decomposition products of FSA are LiF, Li2O,
and so on.[19,32,33] LiF and Li
2O have been shown to enhance the
structural stability of a film on an electrode surface and the negative electrode property of a Si electrode was remarkably improved by a surface film including LiF and Li2O.[19,34] Therefore,
the formation of a favorable film on the surface and the interior of the Si electrode should contribute to the excellent cycling stability.
Figure 3. Cross-sectional EDS mapping images of Si electrodes after the 10th
charge.
Table 2. Elemental ratio (atomic %) on the cross-section of a Si active material
layer calculated from an EDS spectrum after the 1st, 5th, 10th, and 20th cycles. PC PP1MEM-FSA C N O F S C N O F S 1st cycle 49.2 0.6 45.9 3.5 0.8 47.0 2.4 35.8 10.5 4.3 5th cycle 40.0 0 56.2 3.1 0.7 50.0 2.3 33.1 11.0 3.6 10th cycle 41.7 0.4 53.1 4.0 0.8 31.6 4.2 34.0 22.8 7.4 20th cycle 35.6 0.2 59.1 3.7 1.4 31.7 2.0 52.2 9.2 4.9
It is very important to understand the distribution of the lithiation–delithiation reaction of Si electrodes, because this distribution leads to the utilization ratio of active material and largely affects the cycling performance of Si electrodes.[15] To
determine this distribution, SXES measurements of the
electrodes were performed after the 10th cycle, as shown in Figure 4. The intersection of crosses in the SEM images indicates measured points, and the number corresponds to each SXE spectrum. Figure S5 shows the enlarged view of SXE spectra in Figure 4. It is reported that peaks of Li2O and LiF
newly appear at both side of the peak of 0.054 keV corresponding to Li.[35] Thus, we considered that Li-K emission
detected at 0.054 keV shows not Li2O or LiF but Li in Si. In the
PC, no Li-K emission was confirmed at the measured points in 3 and 4, whereas it was detected in 1 and 2. This result revealed that a lithiation reaction inhomogeneously occurred in the PC. In addition, oxygen and carbon were clearly observed at all of the measured points, consistent with the results of EDS mapping, which supports the notion that a film derived from the PC was also formed inside the Si active material layer. On the other hand, Li was detected at all the measured points in the PP1MEM-FSA. This result appears to indicate that the Si electrode uniformly reacted with Li in the PP1MEM-FSA. Since the Si active material layer uniformly expanded and contracted, stresses arising from a change in the volume of Si did not accumulate locally in the layer. Thus, disintegration of the layer was suppressed, which should contribute to the excellent cycling stability. In addition, the FSA-derived film should be thin and uniform, because Si-L emission was observed and the peak intensity of oxygen and carbon were low at all points. On the other hand, Si-L emission was not detected on the electrode cycled in the PC, indicating that the film derived from a PC was thicker than that derived from FSA.
Figure 4. (top) Cross-sectional SEM images and (bottom) SXE spectra of Si
electrodes at a charged state after the 10th cycle. The electrodes were cycled in 1 M LiTFSA/PC or LiFSA/PP1MEM-FSA.
To investigate the distribution of c-Si and a-Si on the surface of the Si electrode, Raman mapping measurement was conducted. Mapping was performed at peak positions with maximal intensities within a wavenumber range from 490 to 520 cm–1 based on the phenomenon that the crystallinity of Si
mappings of delithiated Si electrodes after the 10th cycle in the PC and PP1MEM-FSA, respectively. The red region in the images corresponds to c-Si, which did not react with Li, whereas the blue region indicates a-Si, which completely reacted. In regions with a cooler color (e.g. green), Si showed a greater loss of crystallinity. In Figure 5a, c-Si locally remained on the electrode, which means that the lithiation–delithiation reaction inhomogeneously occurred in the PC. In contrast, the domains of a-Si were homogeneously distributed on the electrode surface in the PP1MEM-FSA (Figure 5b), which shows that the lithiation–delithiation reaction occurred uniformly. As mentioned above, this is probably because FSA-derived films are thin and have uniform conductivity of Li; thus, Li was inserted into the Si electrode over the entire surface, which suppresses severe disintegration of the Si electrode. The uniform distribution of lithiation–delithiation enhances the utilization ratio of active material and contributes to the significant improvement in the cycling performance of the Si electrode with the use of a PP1MEM-FSA.
Figure 5. Raman mapping images of the delithiated Si electrode surface after
the 10th cycle. The electrodes were cycled in (a) LiTFSA/PC or (b) LiFSA/PP1MEM-FSA. The red region corresponds to c-Si, which did not react with Li, whereas the blue region indicates a-Si, which completely reacted. In regions with a cooler color (e.g. green), Si showed a greater loss of crystallinity.
To show that the results of Raman mapping are applicable over a wider regions, we conducted Raman spectroscopic measurements quantitatively at arbitrary points in a 100 µm square on the electrode surface. Figure S5 shows the dependence of the mean value of the Raman shift and its standard deviation (SD) for the Si electrode on the cycle number in each electrolyte. In the PC, the SD was large during 10 cycles, indicating that the region where Si reacted with Li and the region where it did not react were mixed over a wide area on the electrode. On the other hand, in the PP1MEM-FSA, lithiation– delithiation reactions should uniformly occur within a region of 100 × 100 µm2, because the SD was smaller during 10 cycles.
Consequently, these results reflect the findings of Raman mapping analyses. The mean value in the PP1MEM-FSA was lower than that in the PC at each cycle. In addition, almost no change in the mean value was observed in the PP1MEM-FSA, whereas the value decreased gradually with cycle number in the
PC. These results indicate that the crystallinity of Si on the electrode decreased continuously in the organic electrolyte. In contrast, almost no change in crystallinity was confirmed during the 10th cycle in the PP1MEM-FSA. In the PP1MEM-FSA, a favorable film was formed on the entire surface of the electrode at the initial cycle, and the charge–discharge reaction was repeated. In contrast, a favorable film was not formed in the PC, and the lithiation–delithiation reaction occurred locally and gradually decreased the crystallinity of Si.
Si exhibits an extremely high capacity by alloying with Li to form Li15Si4. In this process, its volume expands up to
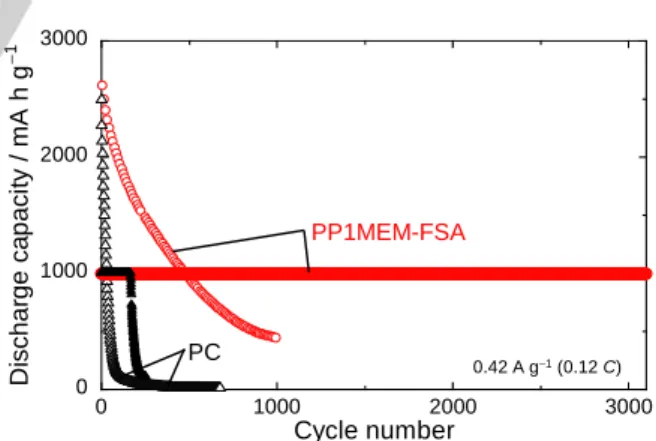
approximately 4 times, which leads to disintegration of the electrodes. Even if a favorable electrode–electrolyte interface, which enables uniform Li-insertion into the Si electrode, is formed, the excessive volume expansion leads to breakup of the interface. We have demonstrated that a favorable electrode– electrolyte interface can be maintained by controlling the amount of Li insertion–extraction.[15] Figure 6 shows the long cycling
performance of a Si electrode in the PP1MEM-FSA with a discharge-capacity limitation of 1000 mA h g–1. In the PC, the Si
electrode maintained a discharge capacity of 1000 mA h g–1 until
200 cycles. On the other hand, the cycling performance dramatically improved in the PP1MEM-FSA. The Si electrode exhibited extremely excellent cycling stability and maintained a high capacity of 1000 mA h g–1 beyond 3000 cycles. The
electrode without capacity limitation was not able to maintain a discharge capacity of 1000 mA h g–1 beyond the 500th cycle, as
shown in Figure 1c. Therefore, this excellent performance should be attributed to the notion that a favorable electrode– electrolyte interface was achieved by suppressing extreme volumetric changes in the Si layer.
Figure 6. Changes in discharge capacities of Si electrodes versus cycle
number in 1 M LiFSA/PP1MEM-FSA, or LiTFSA/PC. The discharge capacities
were limited to 1000 mA h g–1. For comparison, the performances of
electrodes without capacity limitation are also plotted.
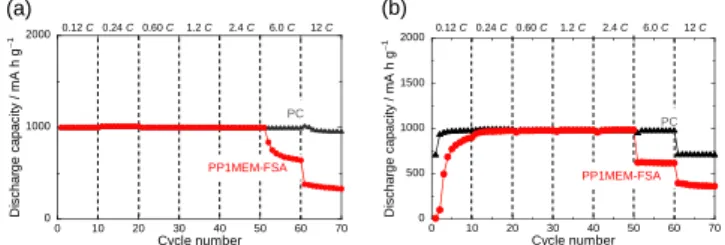
Figure 7a shows the rate capabilities of the Si electrodes in the PP1MEM-FSA and PC with a discharge capacity limitation of 1000 mA h g–1. The electrode in the PP1MEM-FSA maintained a
discharge capacity of 1000 mA h g–1 even at a relatively high
current density of 8.4 A g–1 (2.4 C), but the capacity decreased
at a current rate of 6 or 12 C. On the other hand, in the PC, the
0 1000 2000 3000 0 1000 2000 3000 D is c h a rg e c a p a c it y / m A h g − 1 Cycle number PP1MEM-FSA 0.42 A g−1(0.12 C) PC
electrode maintained this discharge capacity even at a higher current rate of 12 C. We previously confirmed that the ionic conductivities of the PP1MEM-FSA and PC are 2.06 and 5.51 mS cm–1 at 303 K, respectively.[14] Under a high current rate, Li+
transport, i.e., ionic conductivity in the electrolyte bulk, dominantly affects the rate capability. Therefore, the capacity-fading in the PP1MEM-FSA at 6 and 12 C may be mainly caused by limitation of the rate of Li+ diffusion in the electrolyte
bulk. As shown in Figure 7b, when the charge capacity was limited, the discharge capacity of the electrode in the PC decreased at 12 C. This result suggests that the electrode was more disintegrated compared to when the discharge capacity was limited.
Figure 7. Rate capabilities of Si electrodes in 1 M LiFSA/PP1MEM-FSA, or
LiTFSA/PC at various current densities from 0.42 to 42 A g–1. (a) The
discharge and (b) charge capacities were limited to 1000 mA h g–1.
Conclusions
A Si-alone electrode exhibited superior electrochemical performance in an FSA-based ionic liquid electrolyte compared to a PC-based organic electrolyte. The electrode in the PP1MEM-FSA maintained a discharge capacity of 1000 mA h g– 1 beyond 3000 cycles, whereas that in the PC retained this
capacity until only 200 cycles. To understand the reason for the excellent cycling performance, we tried to elucidate the reaction behavior of the Si electrode in the PP1MEM-FSA. We confirmed that the thickness of the electrode increased with cycle number in both electrolytes by cross-sectional SEM observations. This means also that the PP1MEM-FSA is not able to stop the continuous growth of the Si layer but that the FSA-derived film has enough structural stability for long term cycling and this is probably due to the presence of LiF in its composition. The EDS mapping results demonstrated that a film derived from electrolytes was formed not only on the surface, but also inside of the electrode. In addition, the FSA-derived film contained F and O, which suggests that LiF and Li2O were formed. Thus, the
film should be more stable and contribute to better cycling performance. The SXES results suggested that the lithiation distribution on the cross-section of the Si layer in the PP1MEM-FSA was more uniform than that in the PC. In addition, the film derived from FSA was thin and uniform. Raman spectroscopic analysis revealed that a lithiation reaction proceeded uniformly, which helped to suppress the disintegration of the Si active material layer. Consequently, the Si-alone electrode in the PP1MEM-FSA attained excellent cycling stability.
Experimental Section
Electrode preparation and charge–discharge test
A Si-alone electrode was prepared by the gas-deposition (GD)
method. While conventional electrode preparation using a slurry
requires not only active materials but also a binder and conductive agent, the GD method does not require these additives. Thus, this method is suitable for elucidating the reaction behavior of a Si electrode. The
detailed conditions have been described previously.[13,15] The weight of
the deposited active materials, the deposition area on the Cu substrate,
and the thickness of the active material layer were 30±2 µg, 0.5×0.5×π
cm2, and ca. 1.6±0.3 µm, respectively. We assembled a 2032-type coin
cell, which consisted of the Si-alone electrode as a working electrode, a glass fiber filter (Whatman GF/A) as a separator, and Li metal foil (Rare Metallic Co., Ltd., 99.90%) as a counter electrode. The ionic liquid
electrolyte solution was 1 mol dm–3 (M) lithium bis(fluorosulfonyl)amide
(LiFSA) dissolved in 1-((2-methoxyethoxy)methyl)-1-methylpiperidinium bis(fluorosulfonyl)amide (PP1MEM-FSA). PP1MEM cation was used
because it can increase the initial capacity of the Si electrode.[13] For
comparison, 1 M lithium bis(trifluoromethanesulfonyl)amide (LiTFSA) in propylene carbonate (PC, Kishida Chemical Co., Ltd.) was also used as a conventional organic electrolyte. The electrolyte preparation and cell assembly were performed in an argon-filled glove box (DBO-2.5LNKP-TS,
Miwa MFG) which was maintained at a dew point below −100 oC and an
oxygen content below 1 ppm. A galvanostatic charge–discharge test was conducted using an electrochemical measurement system (HJ-1001SD8, Hokuto Denko Co., Ltd.) in a potential range between 0.005 and 2.000 V
vs. Li+/Li at 30 oC under a current density of 0.42 A g–1 (0.12 C) unless
otherwise stated. The rate capability was also investigated at a current rate from 0.12 to 12 C.
Morphological observation and elemental analysis
After the charge−discharge test, the coin-type cell was disassembled in an argon-filled glove box to prevent exposure to the atmosphere, and the electrode was washed with PC and diethyl carbonate (DEC, Kishida Chemical Co., Ltd.) to remove residual electrolytes. A focused ion beam (FIB, JIB-4501, JEOL Co., Ltd.) was used to fabricate the cross-sectional surface of the electrode. The surface of the electrode was coated with carbon to protect it against
damage by the Ga+ beam of FIB. The cross-sectional surface of the
electrode was observed by a field-emission scanning electron microscope (FE-SEM, JSM-7800F, JEOL Co., Ltd.) equipped with energy dispersive X-ray spectroscopy (EDS) and soft X-ray emission spectroscopy (SXES). The electrodes were not exposed to the atmosphere until they were introduced into the chamber of the FE-SEM from cell disassembly using a transfer vessel.
PP1MEM-FSA PC 0.12 C 0.24 C 0.60 C 1.2 C 2.4 C 6.0 C 12 C 0 1000 2000 0 10 20 30 40 50 60 70 D is c h a rg e c a p a c it y / m A h g − 1 Cycle number PP1MEM-FSA PC 0.12 C 0.24 C 0.60 C 1.2 C 2.4 C 6.0 C 12 C 0 500 1000 1500 2000 0 10 20 30 40 50 60 70 D is c h a rg e c a p a c it y / m A h g − 1 Cycle number (a) (b)
Raman spectroscopic analysis
The distribution of c-Si and a-Si on the electrode surface after the charge–discharge test was investigated by Raman microscopy (NanofinderFLEX, Tokyo Instruments, Inc.). Raman spectra were excited with the 532 nm line (16.5 mW) of a Nd:YAG laser through a 50-power objective lens. After the 10th cycle, the coin-type cell was disassembled in a glove box and the Si electrode was washed with PC and DEC to remove residual electrolyte. The electrode was then put into a sealed cell.
The mapping area was 7 × 7 µm2, and Raman spectra of 400 points
(20-by-20 points) were recorded. Raman images of the electrode surfaces were then made by plotting the band position with the maximum intensity
in a wavenumber range from 490 to 520 cm−1.
Acknowledgements
This work was partially supported by the Japan Society for the Promotion of Science (JSPS) KAKENHI (Grant Numbers JP17H03128, JP16K05954, and JP17K17888) and the MEXT Program for Development of Environmental Technology using Nanotechnology. Part of this work was supported by the Kyoto Technoscience Center. The authors thank Prof. T. Itoh and Prof. T. Nokami for their assistance in the preparation of ionic liquid. Keywords: Lithium-ion battery • Silicon • Ionic liquid • energy storage • high capacity
[1] S.-C. Lai, J. Electrochem. Soc. 1976, 123, 1196–1197.
[2] M. N. Obrovac, L. Christensen, Electrochem. Solid-State Lett. 2004, 7,
A93–A96.
[3] M. N. Obrovac, L. J. Krause, J. Electrochem. Soc. 2007, 154, A103–
A108.
[4] N. Ding, J. Xu, Y. X. Yao, G. Wegner, X. Fang, C. H. Chen, I.
Lieberwirth, Solid State Ionics, 2009, 180, 222–225.
[5] J. Xie, N. Imanishi, T. Zhang, A. Hirano, Y. Takeda, O. Yamamoto,
Mater. Chem. Phys. 2010, 120, 421–425.
[6] M. Yamagata, N. Nishigaki, S. Nishishita, Y. Matsui, T. Sugimoto, M. Kikuta, T. Higashizaki, M. Kono, M. Ishikawa, Electrochim. Acta 2013, 110, 181–190.
[7] W. Henderson, S. Passerini, Chem. Mater. 2004, 16, 2881–2885.
[8] N. Madria, T. A. Arunkumar, N. G. Nair, A. Vadapalli, Y. W. Huang, S.
C. Jones, V. P. Reddy, J. Power Sources 2013, 234, 277–284.
[9] E. Markevich, R. Sharabi, V. Borgel, H. Gottlieb, G. Salitra, D. Aurbach,
G. Semrau, M. A. Schmidt, Electrochim. Acta 2010, 55, 2687–2696. [10] C. A. Vlaic, S. Ivanov, R. Peipmann, A. Eisenhardt, M. Himmerlich, S.
Krischok, A. Bund, Electrochimica Acta 2015, 168, 403–413.
[11] A. Lahiri, T. Lu, N. Behrens, N. Borisenko, G. Li, F. Endres, ACS Appl. Mater. Interfaces 2017, 9, 11350−11355.
[12] M. Schmuck, A. Balducci, B. Rupp, W. Kern, S. Passerini, M. Winter, J Solid State Electrochem. 2010, 14, 2203–2207.
[13] M. Shimizu, H. Usui, K. Matsumoto, T. Nokami, T. Itoh, H. Sakaguchi, J. Electrochem. Soc. 2014, 161, A1765–A1771.
[14] H. Usui, Y. Yamamoto, K. Yoshiyama, T. Itoh, H. Sakaguchi, J. Power
Sources 2011, 196, 3911–3915.
[15] M. Shimizu, H. Usui, T. Suzumura, H. Sakaguchi, J. Phys. Chem. C
2015, 119, 2975–2982.
[16] H. Usui, M. Shimizu, H. Sakaguchi, J. Power Sources 2013, 235, 29–35.
[17] H. Usui, T. Masuda, H. Sakaguchi, Chem. Lett. 2012, 41, 521–522.
[18] K. Yamaguchi, Y. Domi, H. Usui, M. Shimizu, K. Matsumoto, T. Nokami, T. Itoh, H. Sakaguchi, J. Power Sources 2017, 338, 103–107.
[19] D. M. Piper, T. Evans, K. Leung, T. Watkins, J. Olson, S. C. Kim, S. S.
Han, V. Bhat, K. H. Oh, D. Buttry, S.-H. Lee, Nat. Commun. 2015, 6, 1– 10.
[20] T. Sugimoto, Y. Atsumi, M. Kono, M. Kikuta, E. Ishiko, M. Yamagata, M. Ishikawa, J. Power Sources 2010, 195, 6153–6156.
[21] Wermelinger, T.; Spolenak, R., J. Raman Spectrosc. 2009, 40, 679–
686.
[22] A. M. Yaremko, V. O. Yukhymchuk, S. S. Ponomaryov, V. V. Koroteev,
V. M. Dzhagan, Y. A. Romanyuk, J. Baran, Solid State Commun. 2014, 195, 39–42.
[23] S. Murugesan, J. T. Harris, B. A. Korgel, K. Stevenson, J. Chem. Mater.
2012, 24, 1306−1315.
[24] T. D. Hatchard, J. R. Dahn, J. Electrochem. Soc. 2004, 151,
A838−A842.
[25] M. Nie, D. P. Abraham, Y. Chen, A. Bose, B. L. Lucht, J. Phys. Chem.
C 2013, 117, 13403−13412.
[26] A. Tokranov, B. W. Sheldon, C. Li, S. Minne, X. Xiao, ACS Appl. Mater.
Interfaces 2014, 6, 6672−6686.
[27] Y. Domi, H. Usui, M. Shimizu, Y. Kakimoto, H. Sakaguchi, ACS Appl. Mater. Interfaces 2016, 8, 7125–7132.
[28] C. C. Nguyen, S.-W. Woo, S.-W. Song, J. Phys. Chem. C 2012, 116,
14764−14771.
[29] T. Jaumann, J. Balach, M. Klose, S. Oswald, U. Langklotz, A. Michaelis, J. Eckert, L. Giebeler, Phys. Chem. Chem. Phys. 2015, 17, 24956– 24967.
[30] V. Etacheri, O. Haik, Y. Goffer, G. A. Roberts, I. C. Stefan, R. Fasching,
D. Aurbach, Langmuir 2012, 28, 965–976.
[31] J. R. Szczech, S. Jin, Energy Environ. Sci. 2011, 4, 56–72.
[32] A. Budi, A. Basile, G. Opletal, A. F. Hollenkamp, A. S. Best, R. J. Rees,
A. I. Bhatt, A. P. O’Mullane, S. P. Russo, P. F. Imide, J. Phys. Chem. C
2012, 116, 19789–19797.
[33] Shkrob, I. A.; Marin, T. W.; Zhu, Y.; Abraham D. P. J. Phys. Chem. C
2014, 118, 19661−19671.
[34] K. Schroder, J. Alvarado, T. A. Yersak, J. Li, N. Dudney, L. J. Webb, Y.
S. Meng, K. Stevenson, J. Chem. Mater. 2015, 27, 5531−5542. [35] M. Terauchi, H. Takahashi, N. Handa, T. Murano, M. Koike, T. Kawachi,
T. Imazono, M. Koeda, T. Nagano, H. Sasai, Y. Oue, Z. Yonezawa, S. Kuramoto, J. Electron Microsc. 2012, 61, 1–8.
Entry for the Table of Contents
ARTICLE
In the FSA-based ionic liquid electrolyte, Si layer was not so much expanded as in the organic electrolyte. In addition, Li-K emission was observed at all SXES measured points, which means that lithiation reaction proceeded uniformly in the Si layer.
Kazuki Yamaguchi, Yasuhiro Domi, Hiroyuki Usui, and Hiroki Sakaguchi*
1 – 7.
Elucidation of the Reaction Behavior of Silicon Negative
Electrodes in a
Bis(fluorosulfonyl)amide-Based Ionic Liquid Electrolyte
10
µ
m
10
µ
m
1 2 3 4Lithiated Si electrode cycled in FSA-based ionic liquid electrolyte
Si layer
Cu substrate
SXES measured point
0.05 0.1 0.15 In te n s it y / a rb . u n it
Emission energy / keV
O Si OC 1 2 3 4 Li S
Emission energy / keV
In te n s it y / a rb . u n it