Disease Burden of Malignant Pleural Mesothelioma:
Taiwan Experiences
Lukas Jyuhn-Hsiarn Lee
※, ※※, ※※※,
Yu-Yin Chang
※, Jung-Der Wang
※※※, ※※※※Abstract
Objectives To quantify the life years gained and lifetime healthcare cost savings
by preventing a case of malignant pleural mesothelioma (MPM).
Methods We retrieved data from the Taiwan Cancer Registry (TCR) and linked
them with the National Mortality Registry to estimate the survival functions for malignant pleural mesothelioma, an asbestos-related malignancy. We also retrieved cases of pleural cancer registered in the catastrophic illnesses of the National Health Insurance Research Database (NHIRD) to cross-validate the results. Assuming a constant excess hazard, we extrapolated lifetime survival function by the Monte Carlo method. For each MPM patient, we simulated an age- and gender-matched person without cancer based on the vital statistics of Taiwan to estimate life expectancy and expected years of life lost (EYLL). By using the reimbursement data from the NHIRD, we calculated the average monthly healthcare expenditures, which were summed to estimate the lifetime healthcare expenditures after adjusting for the corresponding monthly survival probability.
Results A total of 503 cases of MPM were identified in the NHIRD during 1997 ~ ※※※※・Lukas Jyuhn-Hsiarn Lee M.D., Ph.D.
※※※※・Yu-Yin Chang M.Sc. ※※※※・Jung-Der Wang M.D., Sc.D
※※※※※ Division of Environmental Health and Occupational Medicine, National Health Research Institutes, Miaoli, Taiwan.
※※※※※ Department of Environmental and Occupational Medicine, Department of Neurology,
National Taiwan University Hospital, Taipei, Taiwan.
※※※※※ Institute of Occupational Medicine and Industrial Hygiene, College of Public Health,
National Taiwan University, Taipei, Taiwan.
※※※※※ Department of Public Health, College of Medicine and Hospital, National Cheng Kung
University Tainan, Taiwan.
© The Policy Science Association of Ritsumeikan University:
2008. The average EYLL was predicted to be 15.1 (95% confidence interval [CI]: 14.1 ~ 16.1) years, and the lifetime healthcare expenditures with a 3% annual discount were predicted to be $19,615 (95% CI: 14,505.3 ~ 24,724.7) US dollars.
Conclusions The burden of MPM, in terms of EYLL and lifetime healthcare
expenditures, was substantial. Such estimates may provide useful empirical evidence for clinical and health policy-making.
Key words : malignant pleural mesothelioma (MPM), asbestos, expected years of life lost (EYLL), life expectancy, lifetime healthcare expenditure
Abbreviations:
CI confidence interval EYLL expected years of life lost
ICD-9-CM International Classification of Diseases, Ninth Revision, Clinical Modification
ICD-O International Classification of Diseases for Oncology MPM malignant pleural mesothelioma
NHI National Health Insurance
NHIRD National Health Insurance Research Database TCR Taiwan Cancer Registry
INTRODUCTION
Malignant pleural mesothelioma (MPM) is an aggressive neoplasm of the serosal lining of the pleural cavity arising from mesothelial cells (1, 2). Patients with MPM have poor prognosis and the median survival time was reported between 8 ~ 19 months even with advanced treatment (3, 4). MPM has become a major public health problem worldwide because of its global epidemic associated with previous usage of asbestos (5-9). In many developed countries, the expected number of MPM-related deaths is projected to increase up to a peak in the next several decades (10-12). Unfortunately, asbestos are still imported and in use in almost all counties in Eastern Europe, Latin America, Africa, and Asia, including China, Thailand, and Taiwan (13, 14). In Taiwan, an increasing trend of incidence of malignant mesothelioma both in males and females has been observed (15), even though the incidence rate seems not so high, i.e., 1.14 cases per million per year (16), near the background incidence (1 ~ 2 cases/million/year) in the western countries. The low incidence rates of mesothelioma in Taiwan and many other countries in Asia is likely due to the limited public health infrastructure that
mesothelioma has been under-reported or even no reliable incidence data are available. The Asian countries where asbestos is still in use but have not reported asbestos-related diseases properly are likely to be the areas where the asbestos epidemic is just beginning to develop currently with insufficient latency period (5).
A body of evidence has indicated a causal link between exposure to asbestos and the development of MPM (17, 18). An international analysis demonstrates an ecological association between increased risk of mesothelioma and population exposure to asbestos over the past three to four decades (8). Because MPM is primarily caused by asbestos exposure (3, 17, 18), it can be considered as a signal tumour of exposure to asbestos (19). A recent study in the UK estimated the attributable fraction of asbestos among male mesothelioma cases from occupational, paraoccupational and environmental sources to be 96 ~ 98% (20). In contrast, another study suggested a more limited role of occupational exposure to asbestos in the aetiology of peritoneal mesothelioma than for pleural mesothelioma (21). There is also diagnostic uncertainty in classification of peritoneal tumour based on the International Classification of Diseases, Ninth Revision, Clinical Modification (ICD-9-CM) code because ovarian and gastrointestinal tumours may be misdiagnosed as peritoneal mesothelioma and vice versa (21, 22). Among peritoneal mesothelioma, well-differentiated papillary and cystic mesotheliomas are unrelated to asbestos exposure, and usually occur in women and have a good prognosis (3, 22). Thus, it is reasonable to use MPM as the malignancy of interest closely related to asbestos exposure. The burden of disease caused by asbestos have a substantial impact on quality and quantity of life in general population with potential exposure from the workplace and residential environment, as well as may exert financial impact on patients, their families and the society. However, the economic costs of asbestos-related diseases to the society remain to be elucidated (23, 24). It is important to quantify the disease burden caused by MPM to facilitate the outcome research and cost-effectiveness analysis for prevention of asbestos-related diseases. We therefore conducted this study to estimate the expected years of life lost (EYLL) and lifetime direct medical costs for a case of MPM in Taiwan.
METHODS
This study began after the approval of the Institutional Review Board of the National Taiwan University Hospital (NTUH IRB no. 200808029R) and National Health Research Institutes (NHRI IRB no. EC0991104-E). We used two different
datasets to cross-validate the estimation of the survival functions in this study: the Taiwan Cancer Registry (TCR) and the National Health Insurance Research Database (NHIRD).
Taiwan Cancer Registry (TCR)
We analysed information on the cases registered in the TCR between January 1997 and December 2005. We identified all cases of histopathologically verified malignant pleural mesothelioma (MPM), coded according to the International Classification of Diseases for Oncology (ICD-O) (25), i.e., ICD-O code 163 for cancer site of the pleura, and morphology codes 9050/3, 9051/3, 9052/3, and 9053/3. Only patients aged 18 years or older with definite histopathological evidence of MPM were included in this study.
A total of 144 patients were identified with the diagnoses MPM from 1 January 1997 to 31 December 2005. The dataset was then linked with the National Mortality Registry database to verify the vital status for each case until the end of 2007.
National Health Insurance Research Database (NHIRD)
The reimbursement data of the NHIRD for the period from 1997 to 2008, which contained data for all outpatients and inpatients with diagnoses of pleural cancer, were also utilised. Taiwan established a single-payer, universal National Health Insurance (NHI) program in 1995. By 2009, the NHI covered 99% of Taiwan s twenty-three million people (26, 27). The NHIRD consists of original claims data for reimbursement and a registry of all enrolees, which allowed researchers to trace all medical services received by enrolees under the NHI program. To secure the protection of personal confidentiality, all the personal identification numbers were encrypted, and the reimbursement data were transformed into a research database, namely the NHIRD, which were regularly maintained by the National Health Research Institutes. Taiwan s NHI covers almost all healthcare services for catastrophic illnesses, except some novel technologies and medications for which there is no evidenced-based consensus on their effectiveness. As all types of cancer can be registered as a catastrophic illness and treated without copayments, the criteria for the registration were very strict and established by the medical specialty boards and the Bureau of NHI. Based on the annual reports of TCR, MPM accounted for the majority (about 80%
of all pathological types) of malignant neoplasm of the pleura (28). We thus assumed that the pleural cancer, which was coded as ICD-9-CM code 163 in the NHIRD, was MPM for the purpose of cost estimation. Therefore, we only included the cases of MPM (or pleural cancer) that were successfully registered in the dataset of catastrophic illnesses from 1 January 1997 to 31 December 2008.
Extrapolation method to obtain lifetime survival functions
Monte Carlo simulation was used to extrapolate survival for up to 50 years to derive the lifetime survival function after the diagnosis of MPM. Briefly, the survival function for an age- and gender-matched reference population was generated using the Monte Carlo method from the life tables of the general population of Taiwan in the corresponding year. The life tables of the general population were obtained from vital statistics published annually by the Department of Statistics, Ministry of the Interior, Executive Yuan of Taiwan. Because individual survival time of subjects in a hypothetical cohort cannot be directly derived from the life tables of the general population, we used a Monte Carlo method to generate the simulated remaining survival time of age- and gender-matched hypothetical subjects for each patient in the MPM cohort.
The lifetime survival of the patients with cancer (up to 50 years) was obtained using linear extrapolation of a logit-transformed curve of the survival ratio between the cancer cohort and reference population, under the assumption of a constant excess hazard mode (29, 30). The technical details were summarised as follows:
The survival ratio between the survival functions of the patient and the age- and sex-matched reference populations is defined by the formula: W (t) = S (t | patient population) /S (t | reference population). Because the patient with MPM generally has a worse survival than the reference population, the value of W (t) initially equals 1 in the beginning of the follow-up (at the time point of diagnosis), and then gradually decrease due to disease-associated excess mortality. The value of W (t) ranges between 0 and 1, so direct linear regression for its temporal trend is not applicable. We therefore used the logit transformation of W (t), i.e., logit W (t) = log[W (t) / (1-W (t) ) ]. A higher logit W (t) value corresponds to a higher W (t) value, but the range of values was transformed from 0 ~ 1 to that of -∞ ~+ ∞ . Furthermore, if the disease-associated excess hazard remains constant over time, the curve of the logit of W (t) will converge to a straight line, as proven mathematically by Fang et al (29).
In practice, the extrapolation process consists of three steps. First, a plot of logit W (t) over time is created. The time point Ts after which the logit W (t) curve becomes a nearly straight line is then identified. Second, we fit a simple linear regression for logit W (t) from Ts to the end of follow-up Tf , that is:
where the noise term Nt is independently and normally distributed with mean 0 and variance δ2. Finally, given the least squares estimates of the two
parameters, α and β , the long-term survival curve of patient population beyond the follow-up limits is projected as:
The standard error of survival estimates was obtained through a bootstrap method by implementing the extrapolation process with data simulated by repeatedly sampling with replacement from the real dataset 100 times.
Estimation of the expected years of life lost (EYLL)
The EYLL for a specific disease was defined as the lifetime survival difference between the disease cohort and an age- and gender-matched reference population. EYLL provides us with an estimation of the magnitude to which a patient s life is shortened by the malignancy and therefore it can be regarded as an indicator of the total cancer burden as experienced by the society as a whole (31). We estimated the average EYLL by calculating the difference in the areas under the long-term survival curves between the cohort of cancer patients and the age- and gender-matched reference population. To facilitate the estimation, we used the ISQoL software, which was built in the R statistical package and can be freely downloaded from http://www.stat.sinica.edu.tw/jshwang.
Measurement of lifetime direct medical costs
In this study, we aimed to estimate the lifetime direct medical cost from the perspective of NHI for a case of MPM. We used the NHIRD data for the period from 1 January 1997 to 31 December 2008 to establish the cohort of MPM patients for the estimation of the lifetime healthcare expenditures. The total
t
t
t
W
t
W
Ν
+
+
=
¸¸
¹
·
¨¨
©
§
−
(
)
α
β
1
)
(
log
, for Ts
≤ t ≤ Tf
(
t
index
) (
S
t
ref
)
(
(
t
)
t
)
S
β
α
β
α
+
+
+
=
exp
1
exp
|
|
for t > Tf .
lifetime direct medical cost of a patient refers to all the direct healthcare expenditures paid by the NHI from the date of cancer diagnosis until the date of death. Patients that were alive at the end of 2008 were censored. The dates of death were retrieved from hospitalisation files and the catastrophic illness registration files. By retrieving the reimbursement data from the NHIRD, we were able to calculate the average healthcare expenditures spent by the patients at each time period t, which can be summed for the lifetime after adjusting for the corresponding survival probability at time t. The effective sample size in each month in the follow-up period was applied for the calculation of the average monthly healthcare expenditure using the SAS software. The lifetime healthcare expenditure per case was estimated by total cumulative sum of the product of the average monthly healthcare expenditure multiplied by the corresponding monthly mean survival probability (32), adjusting for the annual discount rate. To illustrate the temporal relationship of lifetime healthcare expenditures, we plotted the dynamic changes of total reimbursed expenditures for clinic services or emergency room visits, and hospitalisation care since the diagnosis of MPM.
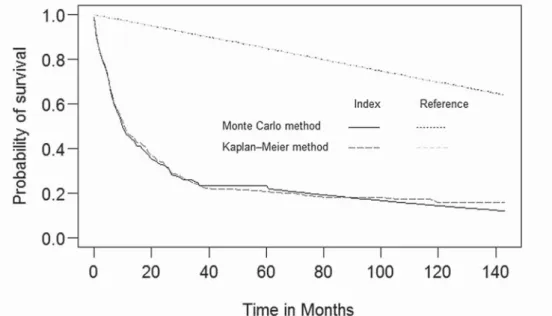
Validation of the Monte Carlo Extrapolation by Comparison with the Kaplan-Meier Method
Empirical data from the NHIRD provided an opportunity to cross-validate the estimation of survival functions and the actual performance of the Monte Carlo extrapolation. We first included a sub-cohort of patients diagnosed with MPM between 1 January 1997 and 31 December 2001. The sub-cohort was initially followed until the end of 2001, or for a period of 5 years. Then, we extrapolated the data through the end of 2008 or for an additional period of 7 years, using the Monte Carlo method to estimate the mean survival in month. For the cohort that was completely followed to the end of 2008, the non-parametric Kaplan-Meier estimator was applied to calculate the mean survival month based on a follow-up of 12 years as the gold standard for comparison. We presented the relative bias to show the differences between the Kaplan-Meier estimates and those of the Monte Carlo extrapolation method for the NHIRD. We carefully performed validation for MPM patients registered in the NHIRD by plotting the survival curves of the Monte Carlo simulation in comparison with the Kaplan-Meier method. Such a validation was not performed on the TCR data because of the relatively small sample size (71 cases of MPM during 1997-2001).
Statistical analysis
The statistical analyses and Kaplan-Meier survival analysis were performed using the SAS software, version 9.2 (SAS Institute Inc., Cary, NC, USA). To apply Monte Carlo simulation, we used the ISQoL software (available from http://www. stat.sinica.edu.tw/jshwang) for the estimation of lifetime survival functions and the calculation of EYLL and lifetime healthcare expenditures. We also performed sensitivity analyses considering an annual discount rate of 3% and 5% and with a disease duration that included the three months before the date of cancer diagnosis.
RESULTS
The descriptive characteristics of the MPM patients are summarised in Table 1. The MPM cohort was composed of 144 histopatholigcally verified patients in the TCR during 1997 ~ 2005, while the number recorded in the NHIRD during 1997 ~ 2008 was 503. It was likely due to the difficulty in diagnosing this cancer solely based on pathology, as well as under-reporting and/or misdiagnosis of MPM in the cancer registry. All the estimates were slightly different, although they showed a similar trend of substantial burden of disease. For example, the successful prevention for MPM would save 15.1 life-years per case, as shown in Figure 1, plus the estimated lifetime healthcare expenditures, $19,615 US dollars, at an annual discount rate of 3%, while those based on the TCR were 19.1 life-years and $15,966 US dollars. The sensitivity analyses with different discount rates and disease costs, either after cancer diagnosis or with a disease duration that included three months prior to diagnosis, did not have a large effect.
The survivals based on the sub-cohorts of cancer patients established in the 5-year period were extrapolated to an additional 7 years using the Monte Carlo method and then compared with the actual survival months calculated by the Kaplan-Meier method that used the complete 12-year follow-up from 1997 to 2008, as shown in Figure 2. The relative bias for the two methods based on the NHIRD was less than 2%, which indicated a high agreement, as summarised in Table 2.
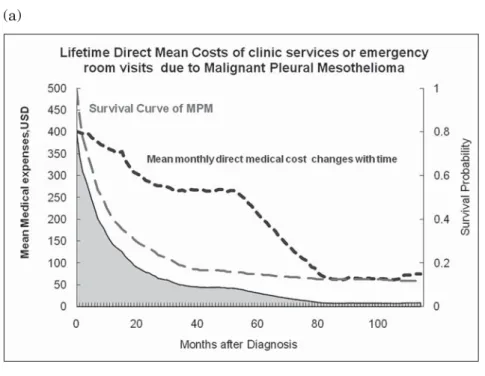
Figure 3 illustrates temporal changes of mean monthly direct medical costs with time since diagnosis for clinic services or emergency room visits, and for hospitalisation due to MPM, based on the analysis of reimbursement data of the NHIRD. Generally, the healthcare expenditures in the initial phase when the
cancer was first diagnosed were the highest. From the cost changes of the clinic services or emergency room visits, we observed a period of relative increase in healthcare expenditures from 40 to 55 months since diagnosis. It may suggest that direct medical costs would elevate because of the increased need of clinic services or more frequent emergency room visits as the patients survived into the terminal phase of disease course, which corresponded to the life expectancy of 3.6 years or 43 months (95% CI: 32 ~ 55 months).
DISCUSSION
Our study illustrated a practical approach to estimate EYLL and lifetime healthcare expenditures for MPM using data from administrative databases. A particular strength of this study is the use of two separate national, population-based databases, the TCR and NHIRD, with all registered cancer patients and a long follow-up period (1997 ~ 2005, and 1997 ~ 2008, respectively). This enabled us to cross-validate the estimates. Life expectancy estimates for MPM from the two databases were relatively close, about a one-year difference, implying the validity and comparability of both datasets and the consistency of estimation methods. However, there was a difference of EYLL for mesothelioma estimated from the TCR and NHIRD (19.1-15.1 = 4 years). The difference is likely attributed mainly to the different mean ages at diagnosis, i.e., 64.4-59.8 = 4.6 years. The MPM patients included in the TCR dataset were those with histopathological evidence of disease and were approximately 4 years younger than those registered in the NHIRD. We therefore tentatively concluded that the estimates of two datasets, NHIRD and TCR, and the extrapolation method used in this study seem acceptable.
Based on a more conservative estimate between the two datasets, the successful prevention of MPM would produce substantial health benefits, a gain of 15.1 life years per case for the society and financial saving of $19615 US dollars for the NHI. With the advanced development of new technologies, medications, and therapies in cancer treatment, the survival of cancer patients will be improved and healthcare expenditures will increase. Thus, the current estimates would be lower than the true value of the healthcare expenditure paid by the NHI in the future.
For comparative risk assessment, we proposed the use of life years or quality-adjusted life years (33) gained and financial savings of healthcare expenditures as the metric of outcome evaluation for comparison with other benefits gained
through different policy investments. As the call for a globally total ban on asbestos is growing louder than ever, there is also a voice on economic benefits from the asbestos industry. The above figures could be used as a lower bound for investment of implementing comprehensive controls to prevent asbestos exposure, such as protection of the front-line workers who may be in contact with asbestos in building modifications and demolition projects (34). In general, if an effective prevention program costs more than it were estimated to save, the residual money can be divided by the number of life years saved to obtain the estimate of cost-effectiveness, or cost per life year gained, which can be directly compared with different policy decisions. Moreover, a total ban or strict enforcement of the national occupational standard for asbestos may provide additional benefits of the savings of human capital loss (indirect costs) plus the health benefits of preventing non-cancer outcomes (e.g., asbestosis, pleural plaque) related to the same exposure, as well as the avoidance of human suffering among cancer patients and their families (35).
Asbestos accounts for more than half of the work-related cancer deaths in industrialised countries, such as United Kingdom (36). In principle, occupational and environmental cancers are potentially preventable (37, 38), and a substantial percentage of cancer occurrences could be prevented through appropriate regulatory strategies in occupational health (20, 39). Many countries are now experiencing part of a worldwide epidemic of asbestos-related diseases, especially MPM. Moreover, one mesothelioma case has been overlooked for every four to five reported cases, and therefore a signification proportion of mesothelioma were under-reported globally (40). The future trend of MPM epidemic has been predicted globally (41) and in many industrialized countries, including Western European (10) (Britain (7, 42), France (43), Germany, Italy (44), Netherlands (45) and Switzerland), Denmark (46), Norway (47), United States (48), Australia (49), Japan (50) and Hong Kong (51). For example, Driscoll et al. reported 43,000 mesothelioma deaths per year worldwide due to exposure to asbestos (41), while Park et al. estimated the global burden of mesothelioma to be 213,200 during 1994 ~ 2008, which is equivalent to an annual average of approximately 14,200 cases (40). In Japan, analyses using an age-cohort model showed there would be about 100,000 deaths due to MPM in the next 40 years (50). In Great Britain, projection of male mesothelioma using Bayesian methods reported that 91,000 deaths of male mesothelioma are predicted to occur from 1968 to 2050 with around 61,000 of these occurring from 2007 onwards (42). All forms of asbestos are now banned successfully in 55 countries worldwide (52). Unfortunately, there
are still a considerable number of countries, particularly in Asia, where asbestos are still imported and used in various industries; for these countries the number of exposed workers are unknown and asbestos-related deaths are under-reported (16, 40, 53). Economic theory suggests that, where the costs of a health hazard are not fully recognised and where an industry is allowed to externalise these costs, it will operate on an inappropriately large scale. The global historical pattern of asbestos use was consistent with the environmental Kuznets curve, in which asbestos use peaked when incomes attained 10,000 ~ 15,000 Geary– Khamis dollars (GKD) and essentially ceased at income levels over 20,000 GKD (54). Therefore, such a huge economic burden of asbestos to the whole society had better be expressed in monetary unit and directly compared with the industrial benefits of asbestos to facilitate the total ban of asbestos and elimination of future burden of asbestos-related diseases.
Limitations
This study has the following limitations that should be addressed. Firstly, we adopted the insurer s perspective, and only direct medical costs were estimated in this study. Based on the estimates of U.S. National Institutes of Health, the 2010 overall annual costs of cancer were $263.8 billion; all healthcare expenditures were $102.8 billion, and indirect morbidity costs and mortality costs accounted for more than 50% of the total costs of cancer (55). Moreover, direct medical costs, as suggested by the U.S. Environmental Protection Agency, often provide a lower-bound estimate of the costs of illness (56). Due to the lack of empirical data on the costs of lost productivity due to illness or premature death, our results underestimate the cost of illness to the whole society. Because the estimation of cost of illness is generally a lower bound of that of applying the willingness-to-pay method, it implies that our results leave the true figure to some extent. However, since we have quantified the EYLL, one may also use these estimates for calculating the cost-effectiveness ratio for a prevention program that is able to provide the expected number of prevented cancer cases.
Secondly, because the data from the NHIRD were collected primarily for health insurance administration use, we are concerned that the follow-up of patient survival status may not be comprehensive. As compared with survival analysis in the TCR, the estimates based on the NHIRD were more likely to be more conservative, or lower values of estimation. Using the Kaplan-Meier method as the gold standard, we have validated that there is relatively little bias
in calculating the survival functions using the Monte Carlo method based on the NHIRD data (Table 2 and Figure 2).
Thirdly, the data on disease severity, including cancer staging, and a patient s socioeconomic status were not available in both databases; these factors may influence the prognosis of cancer and lifetime cost estimation. Future studies are needed to address the potential effects of these factors, including establishment of the NHI on survival and life expectancy for communities with different socioeconomic statuses.
Fourthly, asbestos-related diseases include MPM, lung cancer, asbestosis, pleural effusion, discrete pleural plaques or diffuse benign pleural fibrosis and rolled atelectasis (12). Only MPM was included in this study because its highly-specific causal relationship with exposure to asbestos (20), which obviously represented a limited proportion of the burden of asbestos-related disease. For example, 5 ~ 7% of all lung cancers can be attributable to occupational exposures to asbestos, in addition to mesotheliomas (9). Moreover, there were no available data regarding the occupational exposure to carcinogens in the databases that were used in this study. Cancers caused by occupational agents tend to affect younger individuals, especially if the initial exposure to the carcinogen occurs early in their working life (57). Therefore, EYLL and the cost in occupational cancer will be higher than non-occupationally related cancers. The estimates, based on all cases of cancer, are more likely an underestimation of the prevention benefits of occupational cancers.
CONCLUSIONS
In conclusion, we have proposed a practical approach for measuring EYLL and the lifetime healthcare expenditures for MPM, based on the analyses of population-based, administrative databases. The same method could be applied in other countries where the administrative databases are accessible to researchers. The total ban of asbestos, including import and use of all forms of asbestos in our environment can prevent future occurrence of MPM, to save 15.1 life year, and $19,615 US dollars per case of MPM. The quantification of the financial burden in the perspective of NHI in this study does not include human capital cost, and is an obvious underestimation of total costs incurred by the society as a whole. With the empirical evidence of the financial burden from MPM and the loss of EYLL to the society, we hope that the global ban of asbestos can be implemented soon.
Table 1. Characteristics of malignant pleural mesothelioma (MPM) cohort and estimated lifetime healthcare expenditures based on Taiwan Cancer Registry (TCR) and National Health Insurance Research Database (NHIRD)
Characteristics Malignant Pleural Mesothelioma
NHIRD 1997-2008
TCR 1997-2005
Number 503 144
Age, mean m SD (years) [range]
64.4± 14.9 [22-97]
59.8± 14.9 [20-97]
Median survival (month) 8.4 6.1
Male % 64.8 72.9
Life expectancy (years) [95% CI] 3.6 [2.6-4.6] 2.4 [1.1-3.7] Expected years of life lost [95% CI] 15.1[14.1-16.1] 19.1 [17.7-20.5]
Lifetime healthcare expenditures (USD) Mean ± SE
Discount 3%
After cancer diagnosis 19,615± 2,607 15,966± 3,063 Included duration 3 mo before diagnosis 19,941± 2,607 16,227± 3,063 Discount 5%
After cancer diagnosis 19,420± 2,542 15,640± 2,998 Included duration 3 mo before diagnosis 19,746± 2,476 15,966± 2,998
1 US Dollar (USD) =29.322 New Taiwan Dollar (NTD) in 2010 95% Confidence Interval (CI)
Standard deviation (SD) Standard error (SE)
Table 2. Estimates of mean survival months of malignant pleural mesothelioma (MPM) in 12 years of follow-up using the Monte Carlo method based on the first 5 years of follow-up data for the National Health Insurance Research Database (NHIRD) were compared with the Kaplan-Meier estimates based on 12 years of follow-up (1997 ~ 2008)
NHIRD
Cancer site
12-year follow-up Extrapolation based on the first 5-year follow-up
Kaplan–Meier method Monte Carlo method Mean (month) Mean (month) Standard error (month) Relative bias (%) MPM 36.1 35.5 5.7 -1.66
Figure 1. The shaded area shows the expected yeas of life lost, 15.1 (95% confidence internal 14.1 ~ 16.1) years, due to malignant pleural mesothelioma compared with the gender-, age-matched reference population estimated by the Monte-Carlo simulation.
Figure 2. Plots of survival curves for validation of the Monte Carlo extrapolation from the first 5 years to the 12 years of follow-up in comparison with the Kaplan-Meier estimates for the National Health Insurance Research Database (NHIRD)
(a)
(b)
Figure 3. Temporal changes of total direct medical costs for (a) clinic services or emergency room visits or (b) hospitalisation due to malignant pleural mesothelioma
Appendix Figure 1. Distribuation of cases of malignant pleural mesothelioma (MPM) diagnosed in the calendar years, for the Taiwan Cancer Registry (TCR) during 1997 ~ 2005, and the National Health Insurance Research Database (NHIRD) during 1997 ~ 2008 14 10 12 21 14 16 21 14 22 35 43 40 30 32 46 42 43 41 41 58 52
TCR NHIRD
Acknowledgements
We thank the Bureau of Health Promotion, Department of Health of Taiwan, for provision of the data from the Taiwan Cancer Registry. We are grateful that the National Health Research Institutes (NHRI) of Taiwan for funding this research (intramural project EO-100-EO-PP04). The interpretation and conclusions contained herein do not represent those of Bureau of National Health Insurance, Department of Health or National Health Research Institutes.
Competing interests: None
Funding: This study was supported by the National Health Research Institutes
(NHRI) intramural project EO-100-EO-PP04.
References
1. O'Byrne K, Rusch VW. Malignant pleural mesothelioma. Oxford: Oxford University Press; 2006.
2. Hoang CD, D'Cunha J, Kratzke MG, Casmey CE, Frizelle SP, Maddaus MA, et al. Gene expression profiling identifies matriptase overexpression in malignant mesothelioma. Chest. 2004;125 (5) :1843-52. Epub 2004/05/12.
3. BTS statement on malignant mesothelioma in the UK, 2007. Thorax. 2007;62 Suppl 2:ii1-ii19. Epub 2007/11/28.
4. Nakano T. Current therapies for malignant pleural mesothelioma. Environ Health Prev Med. 2008;13 (2) :75-83. Epub 2008/03/01.
5. LaDou J. The asbestos cancer epidemic. Environ Health Persp. 2004;112 (3) :285-90. Epub
Appendix Figure 2. Logit of the survival ratio of the cohort of malignant pleural mesothelioma (MPM) and the reference population for check-up of the assumption of constant excess hazard in the Taiwan Cancer Registry (TCR) and the National Health Insurance Research Database (NHIRD)
2004/03/05.
6. Takahashi K. Asbestos-related diseases: time for technology sharing. Occupational medicine. 2008;58 (6) :384-5. Epub 2008/08/30.
7. Peto J, Hodgson JT, Matthews FE, Jones JR. Continuing increase in mesothelioma mortality in Britain. Lancet. 1995;345 (8949) :535-9. Epub 1995/03/04.
8. Lin RT, Takahashi K, Karjalainen A, Hoshuyama T, Wilson D, Kameda T, et al. Ecological association between asbestos-related diseases and historical asbestos consumption: an international analysis. Lancet. 2007;369 (9564) :844-9.
9. Tossavainen A. Global use of asbestos and the incidence of mesothelioma. Int J Occup Environ Health. 2004;10 (1) :22-5. Epub 2004/04/09.
10. Peto J, Decarli A, La Vecchia C, Levi F, Negri E. The European mesothelioma epidemic. British journal of cancer. 1999;79 (3-4) :666-72. Epub 1999/02/23.
11. Hodgson JT, McElvenny DM, Darnton AJ, Price MJ, Peto J. The expected burden of mesothelioma mortality in Great Britain from 2002 to 2050. British journal of cancer. 2005;92 (3) :587-93. Epub 2005/01/26.
12. Jamrozik E, de Klerk N, Musk AW. Asbestos-related disease. Intern Med J. 2011;41 (5) :372-80. Epub 2011/02/12.
13. LaDou J, Castleman B, Frank A, Gochfeld M, Greenberg M, Huff J, et al. The case for a global ban on asbestos. Environ Health Persp. 2010;118 (7) :897-901. Epub 2010/07/06. 14. Virta RL. Worldwide Asbestos Supply and Consumption Trends from 1900 through 2003
2006. [accessed 2011 27 September]; Available from: http://pubs.usgs.gov/circ/2006/1298/ c1298.pdf.
15. Lee LJ, Chang YY, Wang JD. Impact of malignant mesothelioma in Taiwan: a 27-year review of population-based cancer registry data. Lung Cancer. 2010;68 (1) :16-9. Epub 2009/06/19. 16. Le GV, Takahashi KEN, Park E-K, Delgermaa V, Oak C, Qureshi AM, et al. Asbestos use and
asbestos-related diseases in Asia: Past, present and future. Respirology. 2011;16 (5) :767-75. 17. Bianchi C, Bianchi T. Malignant mesothelioma: global incidence and relationship with
asbestos. Ind Health. 2007;45 (3) :379-87. Epub 2007/07/20.
18. Jaurand MC, Fleury-Feith J. Pathogenesis of malignant pleural mesothelioma. Respirology. 2005;10 (1) :2-8. Epub 2005/02/05.
19. Mark EJ, Kradin RL. Pathological recognition of diffuse malignant mesothelioma of the pleura: the significance of the historical perspective as regards this signal tumor. Semin Diagn Pathol. 2006;23 (1) :25-34. Epub 2006/10/19.
20. Rushton L, Bagga S, Bevan R, Brown TP, Cherrie JW, Holmes P, et al. Occupation and cancer in Britain. Br J Cancer. 2010;102 (9) :1428-37. Epub 2010/04/29.
21. Burdorf A, Jarvholm B, Siesling S. Asbestos exposure and differences in occurrence of peritoneal mesothelioma between men and women across countries. Occupational and environmental medicine. 2007. Epub 2007/06/15.
22. Bridda A, Padoan I, Mencarelli R, Frego M. Peritoneal mesothelioma: a review. MedGenMed. 2007;9 (2) :32. Epub 2007/10/24.
23. Watterson A, Gorman T, Malcolm C, Robinson M, Beck M. The economic costs of health service treatments for asbestos-related mesothelioma deaths. Annals of the New York Academy of Sciences. 2006;1076:871-81. Epub 2006/11/23.
24. Siskind FB. The cost of compensating asbestos victims under the Occupational Disease Compensation Act of 1983. Risk Anal. 1987;7 (1) :59-69. Epub 1987/03/01.
25. Department of Health. Chinese translation version of the International Classification of Disease for Oncology. 2nd ed: Department of Health of Taiwan; 1997.
26. National Heath Insurance in Taiwan 2009: Bureau of National Health Insurance; 2009. [accessed 2011 5 October]; Available from: http://www.nhi.gov.tw/Resource/webdata/ Attach_13787_1_NationalHealthInsuranceinTaiwan2009.pdf.
27. Lee YC, Huang YT, Tsai YW, Huang SM, Kuo KN, McKee M, et al. The impact of universal National Health Insurance on population health: the experience of Taiwan. BMC Health Serv Res. 2010;10:225. Epub 2010/08/05.
28. TCR. Taiwan Cancer Registry. 2011 [accessed 2011 22 September]; Available from: http://crs. cph.ntu.edu.tw/main.php?Page=N1
29. Fang CT, Chang YY, Hsu HM, Twu SJ, Chen KT, Lin CC, et al. Life expectancy of patients with newly-diagnosed HIV infection in the era of highly active antiretroviral therapy. Qjm. 2007;100 (2) :97-105. Epub 2007/02/06.
30. Hwang JS, Wang JD. Monte Carlo estimation of extrapolation of quality-adjusted survival for follow-up studies. Statistics in medicine. 1999;18 (13) :1627-40. Epub 1999/07/17.
31. Brown ML, Lipscomb J, Snyder C. The burden of illness of cancer: economic cost and quality of life. Annu Rev Public Health. 2001;22:91-113. Epub 2001/03/29.
32. Lin DY, Feuer EJ, Etzioni R, Wax Y. Estimating medical costs from incomplete follow-up data. Biometrics. 1997;53 (2) :419-34. Epub 1997/06/01.
33. Lee LJ, Chen CH, Chang YY, Liou SH, Wang JD. An estimation of the health impact of groundwater pollution caused by dumping of chlorinated solvents. Sci Total Environ. 2010;408 (6) :1271-5. Epub 2010/01/12.
34. Olsen NJ, Franklin PJ, Reid A, de Klerk NH, Threlfall TJ, Shilkin K, et al. Increasing incidence of malignant mesothelioma after exposure to asbestos during home maintenance and renovation. Med J Aust. 2011;195 (5) :271-4. Epub 2011/09/08.
35. Kauppinen T, Saalo A, Pukkala E, Virtanen S, Karjalainen A, Vuorela R. Evaluation of a national register on occupational exposure to carcinogens: effectiveness in the prevention of occupational cancer, and cancer risks among the exposed workers. Ann Occup Hyg. 2007;51 (5) :463-70. Epub 2007/07/13.
36. Rushton L, Hutchings S, Brown T. The burden of cancer at work: estimation as the first step to prevention. Occup Environ Med. 2008;65 (12) :789-800. Epub 2007/12/15.
37. Christiani DC. Combating environmental causes of cancer. N Engl J Med. 2011;364 (9) :791-3. Epub 2011/03/04.
38. Boffetta P. Epidemiology of environmental and occupational cancer. Oncogene. 2004;23 (38) :6392-403. Epub 2004/08/24.
39. Hutchings S, Rushton L. Toward risk reduction: predicting the future burden of occupational cancer. American journal of epidemiology. 2011;173 (9) :1069-77. Epub 2011/03/31.
40. Park EK, Takahashi K, Hoshuyama T, Cheng TJ, Delgermaa V, Le GV, et al. Global magnitude of reported and unreported mesothelioma. Environ Health Persp. 2011;119 (4) :514-8. Epub 2011/04/06.
41. Driscoll T, Nelson DI, Steenland K, Leigh J, Concha-Barrientos M, Fingerhut M, et al. The global burden of disease due to occupational carcinogens. Am J Ind Med. 2005;48 (6) :419-31. Epub 2005/11/22.
42. Tan E, Warren N, Darnton AJ, Hodgson JT. Projection of mesothelioma mortality in Britain using Bayesian methods. British journal of cancer. 2010;103 (3) :430-6. Epub 2010/07/16. 43. Ilg AG, Bignon J, Valleron AJ. Estimation of the past and future burden of mortality from
mesothelioma in France. Occupational and environmental medicine. 1998;55 (11) :760-5. Epub 1999/01/30.
44. Marinaccio A, Montanaro F, Mastrantonio M, Uccelli R, Altavista P, Nesti M, et al. Predictions of mortality from pleural mesothelioma in Italy: a model based on asbestos consumption figures supports results from age-period-cohort models. International journal of cancer 2005;115 (1) :142-7. Epub 2005/01/13.
45. Segura O, Burdorf A, Looman C. Update of predictions of mortality from pleural mesothelioma in the Netherlands. Occupational and environmental medicine. 2003;60 (1) :50-5. Epub 2002/12/25.
46. Kjaergaard J, Andersson M. Incidence rates of malignant mesothelioma in Denmark and predicted future number of cases among men. Scandinavian journal of work, environment & health. 2000;26 (2) :112-7. Epub 2000/05/19.
47. Ulvestad B, Kjaerheim K, Moller B, Andersen A. Incidence trends of mesothelioma in Norway, 1965-1999. International journal of cancer 2003;107 (1) :94-8. Epub 2003/08/20. 48. Price B, Ware A. Mesothelioma trends in the United States: an update based on
Surveillance, Epidemiology, and End Results Program data for 1973 through 2003. American journal of epidemiology. 2004;159 (2) :107-12. Epub 2004/01/14.
49. Leigh J, Driscoll T. Malignant mesothelioma in Australia, 1945-2002. Int J Occup Environ Health. 2003;9 (3) :206-17. Epub 2003/09/12.
50. Murayama T, Takahashi K, Natori Y, Kurumatani N. Estimation of future mortality from pleural malignant mesothelioma in Japan based on an age-cohort model. Am J Ind Med. 2006;49 (1) :1-7. Epub 2005/12/20.
51. Tse LA, Yu IT, Goggins W, Clements M, Wang XR, Au JS, et al. Are current or future mesothelioma epidemics in Hong Kong the tragic legacy of uncontrolled use of asbestos in the past? Environ Health Persp. 2010;118 (3) :382-6. Epub 2010/01/13.
52. Kazan-Allen L. Current Asbestos Bans and Restrictions. Compiled by Laurie Kazan-Allen. (Revised Jan 6, 2011) 2011 [accessed 2011 27 September]; Available from: http:// ibasecretariat.org/alpha_ban_list.php.
53. Nishikawa K, Takahashi K, Karjalainen A, Wen CP, Furuya S, Hoshuyama T, et al. Recent mortality from pleural mesothelioma, historical patterns of asbestos use, and adoption of bans: a global assessment. Environ Health Persp. 2008;116 (12) :1675-80. Epub 2008/12/17. 54. Le GV, Takahashi K, Karjalainen A, Delgermaa V, Hoshuyama T, Miyamura Y, et al.
National Use of Asbestos in Relation to Economic Development. Environ Health Perspect. 2010;118 (1) :116-9.
55. ACS. Economic Impact of Cancer. American Cancer Society; 2009 [updated 05/20/2009; accessed 2011 August 2]; Available from: http://www.cancer.org/cancer/cancerbasics/ economic-impact-of-cancer.
56. USEPA. Cost of Illness Handbook. U.S. Environmental Protection Agency; [accessed 2011 August 2]; Available from: http://www.epa.gov/oppt/coi/.
57. Directorate-General (Employment, Social Affairs and Inclusion), European Commission. Information notices on occupational diseases: a guide to diagnosis. 2009.