ACTIVE
CONTROL METHODS FOR DRAG REDUCTION
IN
FLOW
OVER
BLUFF
BODIES
Haecheon Choi
Schoolof Mechanicaland AerospaceEngineering,SeoulNational University,Seoul 151-742,Korea
ABSTRACT
In this
paper,
we
present twosuccessful results from activecontrolsof flowsover
acircular cylinderanda
spherefor drag reduction. TheReynoldsnumberrange
consideredfortheflowover
acircular cylinder is40\sim 3900based
on
the free-stream velocity andcylinderdiameter, whereasfor the flowover
asphereit is 105 basedon
the free-streamvelocity and sphere diameter. The successful
active
control methodsare
adistributed
(spatiallyperiodic) forcingandahigh-frequency(timeperiodic)forcing. With thesecontrol methods,the
mean
drag andliftfluctuations decrease andvorticalstructures
are
significantlymodified. Forexample,thetime-periodic forcingwith ahighfrequency(largerthan20times thevortexsheddingfrequency)produces50% drag reduction for the flow
over
asphere at$Re$ $=10^{5}$.
Thedistributed forcing applied to the flowover
acircular cylinder results ina
significant drag reductionatalltheReynolds numbers investigated.
INTRODUCTION
Thedrag andnoise increase
very
rapidlywithincreasing speed ofvehicles. Therefore,controlof flowover
abluff body for drag andnoise reductionhas been considered
one
ofthemajor issues influid mechanics. In the present study,we
consider two kindsofbluff-body flows:one
isthe flowover
acircular cylinder and the other is the flowover
asphere. These two flows contain mostof the characteristics observed in flowsover
tw0-and three-dimensionalbluffbodies,respectively.So far,
many
researchers have applied three kinds of control methods to flowover
abluff body: passive, activeopen-loop(i.e. non-feedback)andactivefeedback controls. Amongthem,we
restrictour
control methodto acategory ofthe active open-loop control method in thispaperand considertwo typesofactive open-loop
control methods. The firstis atime-periodicforcing whose frequencyiseither
near
thevortexshedding frequency(low-ffequency forcing)
or
similar toor
larger than the ffequencycorresponding to the shear-layer instability(high-frequency forcing). The secondisasteady but distributed(i.e. spatiallyvarying)forcing.These two control
methods
are
appliedtoflowsover
circular cylinderandasphere, inorder toinvestigatethe controleffecton
thedrag,liftandflowstructures.
The Reynolds number
ranges
consideredare
$Re$ $=u_{\infty}d/\mathrm{v}=40\sim 3900$forflowover
acircularcylinderand $Re$$=u_{\infty}d/\mathrm{v}=425\sim 10^{5}$for flowover
asphere, respectively,where$Re$istheReynoldsnumber,$u_{\infty}$ isthefree-stream velocity, $d$isthe cylinder
or
spherediameter, and$\mathrm{v}$ is thekinematic viscosity. Forflowoveracircularcylinder, numerical simulations
are
conducted for all the Reynolds numbers investigated. On the otherhand, for flowover
asphere, numerical simulationsare
conductedat$Re$$=425\sim 3700$andan
experimental studyiscarriedoutat$Re$ $=10^{5}$
.
NUMERICAL AND EXPERIMENTAL METHODS
Flow
over
aCircular Cylinder
Flow
over
acircular cylinderisstudied at $Re$$=40\sim 140$ and3900
using anumerical method. For$Re$$=$40\sim 140,the flowislaminarand thus
no
turbulence model isused. For$Re$$=3900$,largeeddy simulation withadynamic subgrid-scalemodel(Germanoet al. 1991;Lilly 1992)is carriedout. The numericalmethodused
is
basedon
fully implicit fractionalstepmethod(ChoiandMoin 1994)in generalizedcoordinates with thesecond-ordercentral difference scheme for the discretization of thespatialderivatives. The numbersof gridpointsused
are
$320\cross 120\mathrm{x}$ $16$(spanwisedirection)for$Re$$=40\sim 140$and
672
$\mathrm{x}160\mathrm{x}64$(spanwisedirection)for$Re$$=3900$.
Even though the base flows at $Re=40\sim 140$
are
tw0-dimensional, thecomputationsare
carried out in three dimension because of the distributed forcing applied in thespanwisedirection数理解析研究所講究録 1285 巻 2002 年 84-91
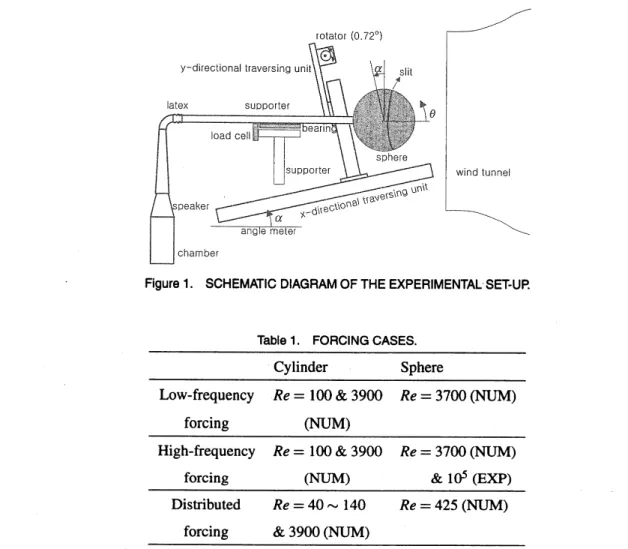
Figure 1. SCHEMATICDIAGRAM OF THE EXPERIMENTALSET-UP.
Table1. FORCINGCASES.
Cylinder Sphere
Low-frequency Re=100&3900 $Re=3700$(NUM)
forcing (NUM)
High-frequency Re=100&3900 $Re=3700$ (NUM)
forcing (NUM) &10 (EXP)
Distributed $Re=40\sim 140$ $Re=425$ (NUM)
forcing
&3900
(NUM)Here NUM and EXP denote the numerical and experimentalstudies,respectively.
Flow
over
aSphereFlow
over
asphereisstudied at$Re=425$and3700
usinganumerical method and10
usingan
experimentalmethod,respectively.
For$Re=425$,theflowislaminar unsteady and thus
no
turbulencemodelisused. For$Re=3700$,large eddysimulation with adynamic subgrid-scale model (Germanoetal. 1991;Lilly 1992)iscarriedout. The numerical method usedis based
on
anewly-developed immersed boundary method by Kimetal. (2001)with the second-order central difference scheme for the discretization of the spatial derivatives. The number of gridpointsusedfor$Re=425$is$449\cross 161\cross 40$,and that for$Re=3700$is$577\cross 141\cross 40$,respectively, in the streamwise,radial and
circumferentialdirections.
For $Re=10^{5}$,
an
experimental study is conducted. Figure 1shows the schematic diagram of the present experimental set-up, consistingofan
open-type windtunnel, sphere, supporter, speaker, load cell andtraversing unit. The diameter of asphere is 150$\mathrm{m}\mathrm{m}$, and the free-stream velocity is 10 $\mathrm{m}/\mathrm{s}$.
AtwO-dimensional slit of0.65
mm
(about$0.5^{o}$) widthis locatedon
the sphere surface at the angle of$76^{o}$from thestagnation point,whichis
an
upstream location ofthe separation line. Asupporter attached to the sphere baseis
linked to aspeaker chamber through latex. Then thespeaker induces atime-periodic blowingandsuction
ataspecified frequencyat the slit. Theforcing frequencies(/)appliedare
from 10Hz to370Hz byincrements
of10Hz,correspondingto$S\mathrm{r}(=fd/u_{\infty})=0.15$ to 5.55by incrementsof0.15. For all thefrequencies, the maximumvelocityatthe slitis
tuned to be 1 $\mathrm{m}/\mathrm{s}$(10%of the free-streamvelocity).The drag
on
thesphereis directlymeasuredusingaload cell(CassBCL-IL),and the velocity fieldismeasured with
an
in-hose
$\mathrm{x}$-typehot-wire probe and atw0-dimensionaltraversing unitthat operates at variable horizontal angles. We also separately placeatripcomposed of two
0.5
$\mathrm{m}\mathrm{m}$-thick wires,respectively,at$55^{o}$and$60^{o}$toexaminetheeffect of trip
on
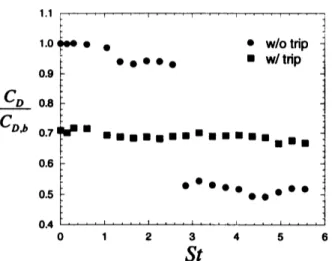
thedrag$\frac{C_{D}}{C_{Dp}}$
Figure2. VARIATION OFTHEDRAG COEFFICIENTWITHTHEFORCINGFREQUENCY.
CONTROL
METHODS
The control methods usedin this study
are
explainedinthis section:one
is atime-periodic forcing andthe otherisadistributed forcing. For atime-periodic forcing, the disturbanceisprovided to the base flow either from thefree-streamor
from asloton
abluff-body(cylinderor
sphere)surfacein afollowingmanner:
$\phi(t)=\mathrm{a}\sin(2\mathrm{y}\mathrm{c}f\mathrm{r})$, (1)
where$t$is thetime, $\alpha(=0.1u_{\infty})$ istheforcing amplitude and$f$isthe forcing ffequency. The forcing frequency $f$ is selected to be either
near
the vortex-shedding frequency (low-frequency forcing)or near
or
larger than thefrequency correspondingtotheshear-layer instability(high-frequency forcing).
For distributedforcing,thedisturbanceisprovided ffom
a
slotlocatedon
abluff-bodysurface:for acylinder$\phi(z)=a\sin(2\pi\frac{z}{\lambda_{\mathrm{z}}})$ (2)
andfor asphere
$\phi(\Theta)=\alpha\sin(m9)$, (3)
where$z$isthespanwisedirectionof the cylinder,$\Theta$ isthe circumferential direction of the sphere,
$\lambda_{z}$isthe
wave-length of the forcing in the spanwisedirection,and$m$is
an
integer$(m =\mathrm{I},2, \cdots)$.
RESULTS
Table1illustratestheforcing
cases
investigatedinthis study. In thebelow,we
briefly describe the results ffom the controls listedin Table1.With low- andhigh-frequency forcings appliedtotheflows
over
acylinder and aspherewere
notsuccessfulin producing drag reductionatlow Reynolds numbers$(<O(10^{4}))$because the low-ffequency forcingenhanced the vortexsheddingandthehigh-frequency forcing increasedtheshear-layer instabilityafterflow separation. On
theotherhand,thehigh-frequency forcing appliedto theflow
over
asphereat$Re=10^{5}$reducedthemean
drag by50%.Thisresult will bedescribed
in
more
details laterin
thissection.
The distributed forcing(spatiallyperiodic forcingin the spanwise direction)
was
applied to the flowover
a
circularcylinderas
shownin Table 1with varyingtheforcing wavelength. With thiscontrol,thedragwas
signif-icantly reduced when the baseflowcontained vortexshedding(i.e. $Re\geq 47$). This result will also be presented
laterin this
section.
Unlikethecase
ofcylinder,thedistributed
forcing appliedtotheflowover
asphere slightlyincreased the drag for$m=1,2$and3(Equation3). Thisdifferenceinthe control results between the
cases
of the0.6
0.5
0.4
$C_{\mathit{0}}0.3$0.2
0.1
0.0
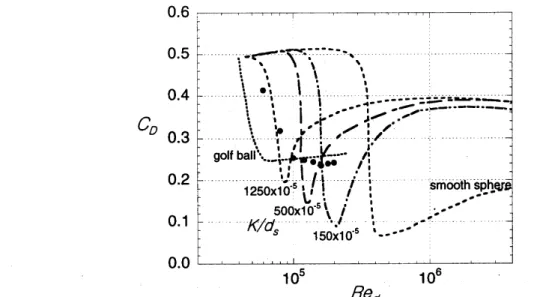
Figure3. VARIATIONS OF THEDRAG COEFFICIENT DUETOACTIVE ANDPASSIVE DEVICES ASAFUNCTION OFTHE
REYNOLDS NUMBER:
.,
PRESENT STUDY; DIMPLE (GOLF BALL), BEARMAN AND HARVEY(1976); ROUGHNESS(K),ACHENBACH(1974).
cylinder andsphere is mainly attributed to the
very
different vortical structures between two flows, indicatinga
significantdependence of the control methodon
the shape of abluff body.In the below,
we
present the results from two successful controls appliedto the flowsover
asphere anda
cylinder.
Flow
over
aSphere: High-Frequency Forcingat
${\rm Re}=10^{5}$Figure 2shows the variations of the drag coefficient$(C_{D})$with respecttotheforcing frequency in the absence
and
presence
oftrip. Here the dragcoefficient is normalized by that of the basic sphere(i.e. without forcing in the absenceoftrip;$C_{D,b}$) and$St=0$corresponds to thecase
ofno
forcing. The drag coefficient measuredon
thebasic sphere is about0.51,whichis in good agreement with the result of Achenbach(1972). In the absenceoftrip,
the drag abruptly decreases by about50% atacritical forcing frequency of$St_{c}(=f_{c}d/u_{\infty})=2.85$and becomes
nearly constant for$St>Stc$
.
Ontheotherhand,thedrag isreduced by30%inthepresence
oftrip, but theforcingdoes not reduce the drag further. Strikingly, the amount of drag reduction from the forcinginthe absence oftripis
larger than that from the forcinginthe
presence
oftrip. Thereason
for this will be explained laterinthissection. Figure3shows the variations of the dragcoefficient due to active andpassivedevicesas
afunction of the Reynolds number. Itwas
shown in Achenbach(1974) thatwith surface roughness the drag coefficient rapidly decreases and then increases withincreasingReynoldsnumber, showing alocal minimum at acritical Reynolds number(Rec). This critical Reynolds number decreases with increasing roughness. Also, thedrag coefficient at$Re>Re_{c}$ increasesmore
sharplyatlarger roughness andapproaches 0.4. On the otherhand, dimples reduce the dragcoefficienteven
atalower Reynolds number than surface roughness does(Bearmanand Harvey 1976).After its decrease by dimples, the drag coefficientremains almost constantatabout 0.25. In the present study, fordifferent Reynoldsnumbers,
we
fix theforcingfrequencytobe$f=330$Hz($fd/u_{\infty}=4.95$at$Re=10^{5}$) andtheforcing amplitudetobe 1 $\mathrm{m}/\mathrm{s}$. Itis shown in Figure 3that the result of the present forcing is
very
similar tothat with dimples. Afteritsrapid decrease due to the present high-frequency forcing, the drag coefficientremains
almost constant at about
0.24.
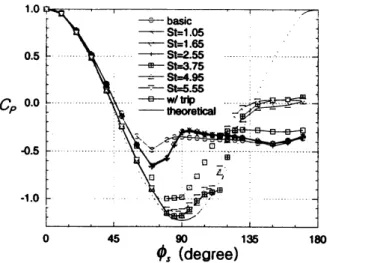
Figure4shows thesurface-pressure distributionfordifferent forcing frequencies in the absence oftrip,
t0-getherwiththose for the basicsphereandinthe
presence
oftrip,and theinviscidpressure
(denotedas
‘theoretical’ in Figure4).Unlike thecylinder, the basepressure
itself does not contribute to the dragon
thesphere because thearea
atthe basepointiszero.
Consideringthe area, thepressures
at the anglesof$45^{o}$ and $135^{o}$contribute most tothe drag. At the forcing frequencies less than the critical forcing frequency($St<St_{c}=2.85$ ,thepressures
on
the sphere
are
similar to thaton
the basic sphere, indicating negligibleor
smalldrag reduction at these forcing frequencies. On the otherhand, for the forcing frequencieslarger than$Stc$, the surfacepressures
are
nearly thesame as
the inviscidpressure
for$\phi_{s}<135^{o}$, indicating thatasignificantamountof drag reduction shouldoccu
87
Figure 4. STATIC-PRESSURE DISTRIBUTIONON THE SPHERE SURFACE.
no
forcing forcing (St$=4.95)$ Figure5. OIL FLOW$\mathrm{P}\mathrm{A}\Pi \mathrm{E}\mathrm{R}\mathrm{N}$ON THE SPHERE SURFACE.atthesehigh forcing frequencies. Interestingly,the
pressure
on
thetrippedsphere surface approaches that of thevery
high frequencyforcingat$\phi_{s}<120^{o}$butbecomes nearly thesame
in the downstream surfaceas
thaton
the basicsphere. It shouldbementionedhere that thereexists
aplateauinthepressure
curve
around 1$10^{o}$for the high-frequency forcingcases
$(St>2.85)$.
Thispressure
patternis
very
similarto that observedin
the criticalregion
whereaseparation bubbleexists
on
the spheresurface (Achenbach 1974; Fage 1936; SuryanarayanaandMeier1995; Taneda1978),suggesting
an
importantclue to the presentdrag-reduction mechanismby thehigh-frequency forcing.Figure 5shows
an
oil flow visualizationon
the sphere. In thecase
of the basic sphere, separationoccurs
around $80^{o}$,whereas for the
case
of$St=4.95$ separation is delayed tooccur
at $105^{o}-110^{o}$, andthen the flow
reattaches to thesurfaceat1$10^{o}-115^{o}$,forming aseparation bubble there. Second separation
occurs near
$130^{o}$for$St=4.95$
.
Inthepresence
oftrip(notshownhere),separationoccurred around$105^{o}$andno
separationbubblewas
observed
near
the sphere surface. Achenbach(1974)indicated that the low drag coefficient in the critical region isduetotheexistenceof separationbubble: withaseparationbubble,reattachedflowhas highmomentum
near
the wall with large turbulenceintensityandthus delays secondseparation. The phenomenon occurredin the criticalregionof the basic sphereis
very
similar to the presentobservation,suggestingthatlarge dragreduction achieved for$St>St_{c}$isessentially due to theexistenceof theseparationbubble. Theexistenceofseparationbubblewas
also confirmed from the velocitymeasurementnear
thespheresurface(notshownhere).Flow
over
aCircular Cylinder: Spatially Periodic Forcing
Figure6showstheschematic diagramof theforcing. Duetothefactthat theforcingis applied inthespanwise
direction, the controlled flowis three-dimensional
even
ifthe baseflowis tw0-dimensional. Therefore,for$Re$$\leq$$140$,the computational domainsize inthespanwisedirectionissettobe the
same
as
thewavelengthof theforcing.In the
case
ofturbulent flow$(Re =3900)$,the computational domainsize
ofthe controlled flow is thesame as
thatof the uncontrolled flow. In this study,
we
havetwodifferent types offorcing:one
isthein-phase forcingand the$\ln$-phase forcing
$D$
$\mathrm{o}\mathrm{u}\mathrm{t}\cdot \mathrm{o}\mathrm{f}$-phase forcing
(a) (b)
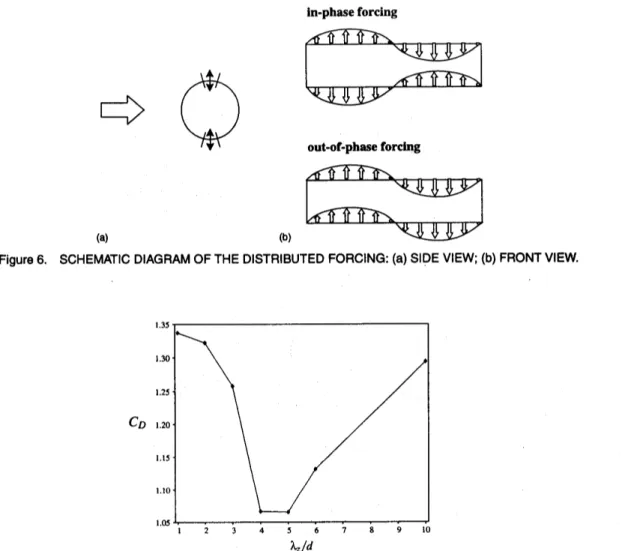
Figure6. SCHEMATIC DIAGRAM OF THE DISTRIBUTED FORCING:(a)SIDEVIEW; (b)FRONT VIEW.
$c_{D}$
$\lambda_{z}/d$
Figure7. EFFECT OF THE IN-PHASEFORCING ONTHE MEAN DRAG AT$Re=1\mathrm{O}\mathrm{O}$.
otheristheout-0f-phaseforcing(seeFigure6).
First, the in-phase forcingis appliedtotheflow
over
the cylinder at$Re=1\mathrm{O}\mathrm{O}$.
Figure7showsthe variationof the drag coefficient with respecttothe forcing wavelength$(\lambda_{z}=1\sim 10d)$
.
The drag isminimumat$\lambda_{z}\approx 5d$,resulting in about20%drag reduction. We have also applied the in-phase forcingtotheflows at$Re=80$and 140.
Inthesecases,the minimum drag occurred at$\lambda_{z}\approx 6d$and$4d$,respectively, indicating that the optimum wavelength
of the forcing decreases withincreasingReynolds number. It isinteresting to notethattheoptimum wavelength issimilar to thespanwisewavelength of the mode-A instability(Williamson 1996). The
same
in-phase forcingisappliedtotheflow at$Re=40$,where there
occurs
no
vortex shedding in thecase
ofno
forcing. In this case, there is nearlyno
change in the drag with the forcing,even
though three dimensional flow structureappears
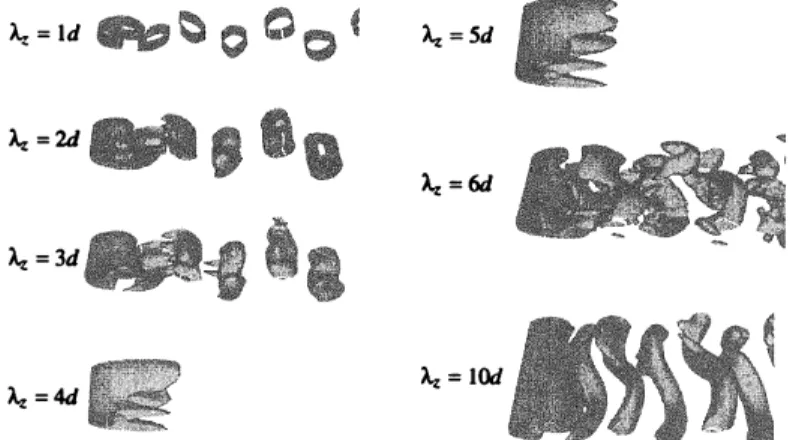
in the wake due to the forcing.Figure 8shows the variationof vortical structures at$Re=1\mathrm{O}\mathrm{O}$(using the vortex identification method by
Jeong andHussain 1995)with the forcing wavelength. Itisclear that at theoptimumwavelength$(\approx 5d)$the flow
becomescompletely steady. The
same
observationwas
made for$Re=80$.
However, for$Re=140$,the vorticalstructures
were
still unsteadyeven
attheoptimum wavelength owingtothe strong vortexstrengthshedbehindthecylinderatthis Reynolds number.
Second,theout-0f-phaseforcing with $\lambda_{z}=5d$is appliedto the flow
over
the cylinder at$Re=1\mathrm{O}\mathrm{O}$.
Figure9
shows theinstantaneousvortical structures for theout-0f-phaseforcing. Unlike thein-phase forcing,theflowwith theout-0f-phaseforcing shows aclear vortex shedding, resultinginnearly
no
changeinthe dragas
comparedto that of the baseflow.Lastly, the in-phase and out-0f-phase forcings
are
applied tothe flow at$Re=3900$.
Here the base flowis three-dimensionaland turbulent afterseparation. Thesizeof thecomputational domain inthe spanwise directionis %d, and the forcing wavelength istaken to be the
same as
the domain size. Figure 10shows the variation of$L_{\sim}=1d\mathrm{b}^{\mathrm{b}}\circ$ $O_{\Leftrightarrow}1$
Figure9. INSTANTANEOUSVORTICAL STRUCTURES FORTHEOUT-OF-PHASE FORCING$(\lambda_{z}=5d)$AT$Re$$=1\propto$).
$C_{D}$
$tu_{\infty}/d$
Figure10. VARIATIONOF THEDRAG COEFFICIENT DUETO THEDISTRIBUTED FORCINGAT$Re$$=3900$
.
the dragcoefficientowingto theforcing. Surprisingly,the out-0f-phase forcing
as
wellas
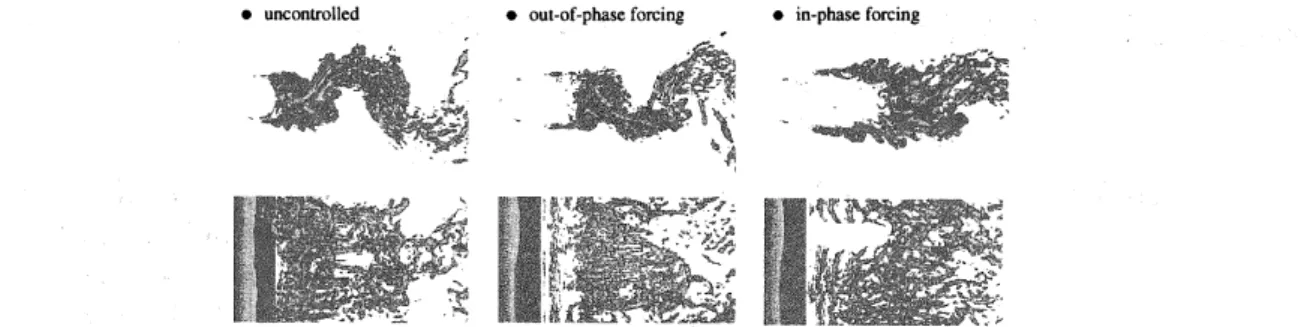
the in-phase forcingreduces the drag significantly. Instantaneousvortical structures for the base flow and flowswith theforcing
are
shownin Figure 11. Inthe
case
of theout-0f-phase forcing,the vorticalstructuresare
significantly changednear
theseparationpointbutthoseinthefurther downstream
are
similartothoseof thebase flow. Ontheotherhand,the in-phaseforcing drasticallychanges thevorticalstructures,showingalmost
no
vortexright behindthe cylinder andfurtherdelay of vortexsheddinginthedownstream.CONCLUSION
In this
paper, we
presentedthe results ffom both the numerical and experimental studieson
active
controlofflows
over
circular cylinder and aspherefordrag reduction. The Reynolds numberrange
consideredfor the flow.
uncontrolled.
in-phase forcingFigure11. CHANGESINTHEINSTANTANEOUSVORTICALSTRUCTURES DUE TOTHEDISTRIBUTEDFORCINGAT$Re=$
3900.
over
acircularcylinderwas
100\sim 3900basedon
thefree-stream velocity and cylinderdiameter,whereasfor the flowover
asphereitwas
$100\sim 10^{5}$ basedon
the free-stream velocityand sphere diameter. Theactivecontrolmethods investigated
were
(1)aforcing with alow frequencynear
the vortex sheddingfrequency; (2)aforcingwith ahigh frequency that is much largerthan the vortex shedding frequency; (3) adistributed (i.e.
spatially
varying)forcing. The control method(1)increased the
mean
drag and lift fluctuationsatallthe Reynolds numbersinvestigated for both flows. The result of the control method (2), however, showed asignificant dependence
on
theReynolds number. For example, aforcing with ahigh frequency(largerthan20 timesthevortexsheddingfrequency)produced50%drag reduction for the flow
over
asphere at$Re=10^{5}$,butincreased the dragat${\rm Re}=3700$.
The control method(3)applied to the flow
over
acircular cylinder resultedinasignificant drag reduction for flowover
acircularcylinderat allthe Reynolds numbers investigated, but did notreduce the dragfor the flowover
asphere, mainly because of the
very
different vortical structures between the flowsover
asphere andacircularcylinder,showing asignificantdependenceof the control method
on
theshape of abluffbody.ACKNOWLEDGMENT
This work is supported by the Korean Ministry ofScience and Technology through the National Creative ResearchInitiatives.
REFERENCES
Achenbach,E.: Experiments
on
theflow past spheresatveryhigh Reynoldsnumbers.J. Fluid Mech.54,565(1972).
Achenbach,E.: The effect of surface roughness and tunnel blockage
on
the flow pastspheres.J.Fluid Mech.65, 113(1972).
Bearman,P. W.and Harvey, J. K.: Golf ball aerodynamics. Aeronautical Quarterly May, 112(1976).
Choi, H. andMoin, P.: Effects of the computational timestep
on
numerical solutionsofturbulent flow. J.Comp. Phys. 113,1(1994).
Fage, A.: Experiments
on
asphere atcritical Reynolds numbers. Aero. ${\rm Res}$.
Counc. R.&M.
no.
1766,(1936).
Germano, M., Piomelli, U., Moin,P. andCabot,W. H.: Adynamic subgrid-scale eddyviscositymodel. Phys.
FluidsA3, 1760(1995).
Jeong,J. andHussain,F: Ontheidentificationof avortex. J. Fluid Mech. 285,
69
(1995).Kim, J., Kim, D. andChoi, H.: An immersed-boundary finite volume methodfor simulations of flow in
complex geometries.J.Comput.Phys. 171,
132
(2001).Lilly, D. K.: Aproposed modification of the Germano subgrid-scale closure method. Phys. FluidsA4,
633
(1992).
Suryanarayana, G. K. andMeier,G. E. A.: Effect of ventilation
on
theflow field around asphere. Exp.Fluids19,
78
(1995).Taneda,S.: Visualobservationsof the flow past asphere at Reynolds number between
10
and 10.J. FluidMech. 85, 187(1972).
Williamson,C. H. K.: Three-dimensional waketransition.J.Fluid Mech.328,345(1996)