Precise Measurement of Bhabha scattering at a
center-of-mass energy of 57.77 GeV
著者
Arima T., Abe K., et al., VENUS
Collaboration
journal or
publication title
Physical Review. D
volume
55
number
1
page range
19-39
year
1997
URL
http://hdl.handle.net/10097/53664
doi: 10.1103/PhysRevD.55.19Precise measurement of Bhabha scattering at a center-of-mass energy of 57.77 GeV
T. Arima,3,*S. Odaka,2,†K. Ogawa,2,‡J. Shirai,2 T. Tsuboyama,2N. Hosoda,4,§M. Miura,3,i K. Abe,1K. Amako,2 Y. Arai,2Y. Asano,3M. Chiba,4Y. Chiba,5M. Daigo,6M. Fukawa,2,¶Y. Fukushima,2J. Haba,1,**H. Hamasaki,3H. Hanai,7Y. Hemmi,8 M. Higuchi,9T. Hirose,4Y. Homma,10N. Ishihara,2Y. Iwata,11J. Kanzaki,2R. Kikuchi,8T. Kondo,2 T. T. Korhonen,2,12,†† H. Kurashige,8 E. K. Matsuda,13 T. Matsui,2K. Mikaye,8S. Mori,3Y. Nagashima,7Y. Nakagawa,14
T. Nakamura,15 I. Nakano,16,‡‡T. Ohama,2 T. Ohsugi,11 H. Ohyama,17 K. Okabe,13 A. Okamoto,8 A. Ono,18 J. Pennanen,2,12H. Sakamoto,8M. Sakuda,2M. Sato,9N. Sato,2M. Shioden,19T. Sumiyoshi,2Y. Takada,3F. Takasaki,2
M. Takita,7 N. Tamura,13,§§D. Tatsumi,7K. Tobimatsu,20 S. Uehara,2 Y. Unno,2T. Watanabe,21 Y. Watase,2 F. Yabuki,4 Y. Yamada,2T. Yamagata,14 Y. Yonezawa,22 H. Yoshida,23and K. Yusa3
~VENUS Collaboration!
1Department of Physics, Tohoku University, Sendai 980, Japan 2KEK, National Laboratory for High Energy Physics, Tsukuba 305, Japan
3Institute of Applied Physics, University of Tsukuba, Tsukuba 305, Japan 4Department of Physics, Tokyo Metropolitan University, Hachioji 192-03, Japan
5
Yasuda Women’s Junior College, Hiroshima 731-01, Japan
6Faculty of Economics, Toyama University, Toyama 930, Japan 7Department of Physics, Osaka University, Toyonaka 560, Japan
8Department of Physics, Kyoto University, Kyoto 606, Japan
9Department of Applied Physics, Tohoku-Gakuin University, Tagajo 985, Japan 10Faculty of Engineering, Kobe University, Kobe 657, Japan
11Department of Physics, Hiroshima University, Higashi-Hiroshima 724, Japan 12Research Institute for High Energy Physics, Helsinki University, SF-00170 Helsinki, Finland
13Department of Physics, Okayama University, Okayama 700, Japan 14International Christian University, Mitaka 181, Japan 15Faculty of Engineering, Miyazaki University, Miyazaki 889-01, Japan
16Institute of Physics, University of Tsukuba, Tsukuba 305, Japan 17Hiroshima National College of Maritime Technology, Higashino 725-02, Japan
18Faculty of Cross-Cultural Studies, Kobe University, Kobe 657, Japan 19
Ibaraki College of Technology, Katsuta 312, Japan
20Center for Information Science, Kogakuin University, Tokyo 163-91, Japan 21Department of Physics, Kogakuin University, Hachioji 192, Japan
22Tsukuba College of Technology, Tsukuba 305, Japan 23Naruto University of Education, Naruto 772, Japan
~Received 17 June 1996!
Bhabha scattering at a center-of-mass energy of 57.77 GeV has been measured using the VENUS detector at KEK TRISTAN. The precision is better than 1% in scattering angle regions of ucosuu<0.743 and 0.822<cosu<0.968. A model-independent scattering-angle distribution is extracted from the measurement. The distribution is in good agreement with the prediction of the standard electroweak theory. The sensitivity to underlying theories is examined, after unfolding the photon-radiation effect. The q2dependence of the photon vacuum polarization, frequently interpreted as a running of the QED fine-structure constant, is directly ob-served with a significance of three standard deviations. The Z0 exchange effect is clearly seen when the distribution is compared with the prediction from QED ~photon exchanges only!. The agreement with the standard theory leads us to constraints on extensions of the standard theory. In all quantitative discussions, correlations in the systematic error between angular bins are taken into account by employing an error matrix technique.@S0556-2821~97!00801-1#
PACS number~s!: 13.10.1q, 12.60.Cn, 14.60.Cd, 14.80.2j
*Present address: Faculty of Engineering, Kyushu University, Fukuoka 812, Japan.
†Corresponding author. Electronic address: [email protected]. ‡Deceased.
§Present address: Japan Synchrotron Radiation Research Institute, Kamigouri 678-12, Japan. iPresent address: Institute for Cosmic Ray Research, University of Tokyo, Tanashi 188, Japan. ¶Present address: Naruto University of Education, Naruto 772, Japan.
**Present address: KEK, Tsukuba 305, Japan.
††Present addresss: Accelerator Division, KEK, Tsukuba 305, Japan.
‡‡Present address: Department of Physics, Okayama University, Okayama 700, Japan. §§Present address: Department of Physics, Niigata Umiversity, Niigata 950-21, Japan.
55
I. INTRODUCTION
Bhabha scattering, e1e2→e1e2, is the most fundamen-tal reaction in e1e2collisions. The reaction at high energies has been extensively studied by experiments at e1e2 collid-ers @1–4#. Apart from the intrinsic interest concerning the underlying physics, the study is important since the luminos-ity of the e1e2collisions is usually determined by using this reaction.
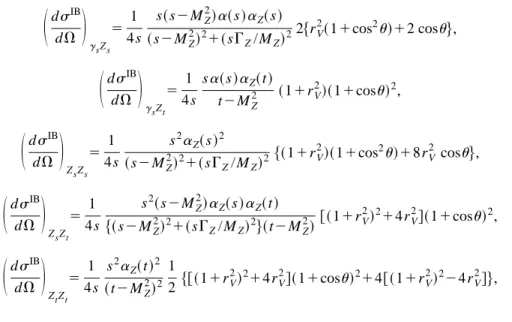
In the framework of the standard electroweak theory@5#, Bhabha scattering is described by t-channel ~spacelike! and
s-channel~timelike! exchanges of the photon and the Z0 bo-son between the electrons. The validity of this picture has been precisely demonstrated at collision energies far below the Z0resonance@3# and on the resonance @4#. In the former the reaction is dominated by the photon exchange. The con-tribution of the Z0exchange has been marginal in the obser-vations. On the other hand, the Z0contribution is obvious on the resonance. The validity of theoretical predictions con-cerning the coupling between Z0 and the electron has been precisely examined. However, since the direct production of
Z0 dominates the contribution there, the measurements are relatively insensitive to the interferences between the Z0and photon exchanges.
Therefore, in order to complete the verification, it is nec-essary to carry out high-precision measurements at interme-diate energies where the interferences are expected to be-come appreciable. In addition, such measurements are expected to have good sensitivity to unexpected new inter-actions, to which experiments on the resonance are blinded by the large contribution from the resonance.
In this work, we present results from a measurement of Bhabha scattering, carried out using the VENUS detector at the TRISTAN e1e2 collider at KEK. The measurement is based on high-statistics data at a center-of-mass ~c.m.! en-ergy of 57.77 GeV, corresponding to an integrated luminos-ity of about 290 pb21, accumulated from 1991 until the end of the experiment in May 1995. The measurement has been carried out with a precision of 0.5% in a central ~barrel! region, ucosuu<0.743, and 0.7% in a forward ~end-cap! re-gion, 0.822<cosu<0.968.
In our previous report @1# and all other reports from ex-periments below the Z0 resonance @2,3#, the measurements were presented in the form of a tree-level cross section. A correction for radiative effects is indispensable in such analy-ses. The method relied on theoretical calculations of the first-order QED@6# or electroweak @7,8# corrections. On the other hand, the real phenomena include radiative effects up to in-finite order, allowing an arbitrary number of photon emis-sions. We are now aware that the second-order QED correc-tion amounts to a level of 1% of the tree-level cross seccorrec-tion @9,10# so that the previous experimental results may be in-correct at this level. Note that still-missing higher orders may alter the correction at a similar level.
In order to be free from such ambiguities irrelevant to the experimental reliability, we present our primary result, a scattering angle distribution, in a model-independent way. The result is dependent on the experimental conditions. However, since the condition is well defined, the result can be compared with theoretical predictions, at least the
predic-tion from the standard electroweak theory, by using com-puter programs @9,10#.
In order to proceed to further discussions, the model-independent result is converted to a form which is indepen-dent of experimental conditions, being based on certain theo-retical estimations of the radiative correction. If theotheo-retical improvements are made in the future, the discussions can be revised without any ambiguity by starting from the primary model-independent result.
A reliable estimation of systematic errors is crucial in high-precision measurements. Corrections for the detection inefficiency and the background contamination frequently give systematic errors having a certain correlation between the measurements. In the present analysis, error correlations between angular bins are treated in the form of an error ~co-variance! matrix. The correlation matrix, the nondimensional component of the error matrix, is explicitly presented as a result of the measurement.
The layout of this work is as follows. The experimental apparatus is described in Sec. II. Relevant features of the TRISTAN storage ring are briefly summarized, along with a detailed description about the VENUS detector and event triggers. Event analyses in the barrel region and in the end-cap region are described in Secs. III and IV, separately. Cor-rections and associated systematic errors are described in de-tail. Section V is dedicated to discussions of underlying physics. The obtained experimental result is compared with the prediction from the standard theory; then, possibilities of its extension and new physics are discussed. Finally, the con-clusions are summarized in Sec. VI.
II. EXPERIMENTAL APPARATUS A. TRISTAN MR
The TRISTAN main ring~MR! was an e1e2storage ring of about 3 km in circumference @11#. It was operated with four beam bunches, two electron bunches, and two positron bunches circulating in opposite directions. Collisions oc-curred every 5 ms, at four interaction points on the ring. A typical beam current was about 15 mA at the start of the collisions and fell thereafter with a typical lifetime of 200 min.
During an upgrade in 1990, a pair of superconducting quadrupole magnets were installed at the four interaction re-gions. The vertical beam size at the interaction points was squeezed to one-half of the previous value, and a maximum luminosity of 431031 cm22s21was achieved. After the up-grade, the collision energy was fixed mostly at 58 GeV to provide the experiments with high-statistics collision data, until the end of the operation in May 1995.
The beam energy of MR was measured by means of reso-nant spin depolarization@12#. Under a typical operation con-dition, the actual beam energy was smaller than the nominal value by 114 MeV for the nominal beam energy of 29.0 GeV @13#, i.e., the actual c.m. energy ~
A
s! was 57.77 GeV for thenominal c.m. energy of 58.0 GeV. The uncertainty was esti-mated to be a few MeV from the possible instability and uncertainties in the accelerator components@14#. The spread of the beam energy was 48 MeV in rms, resulting in a c.m. energy spread of 68 MeV@13#.
The energy imbalance between the electron beams and the positron beams may have been sizable, since the energy loss of beam particles during the circulation was large. Such an imbalance will cause a mismatch in the scattering angles of two back-to-back particles. A significant mismatch was ob-served in Bhabha scattering events in the 1987 runs. The
mismatch corresponded to an imbalance,
[E(e2)2E(e1)]/[E(e2)1E(e1)], at a level of 0.2%. Thanks to a careful operation of the accelerator, the imbal-ance was eliminated to an invisible level, ,0.05%, in data relevant to the present analysis.
B. Overview of the VENUS detector
The VENUS detector was a general-purpose magnetic spectrometer, covering almost the full solid angle around one of the four interaction points of TRISTAN MR. The detector was upgraded in 1990, at the same time as the accelerator upgrade. The detector before the upgrade is described else-where @15#. In the upgrade, the beam pipe was reduced in radius from 10 to 5 cm, and an inner chamber, formerly used for an event trigger, was replaced with a vertex chamber@16# and a new trigger chamber. Furthermore, a large transition radiation detector @17# was installed in order to improve the capability of electron identification. A quadrant cross section of the upgraded VENUS detector is shown in Fig. 1.
Tracking devices placed inside a 7.5 kG axial magnetic field, produced by a solenoidal superconducting magnet coil @18#, were the vertex chamber, the trigger chamber, the cen-tral drift chamber ~CDC! @19# and the outer drift tubes ~ODT!, from inside to outside. The transition radiation de-tector was placed between CDC and ODT. Time-of-flight counters ~TOF! @20# were placed inside of the magnet coil, providing time-of-flight and trigger information. The forward chambers were placed so as to enhance the tracking capabil-ity in a small-angle region.
Calorimeters covered almost the full solid angle without any apparent gaps, down to 40 mrad of the angle~u! from the beam axis. A lead glass array~LG! @21# placed outside of the magnet coil covered a central ~barrel! region, ucosuu<0.8.
Forward~end-cap! regions, 0.79<ucosuu<0.99, were covered with a pair of lead-liquid argon sandwich calorimeters ~LA! @22#. Further small angles were covered with a pair of active masks ~AM! @23#, composed of lead cylinders interleaved with scintillation fibers.
Plastic streamer tubes ~BST! were placed in front of the lead glass array in order to provide photon-conversion infor-mation. BST had a two-dimensional tracking capability uti-lizing both anode and cathode readouts. The muon chambers @24# were placed outside of the iron return yoke in order to identify high-momentum muons. The chambers were divided into four superlayers interleaved with iron filters.
The detector was so placed that the collisions should oc-cur near its center. The observed offset of the average colli-sion point was 5 mm and 0.3 mm along and transverse to the beam direction, respectively. The movement of the average position was within61 mm in both directions throughout the data-taking period. The spread of the interaction point along the beam direction was measured to be a Gaussian distribu-tion with a standard deviadistribu-tion of 1.0 cm. The present mea-surement is insensitive to the transverse spreads of 300 mm horizontally and 20mm vertically.
Detector components relevant to the present analysis are CDC, LG, and LA. Relevant features of these devices and event triggers are described in the following subsections.
C. Central drift chamber
The central drift chamber ~CDC! @19# was the main charged-particle tracking device of the VENUS detector. It was a conventional cylindrical multiwire drift chamber with a length of 3 m. The inner and outer radii of the gas volume were 25 and 126 cm, respectively. The chamber was filled with a gas mixture of an Ar/CO2/methane ~89/10/1!, so-called HRS gas, at atmospheric pressure.
The chamber consisted of 7104 almost identical single-hit drift cells of 1.7 cm in the radial direction and typically 2 cm in full width. The cells were arranged in 29 cylindrical lay-ers, coaxially surrounding the center axis of the chamber. The innermost layer was at 28.65 cm in radius, and the out-ermost one was at 121.35 cm. The layers were grouped to form 10 superlayers. Each superlayer consisted of a pair of axial layers staggered by a half cell and one small angle ~about 3°! stereo layer, except for the innermost superlayer. Charged particles emitted in the central region,ucosuu<0.75, penetrated the sensitive region of all layers.
The momentum resolution of CDC in the 7.5 kG magnetic field was measured to be
sp
p 5
A
~0.013!2[email protected]~GeV/c!#2 ~1!
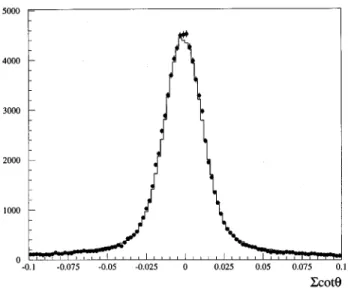
in the central region, where pt is the transverse momentum measured with respect to the beam axis. The polar angle~u! resolution was measured from the consistency between the scattered angles of two electrons in Bhabha events. Compar-ing the result with a simulation, as shown in Fig. 2, the resolution was found to be
s~cotu!5~0.860.1!31022. ~2!
FIG. 1. Quadrant cross section of the VENUS detector after the upgrade. The edges of the angular acceptance are indicated.
The detection efficiency was better than 99.5% per sam-pling on the average, including the inefficiency due to dead channels. We found 12 dead channels in total, including 4 channels in which the sense wires were known to be defec-tive. The tracking capability was insensitive to this amount of small inefficiency.
D. Lead glass calorimeter
The lead glass calorimeter array ~LG! @21# consisted of 5160 lead glass counters of approximately 12312 cm2 in cross section and 30 cm in length. The length corresponded to 18 radiation lengths. The counters were arranged in a cy-lindrical array surrounding the beam line, 120 counters in the azimuth and 43 counters along the beam line, covering polar angles ~u! from 37° to 143°. All of the counters were ap-proximately pointing towards the interaction point with small tilts in both directions~semitower geometry!.
The intrinsic energy resolution, measured by using elec-tron beams prior to the installation, was sE/E51.0% 13.0%/
A
E(GeV) for counters in a central region, 42°<u<138° and sE/E51.25%15.0%/A
E(GeV) for other counters, because different types of photomultipliers were used. The resolution of the injection point, measured from energy sharing between counters, was 1.2 cm on the average.The resolutions were deteriorated by materials at smaller radii at low energies, and by calibration errors at high ener-gies. The dominant material placed in front of the LG was the solenoid magnet with a radial thickness of 0.5 radiation length. The average resolution was degraded to 7% for 1.5 GeV electrons from the two-photon process. The gain of the counters had been calibrated using electron beams prior to the installation, and tracked during the experiment by using a monitor system employing xenon flash tubes and optical fi-bers. After a correction based on the monitor results, the
average resolution was 3.8% for 30 GeV electrons from Bhabha scattering.
E. Liquid-argon calorimeter
The liquid-argon calorimeter ~LA! @22# consisted of two independent lead-liquid argon sandwich counters. The counters were placed at about 2 m from the interaction point, covering polar angles from 8° to 37°. Each counter consisted of 480 tower-structure radiator modules, a stack of 71 lead plates of 1.5 mm in thickness with a plate gap of 3 mm. The radiator plates served as electrodes. The modules were en-closed in a Dewar filled with liquid argon. The total thick-ness of the calorimeter corresponded to 20.3 radiation lengths, including the liquid argon.
The modules were arranged in 10 concentric columns ~rings!. One module had a polar-angle coverage of 2.9°. The gap between the modules was 2 mm. In order to reduce module-gap effects, the modules were arranged in a semi-tower geometry, pointing towards 79 cm beyond the interac-tion point. Further, in the signal readout, each module was longitudinally subdivided into four segments of an approxi-mately equal thickness.
The intrinsic energy resolution of LA was about sE/E 510%/
A
E(GeV). The resolution of the injection point,measured from energy sharing between the modules, was 6 mm on the average. The resolutions were degraded by ma-terials placed in front of the calorimeter, such as the end-plates and electronics components of CDC. The materials of the vertex chamber, the trigger chamber, and their readout electronics affected the resolution at small angles signifi-cantly. Their effects were carefully investigated in the course of the analysis. The calibration error was smaller than 1% because the amplifiers had been carefully calibrated prior to the installation@22#.
F. Event trigger
The data acquisition was triggered by the coincidence be-tween beam-crossing signals and signals issued by trigger-generation circuits. The inputs of the trigger-trigger-generation cir-cuits were analog-sum signals from calorimeters and track patterns reconstructed from CDC and TOF hits.
The analog signals from LG were added in every digitizer module to provide segment-sum signals. The segment typi-cally corresponded to a 6315 array of the LG modules. We had 58 segments in total, 8 or 10 segments in azimuth and 7 segments along the beam direction. The segment-sum signals were further added to provide a total-sum signal.
LA was subdivided into 24 segments in each counter, 12 sectors in azimuth and 2 segments by the polar angle. Each segment provided an analog segment-sum signal. The signals were further added to provide a total-sum signal in each counter. AM was subdivided into four sectors in each side.
The axial-layer cells of CDC were grouped to form 64 trigger-cells in each superlayer, divided in azimuth. Track-finder modules recognized tracks by comparing the trigger-cell hit pattern from inner seven superlayers with a preloaded lookup table @25#. The pattern of the lookup table was so defined that the track finders should have nearly full effi-ciency for high transverse momentum ~pt>1 GeV/c! tracks. FIG. 2. Sum of cotu of the two electrons in Bhabha-scattering
events, measured by CDC. The spread of the distribution represents the polar angle~u! resolution of CDC. The measurement ~plot! is compared with the result from a simulation~histogram! where the nominal value of the resolution is assumed. The long tails are an effect of the photon radiation.
The trigger-generation circuits issued a trigger signal when at least one of the following conditions was satisfied: ~i! The pulse height of the LG total-sum signal exceeded a threshold corresponding to an energy deposit of 3 GeV;~ii! a pair of coplanar ~facop<10°! tracks were recognized by the track finder and TOF hits were found in a reasonable range around the tracks, wherefacopis the supplement of the open-ing angle in the projection onto the plane perpendicular to the beam direction;~iii! a pair of coplanar ~facop<30°! tracks were recognized by the track finder and TOF hits were found in a reasonable range around the tracks; ~iv! two or more tracks were recognized by the track finder, and the pulse height of at least one LG segment-sum signal exceeded a threshold of 0.7 GeV;~v! the pulse height of at least one of the two LA total-sum signals exceeded a threshold of 4 GeV; ~vi! at least one back-to-back pair of AM segments had en-ergy deposits consistent with Bhabha scattering events.
Condition~ii! was totally contained in condition ~iii!. The former was kept for a crosscheck because the generation cir-cuits were independent of each other. A trigger-generation circuit using the LA segment-sum signals was turned off throughout the relevant period, in order to avoid a high trig-ger rate. Trigtrig-ger ~vi! was mainly used for an on-line lumi-nosity monitor. Additionally, trigger signals were generated at a frequency of 0.1 Hz, regardless of the detector signals. These data provided bias-free information concerning the data quality.
When the data acquisition was triggered, digitized data were collected by a FASTBUSprocessor module prior to the transfer to an on-line computer. Utilizing the data collection time, a software selection was applied in the processor mod-ule to those events which were triggered by condition ~iii! alone@26#. Tighter association between CDC tracks and TOF hits was required in order to reduce events from beam-beam pipe interactions.
III. ANALYSIS IN THE BARREL REGION A. Event selection
The signature of Bhabha scattering events is an observa-tion of a pair of back-to-back ~collinear! electron and posi-tron, each having the beam energy ~Ebeam!. Such electrons leave large deposits in electromagnetic calorimeters. The sig-nature is diluted by radiative effects, resulting in extra pho-ton emissions, and electromagnetic interactions of the scat-tered electrons in detector materials. Besides, detectors have finite resolutions. The selection criteria have to be appropri-ately relaxed, so as to minimize ambiguities in the detection efficiency.
In the barrel region, we selected candidate events accord-ing to the followaccord-ing criteria
~1! Events must comprise 2, 3, or 4 CDC tracks which fulfilled the conditions that ~t1! Nhit~axial!>8, ~t2!
Nhit~stereo!>4, ~t3! uRminu<2.0 cm, ~t4! uZminu<20 cm, and
~t5! pt>1.0 GeV/c. Nhit~axial! and Nhit~stereo! are the num-ber of axial-wire and stereo-wire hits composing the track, respectively. The parameter Rmin is the closest approach to the center axis of CDO ~z axis! and Zmin is the z coordinate at the closest approach.
~2! Among these CDC tracks, at least one of the pairs must satisfy the conditions that~p1! both tracks were within
a scattering-angle region of ucosuu<0.743, ~p2! for both tracks, a high-energy LG cluster~E>Ebeam/3! was observed within 10° around the production direction, and ~p3! the acollinearity angle ~uacol!, the supplement of the opening angle, was not larger than 10°.
~3! The selected track pair must have opposite charges. When an event included multiple candidate pairs, the pair that had the largest average momentum
^
p&
, defined as 1/^
p&
5(1/p111/p2)/2, was chosen.The requirements on the track quality, ~t1!–~t4!, were chosen to be very loose, so as to avoid ambiguities arising from the detailed performance of CDC. Bremsstrahlung in detector materials was widely allowed by loose requirements on the track momentum ~t5! and the calorimeter-energy as-sociation ~p2!.
The constraint on the number of tracks, condition ~1!, allowed for the conversion of an extra photon. The emission of low-energy photons was not restricted, since no constraint was applied to extra calorimeter energies and low-momentum tracks. The angular constraints were determined by the track measurement, ~p1! and ~p3!, while the energy threshold was determined by the calorimeter measurement, ~p2!. Condition ~3! was required in order to uniquely deter-mine the scattering angle. This condition discarded 1.4% of the events.
A total of 96 067 events were selected from 58-GeV data accumulated from 1991 until the end of the experiment in May 1995. The selected sample was subdivided into 12 bins according to the cosine of the scattering angle of the elec-tron. The number of candidate events in each bin (ni) is listed in Table I.
B. Corrections
1. Definition of the signal
In order to allow comparisons with theoretical predic-tions, it is necessary to give an explicit definition of the signal that the experiment measures. Such a definition must be easily simulated in theoretical calculations without ambi-guity. In addition, it is desired to be as close to the experi-mental condition as possible, so that we can minimize ambi-guities irrelevant to the experiment.
In the barrel region, we define the signal to be those events from the reaction e1e2→e1e21ng
(n50,1, . . . ,`), in which the final state consists of a pair of collinear ~uacol<10°! e1 and e2, both scattered to large angles ~ucosuu<0.743! and carrying a large energy ~E>Ebeam/3!. No explicit constraint is imposed on any pho-ton emission. The detection efficiency and background con-tamination were estimated according to this definition.
2. Detection efficiency
Tracking failure: The tracking efficiency of CDC was estimated using a Bhabha-event sample collected by apply-ing tighter requirements on the LG energies and one of the associated CDC tracks. The quality of the other CDC track was then inspected. The study was carried out by two differ-ent methods. In the first, we relied on a good efficiency in the two-dimensional (x2y) reconstruction using axial-layer hits, and estimated the failure rate in the z reconstruction. In the second, we required that the two-track trigger ~ii! was
issued. The tracking quality in inefficient events, in which the examined track did not fulfill the requirements in the event selection, was studied visually.
The two methods gave consistent results. The result from the first method is listed in Table II, where the scattering angle was determined by the successfully reconstructed track. The quoted errors are the quadratic sum of the statis-tical error and a common systematic error of 0.1%, arising from an ambiguity in the event identification. The result cor-responds to a total inefficiency of~0.460.1!%. From a visual inspection we found that the main reason for the failure was electromagnetic interactions of electrons or associated pho-tons in the detector materials.
Charge misidentification: The signal events were re-jected if the charge of either electron was misidentified. The corresponding inefficiency was estimated by using an event sample selected from those events satisfying criteria ~1! and
~2! in the event selection. A connection of a very large LG energy deposit, more than 90% of the beam energy, was required to one of the CDC tracks, in order to purify the sample. Among these events, 1.2% of the events consisted of a pair of same-charge tracks. The estimated inefficiency, the fraction of the same-charge events, in each angular bin is listed in Table II.
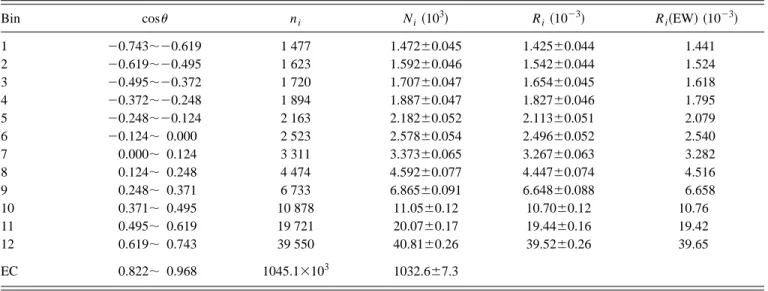
The forward and backward scattering could not be distin-guished in this estimation. We assumed that the inefficiency was forward-backward symmetric. Since the events comprise a pair of back-to-back electron and positron, asymmetry could take place only if possible forward-backward asymme-try in the tracking capability of CDC had certain positive-negative charge asymmetry. We found no significant differ-ence between the numbers of positive- and negative-charge events in the same-charge sample. The result on the tracking failure, which is an extreme case of bad quality in the track-TABLE I. Primary results of this experiment. The number of candidates in the barrel region is divided to angular bins (ni), according to
the scattering angle of the electron. Also listed are the number of signal events (Ni) corrected for the detection inefficiency and the background contamination, the angular distribution (Ri) normalized to the signal yield in the end-cap region, and the prediction for Rifrom
the standard electroweak theory @Ri~EW!# estimated by using ALIBABA. The results from the measurement in the end-cap region are presented at the bottom. The quoted errors are the quadratic sum of the statistical error and the systematic errors. The error correlation is shown in Table IV. The error of Ridoes not include the normalization error~0.7%! from the measurement in the end-cap region.
Bin cosu ni Ni~103! Ri~1023! Ri~EW! ~1023!
1 20.743;20.619 1 477 1.47260.045 1.42560.044 1.441 2 20.619;20.495 1 623 1.59260.046 1.54260.044 1.524 3 20.495;20.372 1 720 1.70760.047 1.65460.045 1.618 4 20.372;20.248 1 894 1.88760.047 1.82760.046 1.795 5 20.248;20.124 2 163 2.18260.052 2.11360.051 2.079 6 20.124; 0.000 2 523 2.57860.054 2.49660.052 2.540 7 0.000; 0.124 3 311 3.37360.065 3.26760.063 3.282 8 0.124; 0.248 4 474 4.59260.077 4.44760.074 4.516 9 0.248; 0.371 6 733 6.86560.091 6.64860.088 6.658 10 0.371; 0.495 10 878 11.0560.12 10.7060.12 10.76 11 0.495; 0.619 19 721 20.0760.17 19.4460.16 19.42 12 0.619; 0.743 39 550 40.8160.26 39.5260.26 39.65 EC 0.822; 0.968 1045.13103 1032.667.3
TABLE II. Estimated detection inefficiency in the barrel region.
Bin Inefficiency~%! Tracking failure Charge misident. Brems-strahlung Angular resolution Angular accuracy Dead LG modules 1 0.5460.23 1.2261.23 1.4660.23 0.7760.29 60 0.7560.32 2 0.1360.14 1.2261.03 1.0660.24 0.0960.30 60 0.4560.29 3 0.6360.22 1.3660.92 0.9360.25 20.1060.34 60 0.9860.46 4 0.4160.18 1.2160.63 0.8960.28 20.3760.35 60 1.3360.27 5 0.3660.17 1.2060.43 0.8860.30 20.4060.34 60.09 2.2860.75 6 0.5660.18 1.4060.30 1.0660.34 0.8460.32 60.11 1.6660.34 7 0.5260.16 1.4060.26 1.0660.34 20.3460.27 60.16 1.5560.63 8 0.5760.16 1.2060.25 0.8860.30 20.0560.23 60.15 2.1760.64 9 0.6860.14 1.2160.23 0.8960.28 20.0460.18 60.24 1.2160.24 10 0.3460.12 1.3660.20 0.9360.25 20.1760.13 60.28 0.8260.22 11 0.3760.11 1.2260.15 1.0660.24 0.1660.09 60.33 0.4260.04 12 0.2760.10 1.2260.12 1.4660.23 1.0360.14 60.27 0.5960.07
ing, indicates that the asymmetry would not be larger than a factor of 2.
Because there was no further evidence supporting the as-sumption, we assigned such a systematic error to the back-ward bins that increases in proportion to ucosuu and amounts to 100% of the estimated inefficiency in the most backward bin. Accordingly, the forward bins also suffer from certain systematic errors, since the observed same-charge fraction was an average between the forward and backward bins. In addition, we assigned an overall systematic error of 0.1%, so as to take account of an ambiguity due to small contamina-tion of background events in the used sample. The error quoted in Table II is the quadratic sum of the statistical error and these systematic errors.
Bremsstrahlung: The signal events may have been lost if the momentum loss due to the bremsstrahlung in materials at smaller radii was very large. We estimated the material thickness from the population of low-momentum electron tracks, pt<1 GeV/c, in Bhabha scattering events. The event sample was collected by requiring tighter constraints on the LG energies and one of the tracks. The contamination of
e1e2g events was subtracted statistically. The obtained fraction of low-momentum tracks was compared with the prediction from the formula for bremsstrahlung @27#. The estimation was carried out separately in each angular bin.
A Monte Carlo sample of Bhabha scattering events was used to estimate the inefficiency. The events were generated by the Tobimatsu-Shimizu~TS! program @7#, which includes all first-order electroweak corrections. The statistics of the sample was about four times the real data. The momentum loss due to the bremsstrahlung was simulated according to the formula that was used for the estimation of the material thickness. The estimated inefficiency is listed in Table II. The inefficiency is forward-backward symmetric since the events comprise both forward-going and backward-going tracks.
From the above study, the average radial thickness of the materials was estimated to be 11% of a radiation length. On the other hand, counting of known detector materials gave a thickness of 9% of a radiation length. Since the difference may be caused by faults in the estimation method, we as-signed an overall systematic error of 15% to the estimated thickness. The errors quoted in Table II correspond to this ambiguity. The total inefficiency due to the bremsstrahlung was estimated to be ~1.260.2!%.
Multitrack production: The signal events may have been
discarded if more than two additional tracks were produced by interactions of electrons or associated photons in the de-tector materials. A study was carried out using a Bhabha sample, in which the requirement on the number of tracks was relaxed, but a very large total energy in LG was re-quired. We visually investigated multitrack events in the sample, and found that the inefficiency due to the multitrack production was smaller than 0.05%.
Angular resolution: The finite resolution in the scatter-ing angle measurement reduces the efficiency near the edge of the acceptance. This effect was evaluated by a simulation using the Monte Carlo sample. The scattering angles of the electrons were smeared according to the measured angular resolution, Eq.~2!, and resultant decrease of the event yield ~inefficiency! was counted. The result is listed in Table II,
where the systematic error arising from the uncertainty in the resolution is added to the statistical error of the simulation. The inefficiency is significant only in the edge bins. The total inefficiency was~0.4460.06!%.
Angular accuracy: The polar angle of CDC tracks was measured from consistency between hits in the axial layers and the stereo layers. Errors in the wire-fix position along the beam axis may have resulted in a systematic shift of the measured angles. From surveys during the construction, we infer that the accuracy was better than 1 mm for the half length of the wires ~1.5 m!. However, a confirmation using the data is necessary since other unexpected errors may have had similar effects.
Position errors equivalent to systematic deformations of the endplates would result in a mismatch in the z intercepts or a mismatch in the scattering angles of two back-to-back tracks. The mismatch in the scattering angles of this sort can be distinguished from the effect of the beam-energy imbal-ance because of the different angular dependence. We found no significant mismatch in Bhabha scattering events, and set upper limits as uDcotu/cotuu,1024anduDcotuu,1023. From simulations, we found that possible effects of the allowed shifts are very small, less than 0.05% in the total yield.
On the other hand, those equivalent to the error in the total length of CDC are inaccessible by analyses of CDC alone. A study was carried out utilizing information from the barrel streamer tubes ~BST!. The track positions measured by BST were compared with the extrapolation of CDC tracks. The comparison was made for tracks in muon-pair events. We found no significant inconsistency and obtained an upper limit of uDcotu/cotuu,1.331023. The limit corre-sponds to a 2 mm uncertainty for the half-length of CDC. The corresponding total uncertainty in the event yield was estimated by the simulation to be 0.25%. The uncertainty in each angular bin is shown in Table II. The results for the backward four bins were ignored and set to zero, because they were fairly smaller than other errors and statistically insignificant.
The tilt of CDC with respect to the beam axis was not larger than 1 mrad, even if possible gradient of the beams with respect to the design orbit was taken into account. The effect of a tilt of this size is very small, less than 0.02% in the total yield.
Other tracking-related inefficiencies: The effect of the momentum resolution, Eq. ~1!, was very small because we set the momentum threshold very low. Turning the resolution on and off in the simulation altered the efficiency by only 0.02%. The effect of possible shifts of the momenta, which may have been caused by a systematic shift of the wire po-sitions or an error in the magnetic field, was also very small. The relative shift Dpt/ pt was estimated to be smaller than 1023 around the threshold. This estimate corresponds to an ambiguity in the detection efficiency at a level of 1025.
Particle motion inside the beam bunches and a possible energy imbalance between the incoming electron and posi-tron may have resulted in certain effects similar to the track-ing resolution and shifts. However, from the simulation, we found that their influence on the detection efficiency was smaller than 0.01%.
Dead LG modules: Since the LG array had no obvious gap within the angular coverage, dead modules were the
main source of the detection inefficiency in the calorimetry. We carried out light pulser tests employing xenon flash tubes ~Xe tests! in order to monitor the response of the LG mod-ules. Unrecoverable bad modules found in the tests were removed in the off-line analyses.
An event analysis was carried out to confirm the Xe-test results. A Bhabha event sample was selected by applying tight requirements on CDC tracks and one of the associated LG energy clusters. Then, we inspected those events in which neither of the CDC tracks was connected to any high-energy cluster ~dead-module search!. All 24 modules that had been removed prior to the start of the 1991 runs were found as candidates in this search.
Inspecting the response of candidate modules in all events, we found eight dead modules and four low-gain modules, in addition to the 24 removed modules. The eight dead modules died during the period relevant to the present analysis. Among them, six modules were dead only for the last 12% of the data. Among the four low-gain modules, two modules showed very small responses, less than 9 GeV, throughout the experiment. The other two modules were nor-mal in earlier 25% of the data.
The inefficiency due to the identified dead modules was estimated by two methods. In the first method, we estimated the contributions of single dead modules by using a rotation method, in which a normal module at an azimuthally rotated position from a dead module was removed, and the resultant decrease of events in the Bhabha sample was counted. The inefficiency was evaluated by adding the contributions, ac-cording to the time-dependent list of the dead modules.
In the second method, the rotation method was applied to all known dead modules simultaneously, so that the ineffi-ciency was directly evaluated. The estimation was carried out for several rotation angles. The two methods gave results consistent with each other. The discrepancy was smaller than 0.1%. The total inefficiency was from 0.8% to 1.1%, depend-ing on the period. The inefficiency in each angle bin, esti-mated by the first method and averaged over the periods, is shown in Table II.
We visually inspected inefficient events found in the dead-module search. Though most of them were due to the identified dead modules, a certain number of events re-mained unidentified or ambiguous. The fraction of such events gives us an estimation on the reliability of the search. The errors quoted in Table II are the quadratic sum of the statistical error and the systematic error evaluated from the 90% confidence-level limit for the count of the ambiguous events. The total inefficiency averaged over the periods was ~0.860.1!%.
Abnormal response of LG: We were further concerned about the existence of unknown low-gain modules. A study was carried out using a response function of LG extracted from real data. We selected a purified Bhabha sample by tightening the acollinearity angle cut and the momentum cut in the event selection to 3° and 10 GeV/c, respectively. The association of a very high energy, larger than 0.8Ebeam, was required with one of the tracks. The response function was extracted from the spectrum of the LG energy associated with the other track. The energies in the simulated events were then convoluted by the response function. Conse-quently, the change of the efficiency caused by the
convolu-tion was smaller than 0.01%. Namely, the effect of unknown low-gain LG modules was negligible, even if they existed.
Other calorimetry-related inefficiencies: The effect of the energy resolution of LG was negligible. Even if the reso-lution was degraded to twice the nominal value in the simu-lation, the resultant change of the efficiency was only 0.02%. The effect of the error in the energy normalization was also negligible. We know that this error was not larger than 3%, from the response to the Bhabha events and the invariant mass of reconstructed neutral pions in multihadron events. The simulation showed that, even if there was a 10% error, it would cause an uncertainty of only 0.01% in the efficiency.
Trigger: The trigger inefficiency was negligible, since the event trigger was redundant for the Bhabha events in the barrel region. Triggers ~i!, ~ii!, ~iii!, and ~iv! were simulta-neously issued in most of the events. We found that the energy trigger~i! was issued in all selected events. The track trigger~iii!, which was independent of trigger ~i!, was issued in 98% of the selected events. From these facts, we can es-timate that the inefficiency of trigger~i! alone was already at a level of 1025or smaller.
3. Background contamination
Nonsignal e1e21ng: Consider those e1e21ng
events in which the e1e2 pair satisfied the angle and track-momentum requirements in the selection but one of the elec-trons did not satisfy the energy requirement, E>Ebeam/3. They are not signal events, but may have been selected as the candidates, if a high-energy photon was emitted near to the low-energy electron ~cluster coalescence!. The contamina-tion of such events was estimated by using the Monte Carlo sample. The estimated contamination is listed in Table III.
The uncertainty arising from ambiguities in the angular coverage and the angle measurement by LG was found to be smaller than 0.01% from simulations. Whereas, a sizable am-biguity is suspected in the theoretical calculation, since the calculation was at the tree level for e1e2g events. We as-signed an overall error of 10% to the estimates. The errors quoted in Table III are the quadratic sum of the statistical error in the simulation and this systematic error. The total TABLE III. Estimated background contamination in the barrel region. Bin Contamination~%! Nonsignal e1e21ng gg t1t2 Multihadron 1 1.4060.20 0.6660.66 2.9760.49 0.0760.09 2 1.3660.20 0.4160.41 2.9860.49 0.1360.14 3 1.3460.19 0.3060.30 2.7260.45 0.1860.20 4 1.1260.16 0.2260.22 2.3360.39 0.1760.18 5 1.2160.17 0.1760.17 1.7860.30 0.2760.28 6 1.5060.19 0.1460.14 1.5060.25 0.2160.22 7 1.2260.15 0.1160.11 0.8560.15 0.1360.13 8 1.4060.16 0.0860.08 0.6160.11 0.0560.05 9 1.3960.16 0.0660.06 0.4660.08 0.0860.08 10 1.3360.14 0.0560.05 0.2460.04 0.0560.06 11 1.2860.13 0.0360.03 0.1360.02 0.0260.02 12 1.3160.13 0.0260.02 0.0560.01 0.0160.01
contamination was estimated to be~1.3160.13!%.
Even if the electron pair did not satisfy the angular re-quirements, nonsignal e1e21ng events could be present if a high-energy photon, emitted antiparallel to one of the elec-trons, converted in the detector materials. We estimated the production cross section of such events that would satisfy the selection criteria if the photon energy was used instead of the momentum of one of the electrons. The estimation was car-ried out using the TS program and another Tobimatsu-Shimizu program @28#. The latter generates those events in which one of the electrons escapes to small angles.
The cross section was estimated to be 4.6 pb. From this result, we can roughly estimate the contamination to be 0.14%, using the cross section of the signal of about 330 pb and the average photon conversion probability of 10%. The actual contamination must have been smaller, since the mo-menta of the conversion electrons are lower than the parent photons and the tracking capability would be bad for the conversion electrons. Therefore, we can expect the contami-nation of this type to be negligible, compared to the cluster-coalescence background.
gg: Theggevents could contaminate the Bhabha event sample if both photons converted. The total cross section of the gg events is about 40 pb within ucosuu<0.743 at
A
s558 GeV. Multiplying the cross section with the averagedouble-conversion probability of 1%, we obtain a rough es-timate of the contamination of 0.4 pb, which corresponds to 0.12% of the signal. This must be an overestimation since the tracking capability would be bad for the conversion elec-trons. Indeed, a simulation including the detector effects gave an estimate of 0.03%. Conservatively, we estimated the total contamination to be~0.0660.06!%.
The contamination in each angular bin, estimated in the same way, is listed in Table III. Although the average is very small, the contamination is not negligible in backward bins since the angular dependence is quite different from Bhabha scattering events.
t1t2: The contamination from t1t2 events was
esti-mated by using a Monte Carlo simulation, employing an event generator@29# followed by decays withJETSET7.3@30# and a full detector simulation. The decay branching ratios were updated to the Particle Data Group~PDG! values @31#. A total of 5000 events were generated and passed through the Bhabha selection. The estimated contamination was 0.43% of the Bhabha signal.
A possible error of the estimation was evaluated by changing the branching ratios. When we changed them within twice the errors quoted by PDG, the maximum varia-tion of the contaminavaria-tion was 0.05%. We found in the simu-lation that most of the contaminating events included at least one tdecaying to the enn or rn final state. Therefore, the ambiguity in the calorimeter energy normalization may cause a sizable error in the estimation. We estimated the uncer-tainty by changing the normalization by 63%, and found that it resulted in a 0.03% change in the contamination.
Quadratically adding these uncertainties, we estimated the total contamination to be~0.4360.06!%. The estimated con-tamination in each angle bin is shown in Table III, where the statistical error of the simulation is added in quadrature. The contamination is as much as a few percent in backward bins, while it is negligible in the most forward bin.
Multihadron events: The contamination from the multi-hadron events was estimated to be 0.05% of the Bhabha signal by using a Monte Carlo simulation, JETSET7.3 with patron shower @30# followed by a full detector simulation.
For a confirmation, we studied the number of low-momentum tracks in the Bhabha candidate events. We se-lected those events which had five or more tracks with a pt threshold of 0.2 GeV/c. About 0.2% of the candidate events were such events, while more than 90% of the multihadron contamination was expected to remain. Among the selected events, one-half of the events had very large LG energies and were apparently Bhabha scattering events with shower-like interactions.
The remaining events, 0.1% of the Bhabha candidates, may have originated from multihadron production, though the t1t2 contribution seemed to be appreciable since the events showed negative forward-backward charge asymme-try. From these facts, we conservatively estimated the con-tamination of the multihadron events to be ~0.0560.05!%. The contamination in each bin, estimated in the same way, is shown in Table III. The errors are the quadratic sum of the systematic error and the statistical error of the simulation.
Two-photon processes: The contamination from two-photon processes, e1e2→e1e2e1e2, e1e2t1t2, and
e1e2qq¯, was evaluated by using simulation samples
gener-ated according to the lowest-order QED cross section @32#. Applying the Bhabha selection to the samples, we found the total contamination was smaller than 0.05% of the Bhabha signal.
C. Results
The errors associated with the corrections described above have a certain correlation between angular bins. Such a correlation can be handled by means of the error ~covari-ance! matrix technique. The error matrix is determined as
Ci j5
(
k Di~k!D
j
~k!, ~3!
where k runs over all independent components of the error. The factorDi(k) is the nominal~one standard-deviation! shift of the result in the ith bin, corresponding to the kth error component. If the kth component is relevant to the ith bin alone, such as a statistical error, D(k) is nonzero for the ith bin only.
The total error in the ith bin is given by the diagonal component of the error matrix as
Di5
A
Cii, ~4! and the error of the total sum is given byDtotal5
A
(
i, jCi j. ~5!
The correlation matrix ~ri j! is defined as
Ci j5ri jDiDj. ~6! By the definition, diagonal elements ofri j are all unity and rji5ri j.
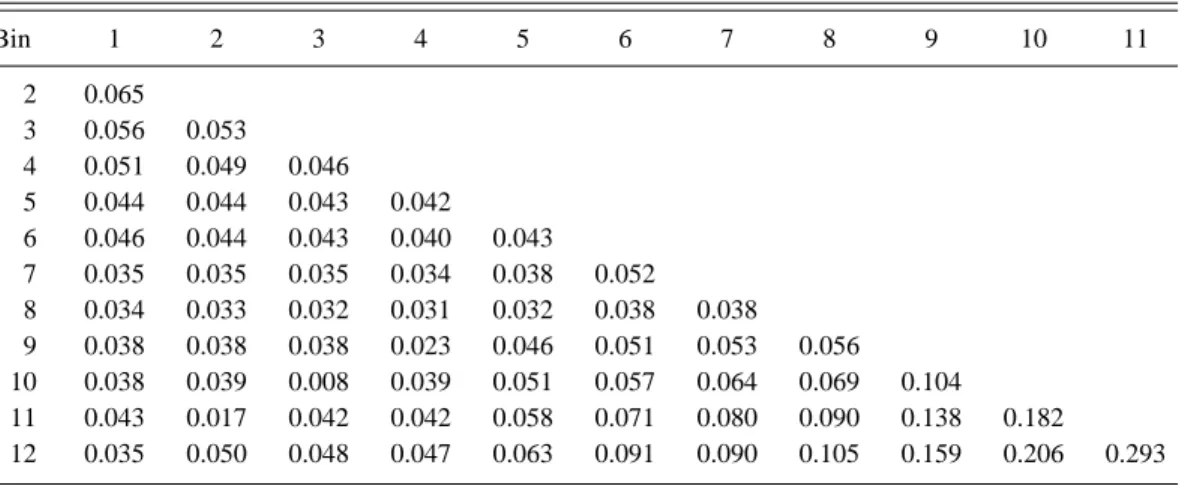
The number of signal events (Ni) corrected for the detec-tion inefficiency and the background contaminadetec-tion is listed in Table I. The errors are the sum of the statistical error of ni and the systematic errors shown in Table II and Table III, evaluated from the error matrix according to Eq. ~4!. Note that one item of the correction often contained several inde-pendent sources of the error, as described in previous sub-sections. Estimated nondiagonal elements of the correlation matrix are presented in Table IV. The correlation is signifi-cant between forward bins. The elements r1,12, r2,11, r3,10, and r4,9 are relatively small because of the presence of a negative correlation in the error of the charge mis-identification probability.
Using Eq. ~5!, the total inefficiency was estimated to be ~4.0660.36!% and the total background contamination was ~1.8660.17!%. These corrections lead to a total number of signal events of ~9.81860.050!3104, where the error in-cludes the statistical error~0.3%! as well.
The distributions of the acollinearity angle, track mo-menta and associated LG energies of the candidate events are shown in Figs. 3–5. The corresponding results from simula-tions, Bhabha scattering events including the cluster-coalescence background plus the tt and multihadron con-tamination, are overwritten with histograms. The tt and multihadron contamination, which is separately shown with hatched histograms, is the result of a full detector simulation and normalized to the approximate luminosity. The Bhabha events generated by the TS program were smeared according to the bremsstrahlung formula and detector resolutions, and are normalized to the total number of events.
In the acollinearity angle distribution~Fig. 3!, a disagree-ment can be seen at very small angles. This is attributed to an effect of the multiple photon emission, ignored in the simu-lation. This is not a problem since the agreement is satisfac-tory at large angles near the cut value.
The measurement and simulation are in good agreement in the momentum distribution~Fig. 4!. Discrepancies are ob-served only in high-momentum regions, far away from the threshold. The shift of the peak position in Fig. 4~b! is due to a non-Gaussian behavior of the momentum resolution in the data. The peak position depends on such details because the distributions in Fig. 4 are biased by the selection of the lower and higher momentum tracks. Unbiased distributions, e.g,
p/Ebeamdo not exhibit such a shift. On the other hand, the
momentum resolution is not an issue at low momenta near the threshold. The good agreement at low momenta shows that the applied simulation of the bremsstrahlung, which played an important role in the estimation of the efficiency, is reliable.
We can see apparent discrepancies in the LG energy dis-tributions. The discrepancies at high energies are due to an unrealistic energy resolution assumed in the simulation; e.g., non-Gaussian tails are not taken into consideration. The dis-agreement at medium energies in Fig. 5~b! is mainly due to an inaccurate simulation of shower overlaps.
In the simulation, we assumed that deposits having open-ing angles smaller than 5°, which is comparable with a typi-cal size of one LG module, were merged to one energy clus-ter. The result from another simulation, in which the merge angle was narrowed to 1°, is shown with dotted histograms for a comparison. We can see that the population of Bhabha events steeply decreases at small energies, Elower,Ebeam/2, regardless of the details of the simulation. This is the reason TABLE IV. Nondiagonal elements of the correlation matrix~ri j! for the errors of Niand Riin Table I.
This is valid also for the errors of Ri
EB and dREB/dV in Table V. Bin 1 2 3 4 5 6 7 8 9 10 11 2 0.065 3 0.056 0.053 4 0.051 0.049 0.046 5 0.044 0.044 0.043 0.042 6 0.046 0.044 0.043 0.040 0.043 7 0.035 0.035 0.035 0.034 0.038 0.052 8 0.034 0.033 0.032 0.031 0.032 0.038 0.038 9 0.038 0.038 0.038 0.023 0.046 0.051 0.053 0.056 10 0.038 0.039 0.008 0.039 0.051 0.057 0.064 0.069 0.104 11 0.043 0.017 0.042 0.042 0.058 0.071 0.080 0.090 0.138 0.182 12 0.035 0.050 0.048 0.047 0.063 0.091 0.090 0.105 0.159 0.206 0.293
FIG. 3. Acollinearity angle distribution of the candidate events in the barrel region. The histogram shows the expectation from a simulation, including both the signal and the background. The esti-mated contamination from thett and multihadron events is shown with the hatched histogram. The simulation for the Bhabha-scattering events is normalized to the total yield.
why the detection efficiency is insensitive to the detailed characteristics of LG.
The discrepancy that we can see near the threshold in Fig. 5~b! could be serious, since it cannot be recovered by a fine-tuning in the simulation. We selected those events which exhibited very low energies, Elower/Ebeam,0.45, and investi-gated the spectrum of Ehigher. The obtained spectrum is shown in Fig. 6, together with the corresponding simulation result. The signal and the background are clearly separable in this spectrum. In a background dominant region,
Ehigher/Ebeam,0.8, the measurement is in good agreement with the simulation. Observed discrepancy in this region ~8%! is smaller than the systematic error estimated for thett and multihadron contamination.
On the other hand, a discrepancy is apparent in a higher energy region in Fig. 6. From a visual inspection, we found that this was due to an effect of dead LG modules, where one of the electrons hit the LG array close to one of the dead modules. Such effects were not taken into account in the simulation. However, this is not a problem since the dead-module effects were evaluated using real data.
IV. ANALYSIS IN THE END-CAP REGION A. Event selection
The event selection can be simpler in the forward ~end-cap! region since the background is less severe. The selec-tions applied were based on information from the end-cap calorimeters~LA! alone. We required that at least one pair of
high-energy ~E>Ebeam/3! and collinear ~uacol<4°! LA-energy clusters be observed in an angular region of 0.822<ucosuu<0.968. The scattering angle ~u! was deter-mined from the shower-center position measured by LA, as-FIG. 4. Momentum distribution of the CDC tracks of the
can-didate events in the barrel region. The distribution is shown for~a! the higher-momentum track and ~b! the lower-momentum track, separately. The definition of the histograms is the same as Fig. 3.
FIG. 5. Distribution of the LG energies of the candidate events in the barrel region. The distribution is shown for ~a! the higher-energy cluster and ~b! the lower-energy cluster, separately. The definition of the solid histograms is the same as Fig. 3. The dashed histograms show the result from another simulation, where electro-magnetic showers in LG are assumed to be merged to one cluster if the opening angle is smaller than 1°, instead of the standard as-sumption of 5°.
FIG. 6. Distribution of the higher LG energy in those events which exhibit very low energies, Elower/Ebeam,0.45, in Fig. 5~b!. The definition of the histograms is the same as Fig. 3.
suming that the particles originated from the center of the detector.
The inner edge of the acceptance corresponds to the boundary between ring 2 and ring 3 of LA, and the outer edge corresponds to the boundary between ring 9 and ring 10. The requirement on the collinearity was chosen to be tighter than in the barrel region, so as to avoid contamination from collisions of satellite beam bunches. A total of 1045.13103events were selected.
B. Corrections
1. Definition of the signal
In the end-cap region, the signal was defined to be those events from the reaction e1e2→e1e21ng~n50,1, . . . ,`!,
in which both e1 and e2 scattered to a forward region ~14.53°<u<34.71°!, both had large energies ~E>Ebeam/3! and the acollinearity angle between them was smaller than 4°. The backward scattering was treated as background.
2. Detection efficiency
Shower fluctuation: The angular acceptance was blurred by the fluctuation of the shower development in LA and materials placed in front of it. Corresponding changes in the event yield were evaluated by applying a full detector simu-lation of Monte Carlo events generated by the TS program @7#. The distributions of known materials, such as the struc-ture and support of the detector components, were all imple-mented in the simulation. However, certain ambiguities re-mained in the distribution of some materials at small angles, such as readout electronics and cables of the vertex chamber and the trigger chamber. In the simulation, these materials were modeled with cylinders placed at appropriate positions. The thicknesses of the cylinders were tuned so that the simu-lated energy response of LA reasonably reproduced the mea-surements.
From the simulation, we found a decrease in the Bhabha-event yield ~inefficiency! due to the shower fluctuation of ~0.860.4!%. The error is dominated by the ambiguity in the material distribution. The measured energy spectrum of LA for the electrons in Bhabha events is plotted in Fig. 7. The solid histogram shows the spectrum from the simulation un-der the optimum setting. The other histograms correspond to the minimum and maximum thicknesses of the materials that we assumed in the error estimation. The measurement shows a wider spectrum than those of the simulations, indicating a non-uniform distribution of materials. We can see that the full range of the assumption about the thickness covers the non-uniformity.
It should be noted that the effect of the shower loss itself on the detection efficiency was negligible, since the energy threshold was set very low. The inefficiency was caused by the lateral shower fluctuation of electrons scattered near to the inner edge of the acceptance.
Spread of the interaction point: The spread of the inter-action point causes a decrease of the acceptance. Since the lateral spread was very small, what we should be concerned about is the longitudinal spread of 1.0 cm. A naive simula-tion, in which the error in the position measurement was treated as an independent Gaussian fluctuation, showed a
de-crease in the Bhabha event yield of 0.3%.
On the other hand, the full detector simulation showed a 0.5% increase in the yield when we added the longitudinal spread. Since a reasonable decrease was observed when we enlarged the spread, the difference is attributed to an effect of a correlation in the position measurement ignored in the naive simulation. Consequently, we adopted the estimation from the full simulation and, for safety, added one-half of the discrepancy from the naive simulation~0.4%! to the system-atic error, since the mechanism was not clearly understood.
Placement of the LA counters: Accurate information on the placement of the LA counters was crucial in order to precisely determine the acceptance. The placement error was measured from inconsistencies between measured positions of two electrons in Bhabha scattering events. A study was also carried out by comparing the positions with the extrapo-lation of CDC tracks at larger angles. Both measurements gave consistent results, despite the fact that they used infor-mation in different angular regions.
From these measurements, we found an overall transverse displacement of the LA system of 3.961.1 mm with respect to the beam line, a relative transverse displacement between the counters of 4.261.6 mm, and a parallel displacement along the beam line of 2.660.8 mm with respect to the av-erage interaction point. Furthermore, the distance between the counters was found to be shorter by 7.665.0 mm than the design value. The error in the distance is dominated by the ambiguity in the angle measurement by CDC.
The naive simulation and the full simulation gave a con-sistent estimation of the inefficiency due to the displace-ments. The estimated inefficiency was~0.860.3!%. Note that the effects of the placement errors, except for the error in the distance, were smeared by the shower fluctuation and the interaction point spread, whose effects were already taken into account.
FIG. 7. Energy response of LA for the electrons in Bhabha events. The sum of the energies observed in rings 3 and 4 in each counter is plotted. The solid histogram shows the simulation result under the optimum setting of the material distribution. The other histograms correspond to the minimum and maximum thicknesses of materials that we imposed in the error estimation. The simulation results are normalized to the total yield.
Dead channels: Another source of inefficiency was the dead channels of LA. Dead channels were found by inspect-ing hit maps in representative periods of the experiment. A total of 46 channels were dead at the start of the 1991 runs. They increased to 132 channels at the end of the experiment. However, since LA had four longitudinal segments and the main part of the electromagnetic energy was deposited in the first two segments, the effect was negligible even if the third and fourth segments were dead. The number of modules in which both the first and second segments were dead was 11 at the end of the experiment. Either the first or second seg-ment was dead in 12 modules.
The inefficiency due to the dead channels was estimated by adding contributions of single modules~one-module con-tributions!, taking into account the time dependence of the dead-channel distribution. The one-module contributions were evaluated using the collected Bhabha scattering events by means of a rotation method similar to that applied to the LG modules. The evaluation was carried out for typical pat-terns of dead segments in the modules.
The estimated inefficiency, averaged over the relevant ex-perimental period, was~1.2760.24!%. The error includes the uncertainty in the estimation of the one-module contributions and in the time dependence. The estimation was confirmed by another analysis in which the rotation was applied to all dead channels simultaneously.
Trigger: The candidate events were mainly triggered by the LA total-sum trigger~v!. The trigger efficiency was stud-ied by using a preselection sample for a study of multihadron production. Recorded information on trigger~v! was investi-gated in those events which were triggered by at least one of the other triggers. The analysis was applied to the sample selected from all 58 GeV data since 1991. We found that trigger ~v! was issued in all 2110 events that had large en-ergy deposits, larger than 1/3 of the beam enen-ergy, in both LA counters. The result suggests that the inefficiency was at most 0.1% and negligible compared to other errors.
The estimation was confirmed by another study, where we inspected the individual trigger information from the two LA counters recorded in the Bhabha candidate events. The effi-ciency could be crosschecked since events were triggered if either counter issued the trigger signal. We inspected nearly one-half of the candidates~about 440k events! in representa-tive periods, and found no loss of the trigger signal in both counters. This indicates that the trigger inefficiency was far smaller than 0.1%.
3. Background contamination
Since the Bhabha-scattering cross section is very large in the end-cap region, the background was dominated by non-signal e1e21ng events. The contamination of these events was estimated by using the TS programs@7,28# and found to be 2.0% of the signal. Among them, the contribution of the backward scattering was only 0.14%. The other part was the contribution of e1e2g events in which the photon was misi-dentified as an electron. The ambiguity due to the shower overlap was smaller than 0.1%. Taking possible higher-order contributions into consideration, we estimated the contami-nation of non-signal e1e21ng events to be~2.060.2!%.
The ggevents were not separated from the e1e2events in the event selection. Their contamination was estimated by
using a ggevent generator @33# to be ~1.5660.05!% of the obtained candidates, where the estimation was normalized to the approximate luminosity with an uncertainty of 2.7%. The contamination from the t1t2 and multihadron production was negligible; both were at the 0.01% level.
C. Results
From the estimation described above, we evaluated the total inefficiency to be ~2.460.7!% with a total background contamination of ~3.660.2!%. These estimates lead us to a corrected number of signal events in the end-cap region ~NEC! of ~1032.667.3!3103.
V. PHYSICS DISCUSSIONS A. Model-independent angular distribution
In order to compare the measurements with theoretical predictions, we define a normalized angular distribution (Ri) as Ri[ Ni NEC 5 si sEC , ~7!
wheresiis the integrated cross section in the ith angular bin of the barrel region and sEC is the total cross section in the end-cap region, to be evaluated according to the definition of the signal in each region. The quantity Ri is independent of any specific theory or model since no theoretical unfolding is applied. The obtained Ridistribution is presented in Table I. This is the primary result of the experiment, from which all numerical results are extracted in the following physics dis-cussions. Note that the quoted errors do not include the over-all normalization error of 0.7% arising from the measure-ment in the end-cap region. It is otherwise taken into account in numerical evaluations.
B. Comparison with the standard electroweak theory
The prediction of the standard electroweak theory for the
Ri distribution was calculated by using a computer program
ALIBABA @9#.ALIBABAincludes the exact first-order
photon-radiation correction and a dominant part~leading-log part! of the second-order corrections, as well as internal electroweak loop corrections. Further higher orders of the photon-radiation corrections are partly included by an exponentia-tion. Other programs @10# including second-order photon-radiation corrections are not adequate for the present use. They use approximations which are appropriate for the Z0 resonance region but lead to appreciable inaccuracies at TRISTAN energies.
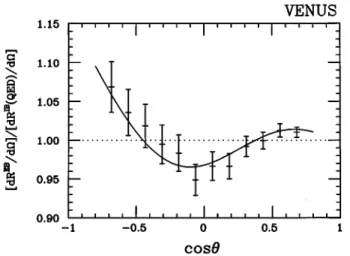
The prediction is shown in the last column of Table I@34#. Input physical parameters ofALIBABA, the masses of Z0, the top quark and the Higgs boson, were chosen to be 91.19, 170, and 300 GeV/c2, respectively. The ratio of the measure-ment to the prediction @Ri/Ri~EW!# is plotted in Fig. 8. The error bars correspond to the total error presented in Table I while inner ticks marked on the bars show the contribution of the statistical error alone. The latter dominates in all bins. The normalization error arising from the error of NEC~0.7%! is indicated by the dashed lines. No significant deviation from unity can be found.