Page 1 of 19
An improvement of signal-to- noise ratio for phase image
Poster No.: C-0803 Congress: ECR 2017 Type: Scientific Exhibit Authors: N. Ikemitsu1
, Y. Kanazawa1, Y. Matsumoto1, H. Hayashi2, T. Usuda1, T. Sasaki1, M. Miyoshi3, M. Harada1; 1Tokushima/JP,
2
Tokushima, Tokushima/JP, 3Hino/JP
Keywords: MR physics, Computer applications, Contrast agents, MR, Experimental investigations, Computer Applications-General, Physics, Biological effects
DOI: 10.1594/ecr2017/C-0803
Any information contained in this pdf file is automatically generated from digital material submitted to EPOS by third parties in the form of scientific presentations. References to any names, marks, products, or services of third parties or hypertext links to third-party sites or information are provided solely as a convenience to you and do not in any way constitute or imply ECR's endorsement, sponsorship or recommendation of the third party, information, product or service. ECR is not responsible for the content of these pages and does not make any representations regarding the content or accuracy of material in this file.
As per copyright regulations, any unauthorised use of the material or parts thereof as well as commercial reproduction or multiple distribution by any traditional or electronically based reproduction/publication method ist strictly prohibited.
You agree to defend, indemnify, and hold ECR harmless from and against any and all claims, damages, costs, and expenses, including attorneys' fees, arising from or related to your use of these pages.
Please note: Links to movies, ppt slideshows and any other multimedia files are not available in the pdf version of presentations.
Aims and objectives
Transverse relaxation time (T2) is a time constant which includes only nuclear-nuclear
interactions. T2 *
is a time constant including nuclear-nuclear interactions and static magnetic field (B0) inhomogeneity, which is affected by susceptibility. Setting of T2 or T2
*
is generally applied to long echo time (TE). It is generally known that the T2 *
decay is a faster process than the T2 decay. If a material has strong susceptibility, e.g., blood, FeO,
and MR contrast media, the T2 *
decay is faster.
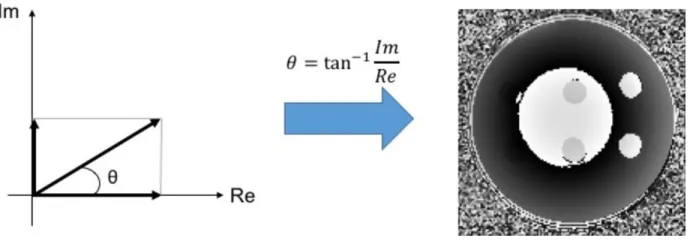
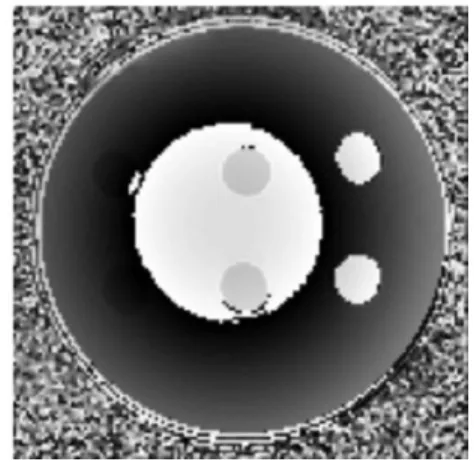
In magnetic resonance (MR) imaging, a magnitude image takes an absolute value from real and imaginary parts and is used normally in clinical. A phase image made from phase differences of real and imaginary parts which are a reflection of variable information of a local magnetic field. A phase image has good contrast and reveals detail structures that are not visible on the corresponding magnitude image, e.g., it obtains information concerning iron deposit as phase in blood vessels and tissue [1, 2]. The phase image has contrast depending on the susceptibility and TE of each tissue. Moreover, it is used to make a susceptibility weighted image (SWI) [3]. Accordingly, signal-to-noise ratio (SNR) of a phase image is an important factor.
Fig. 1: How to make a phase image
References: Tokushima University - Tokushima/JP
Wu B et al., have been reported that the SNR of image phase depends on TE, each material's T2
*
, and offset frequency [4]. Here, we are concerned with the indication of maximum SNR of the image phase when TE is equal to T2
*
. Therefore, the purpose of this study is to investigate temporal characteristics of the phase SNR, and make a phase image with high SNR by using phase data at the optimized TE. Accordingly, we improve the SNR of the phase image by focusing T *.
Page 3 of 19 Images for this section:
Fig. 1: How to make a phase image © Tokushima University - Tokushima/JP
Methods and materials
1. Phase SNR
In general, theoretical formula of T2 *
decay is described as follows,
Fig. 2
References: Tokushima University - Tokushima/JP
where is the MR signal, is the transverse magnetization, and is the TE. When the noise variance of real and imaginary channel are equal, noise power in the phase is described by the following equation,
Fig. 3
References: Tokushima University - Tokushima/JP
where represent the noise variance in real or imaginary parts with the noise power. Then, the phase SNR (SNR#) at is shown as [4],
Page 5 of 19 Fig. 4
References: Tokushima University - Tokushima/JP
where is the frequency offset. The above equation is differentiated by,
Fig. 5
References: Tokushima University - Tokushima/JP
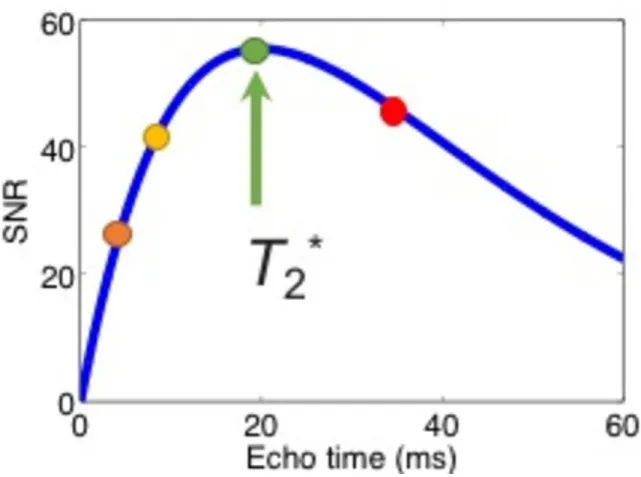
the phase becomes maximum when the TE is equal to the T2 *
. In other words, the T2 *
is the optimal TE when considering the best .
Fig. 6: Relationship between TE and phase SNR References: Tokushima University - Tokushima/JP 2. MR imaging
On a 3.0T MRI system, both phantom was acquired with three-dimensional fast spoiled gradient-echo (3D-SPGR). The other imaging parameters are shown in Fig7.
Fig. 7: Image parameter
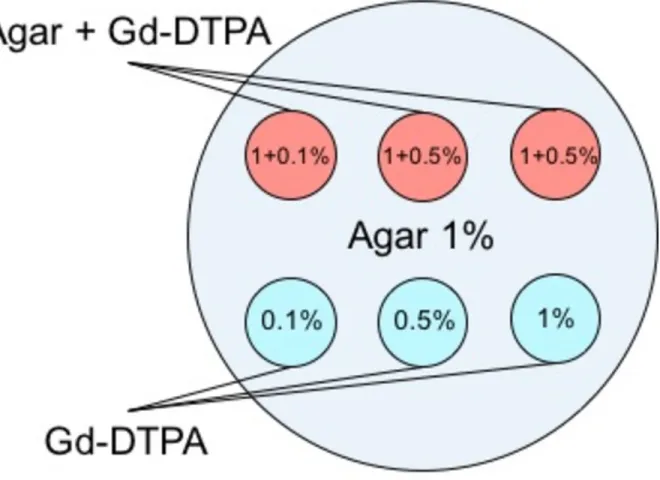
Page 7 of 19 We made a phantom using six tubes of gadopentetate dimeglumine (Gd-DTPA; Magnevist, Bayer Pharma AG, Germany) at different concentrations (0.1, 0.5, and 1.0 wt %) and Gd-DTPA (0.1, 0.5, 1.0 wt%) and with agar (1.0 wt%). The six tubes were fixed in agar (1.0 wt%) and placed within a cylindrical container.
Fig. 8: Phantom component
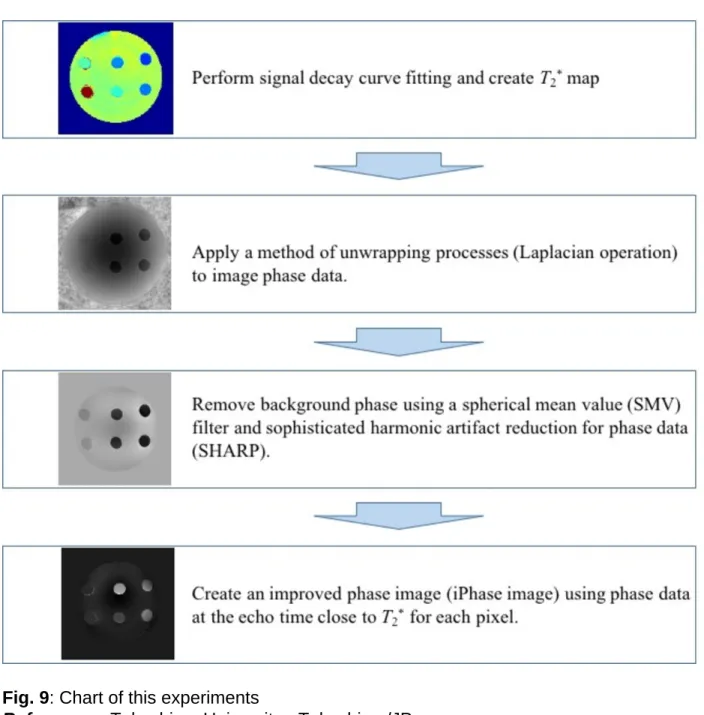
Fig. 9: Chart of this experiments
References: Tokushima University - Tokushima/JP
3. Data analysis
We determined regions of interest (ROIs) for each sample and calculated mean T2 *
and SD. SNRs were performed normalization at maximum phase SNR on each TE. We determined TE at maximum phase SNR and T2
*
. Coefficient of determination was calculated to confirm accuracy of T2
*
curve fitting. We applied iPhase image to SWI and calculated SNR defining using the following equation (5) :
Page 9 of 19 Fig. 10
References: Tokushima University - Tokushima/JP
All statistical analysis was performed using MATLAB (MathWorks, Inc., Natick, MA, USA). SMV and SHARP algorisms were used with our custom-written codes at http:// weill.cornell.edu/mri/pages/qsm.html. We performed our analysis on a MacBook Pro (4 cores, Corei7 2.4 GHz with 16 GB RAM).
Fig. 6: Relationship between TE and phase SNR © Tokushima University - Tokushima/JP
Fig. 9: Chart of this experiments
Page 11 of 19
Results
Figure 11 shows measured T2 *
values for each sample of the phantom. The T2 *
fluctuation calculation was only high for the Gd-DTPA 0.1% sample when compared to the other samples.
Fig. 11: T2* values at each sample of a phantom References: Tokushima University - Tokushima/JP
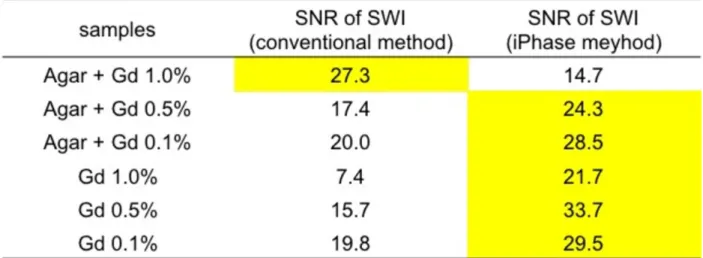
Figure 12 shows SNR values for each sample of the phantom. SWIs were derived from the conventional method and our method. SWI derived from iPhase showed in higher SNR than conventional SWI.
Fig. 12: Comparison of SWIs derived from the conventional method and our method References: Tokushima University - Tokushima/JP
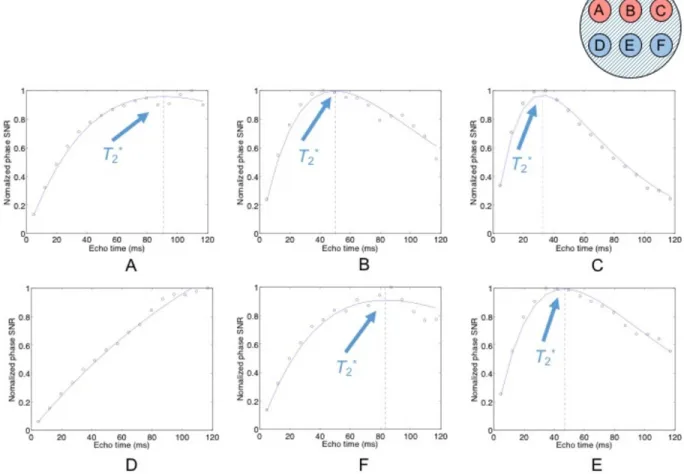
Fig. 13: Relationship between TE and normalized phase SNR References: Tokushima University - Tokushima/JP
Figure 13 shows the relationship between TE and normalized phase SNR in the phantom experiment. It is shown that the TE at maximum phase SNR values are close to the T2
*
of each sample. T2
*
values of each sample indicate closely at the peak of the curve between TE and phase SNR values.
Page 13 of 19 Fig. 14: Relationship between TE and SI
References: Tokushima University - Tokushima/JP
Figure 14 shows the relationship between TE and signal intensity (SI). Each plot SI and TE indicate a good fit with the data. With increase in echo number, SNR of iPhase showed a high value and good T2
*
curve fit. Our method requires accurate T2 *
curve fitting to use the T2* map. Then, we measured coefficient of determination. The coefficient of
determination was high in value and T2 *
Fig. 15: T2* map and iPhase image
References: Tokushima University - Tokushima/JP
Figure 15 shows each image derived from multi-echo 3D-SPGR of the phantom. Left, shows the T2
*
map (Fig.15a). Right, shows the iPhase image using phase data at optimized TE at each pixel (Fig.15b).
Page 15 of 19 References: Tokushima University - Tokushima/JP
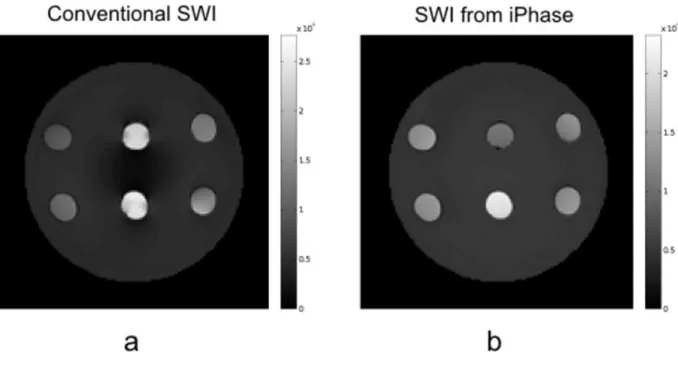
Figure 16 shows a comparison of two phantom images. The conventional SWI (Fig.16a), and the SWI derived from iPhase image in our method (Fig.16b). The conventional SWI is only able to emphasize the susceptibility in each pixel [3]; it is reconstructed after the phase images are high-pass-filtered and transformed to a phase mask that varies in amplitude between zero and one. This method differs vastly from our method in a great deal in physical concept of T2
*
decay. Here, to evaluate the improvement of phase SNR, we compared the SNR of SWI applied iPhase method and conventional SWI in a phantom experiment. The results showed that five of the six samples significantly were improved in each SNR, and one sample (at agar + Gd-DTPA 1.0%) was had a low-SNR (Fig. 12 and Fig 16).
Images for this section:
Fig. 13: Relationship between TE and normalized phase SNR © Tokushima University - Tokushima/JP
Fig. 14: Relationship between TE and SI © Tokushima University - Tokushima/JP
Page 17 of 19 Fig. 15: T2* map and iPhase image
© Tokushima University - Tokushima/JP
Fig. 16: Conventional SWI and iPhase method SWI © Tokushima University - Tokushima/JP
Conclusion
We developed the iPhase image method for correction for SNR using a T2 *
phase cycle of multi-echo SPGR data. The iPhase image was able to improve the image phase SNR. Moreover, our method makes it possible to obtain a phase image at a good SNR for an image affected by susceptibility, e.g., susceptibility weighted image (SWI).
Personal information
Author Names:
Natsuki Ikemitsu1, Yuki Kanazawa2, Yuki Matsumoto1, Hiroaki Hayashi2, Takatoshi Usuda1, Toshiaki Sasaki1, Mitsuharu Miyoshi3, and Masahumi Harada2
Author Affiliations:
1
School of Health Sciences, Tokushima University
2
Institute of Biomedical Sciences, Tokushima University Graduate School
3
MR Applications and Workflow Asia Pacific GE Healthcare Japan Corporation Corresponding Author and Reprint Info:
Yuki Kanazawa, PhD
Institute of Biomedical Sciences, Tokushima University Graduate School 3-18-15, Kuramoto-Cho, Toksuhima City, Tokushima, 770-8509, Japan E-mail: yk@tokushima-u.ac.jp
References
1. Bock J, Kreher BW, Hennig J, and Markl M. Optimized pre-processing of time-resolved 2D and 3D Phase Contrast MRI data. Proc. Intl. Soc. Mag. Reson. Med. 15 (2007). 2. Sood S, Urriola J, Reutens D, O'Brien K, Bollmann S, Barth M, Vegh V. Echo Time-Dependrnt Quantitative Susceptibility Mapping Contains Information on Tissue properties. Magn Reson Med. 2016 May 25.
Page 19 of 19 3. Haacke EM, Xu Y, Cheng YC, Reichenbach JR. Susceptibility Weighted Imaging (SWI). Magnetic Resonance in Medicine 52:612-618 (2004).
4. Wu B, Li W, Avram AV, Gho SM, Liu C. Fast and tissue-optimized mapping of magnetic susceptibility and T2* with multi-echo and multi-shot spirals. Neuroimage. 2012 Jan 2;59(1):297-305.