1
Authors:
1
Takaaki Isayama1,2, Sadamitsu Nishihara3 and Hideki Otsuka3
2 3 4
Title:
5
Proposal of a new method to prove that unnecessary information is not drawn on the
6
image using statistical analysis
7 8
Affiliations and Addresses of authors:
9
1): School of Health Sciences, Tokushima University, 3-18-15, Kuramoto-cho,
10
Tokushima 770-8503, JAPAN
11
2): Present Address: Graduate School of Health Sciences, Tokushima University,
12
3-18-15, Kuramoto-cho, Tokushima 770-8503, JAPAN
13
3): Tokushima University Graduate School of Biomedical Sciences, 3-18-15,
14
Kuramoto-cho, Tokushima 770-8503, JAPAN
15 16 17
e-mail address, telephone and fax numbers of the corresponding author:
18
Name: Sadamitsu Nishihara
19 E-mail: nishihra.sadamitsu@tokushima-u.ac.jp 20 Telephone: +81-88-633-9864 21 Facsimile: +81-88-633-9864 22 23 24 Abstract: 25
The purpose of this study is to propose a new method of image evaluation
26
using statistical analysis. We used the Sign test and the Wilcoxon test to analyze the
27
statistical significance of image differences. Using this method, we evaluated whether
28
the small electrode of the DAP meter appears in the X-ray image. Two observed values,
29
which were obtained by averaging all values under all exposure conditions, were
30
compared. All the observation tests showed the same sign. Thus, the results proved that
31
Main Document (Clean Copy)
This is a post-peer-review, pre-copyedit version of an article published in Radiological Physics and Technology. The final authenticated version is available online at: https://doi.org/10.1007/s12194-019-00503-z
2
the small electrode of the DAP meter is not present on the image. Using this method, it
32
became possible to prove that the electrode was not depicted, which was impossible to
33
determine using conventional methods. The method combining both the Sign test and
34
the Wilcoxon test can be useful in image evaluation.
35 36 37
Keywords:
38
dose area product (DAP) meter, observer test, Sign test, Wilcoxon test, significant
39
difference, small electrode
3
1 Introduction
41
The Sign test and Wilcoxon test are used to identify any statistically significant
42
differences in binomial distribution [1]. In the Sign test, + and/or - signs are given by
43
the magnitude of the value that is being examined. The P value is determined using the
44
smaller code numbers as follows (Equation 1):
45
nC nC nCr
n P 2 1 1 0+ +・・・+ (1) 46In Equation 1, the “n” represents the total code numbers to be compared, and “r”
47
indicates the smaller number. If the binomial probability (P) is >0.05, then the null
48
hypothesis cannot be denied. Thus, the presence or absence of a significant difference
49
cannot be determined.
50
The Wilcoxon test is also used to determine the statistical significance of any
51
differences, which are ranked according to the difference in the examined value. The +
52
and/or - codes are given by the differences. The ranksum (T) is obtained from the value
53
with the smaller code. The statistical significance of T is examined for the total code
54
numbers “n” and compared using the Wilcoxon test table (when “n” is smaller than 25).
55
If the ranksum T is >0.05, the null hypothesis cannot be ruled out and the difference is
56
not considered to be statistically significant. Both the Sign test and the Wilcoxon test
57
can prove that a there is a significant difference, but they cannot prove that there is no
58
significant difference. The null hypothesis cannot be denied because neither test can
4
distinguish whether there is no significant difference or whether the difference is not
60
significant because the number of samples is insufficient.
61
In Japan, the entrance skin dose is used to assess the radiation exposure of a
62
patient in the general imaging area. The diagnostic reference level (DRL) was published
63
by the Japan Network for Research and Information on Medical Exposure (J-RIME) in
64
2015; however, the DRL also reflects the entrance surface dose [2]. In Europe and the
65
United States, a dose area product (DAP) meter is used [3-8]. The DAP meters that are
66
currently commercially available can be mounted on the movable diaphragm of the
67
X-ray apparatus and a small electrode placed at the center can simultaneously estimate
68
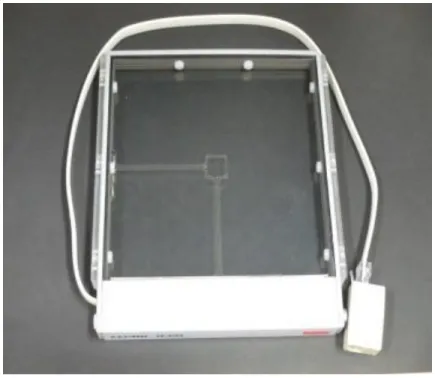
the air kerma. The DAP meter used in this study is shown in Figure 1. The small
69
electrodes can clearly be seen. Although there is a risk of influencing the diagnosis if
70
they are depicted on the photographed X-ray image, there have been no studies to show
71
that the electrodes are not drawn. Only the X-ray absorption of the DAP meter has been
72
discussed, without considering the existence of the small electrode itself [9]. The DAP
73
meter used for evaluation is compliant to IEC 60580. The requirements of 4.8.5.4 of
74
IEC 60580 2nd edition specifically describe concepts such as the X-ray transmittance of
75
a DAP chamber. This requirement indicates that the quality of equivalent filtration of
76
the ionization chamber shall not exceed 0.5 mm aluminum with a purity > 99 %. (The
77
X-radiation generates an X-ray tube voltage of 70 kV with a percentage ripple < 10 %
5
and a total filtration of 2 mm aluminum.)
79
When visually evaluating images, we use statistical analyses to investigate the
80
significance of differences. By allowing participants to observe images in which a DAP
81
meter was installed and images in which a DAP meter was not installed, the absence of
82
the small electrode on the image can be proven if it can be demonstrated that the
83
difference is not statistically significant. However, while it is possible to prove a
84
significant difference, no statistical methodology exists to prove that a difference is not
85
significant. It is advantageous to obtain results that show that it is unnecessary to
86
consider the influence of the small electrode on the X-ray image, as it is rejected. This
87
proof implies that the DAP meter can be used freely. We analyzed the results of
88
observer tests using two values (defined as the correct answer fraction, CAF) and
89
proved that the small electrodes of the DAP meter do not appear on X-ray images by
90
proving that there was a significant difference in the CAF. The two values were
91
obtained by averaging all findings under all exposure conditions.
92 93
2 Materials and Methods
94
2.1. Creating and displaying an observed data set
95
We set up the DAP meter (PD-9100; Toreck Co., LTD. Yokohama, Japan) on
96
the movable diaphragm of a general X-ray system (MRAD-A50S/70; Toshiba Medical
6
Systems, Nasu, Japan) and an image of the observed data set was photographed using
98
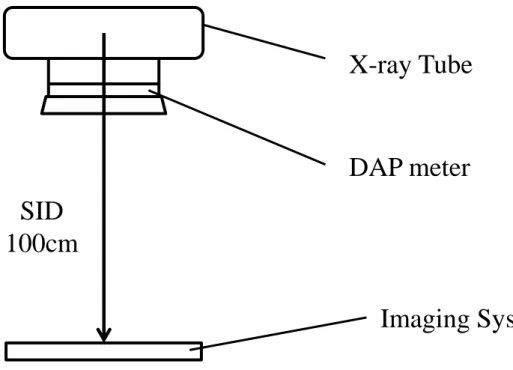
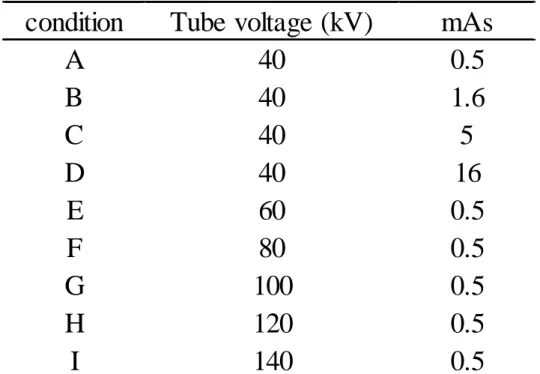
our X-ray system. Table 1 shows the exposure conditions and Figure 2 indicates the
99
geometric scheme for the observation image. The conditions in Table 1 (nine types of
100
exposure conditions) include the maximum and minimum conditions in the clinical
101
setting. Thus, if a significant difference were to be observed in this experiment, then it is
102
recognized that there was no influence of the presence of the electrode on the X-ray
103
image on usual examination. When the DAP meter was present, two images were
104
obtained; when no DAP meter was present, one image was obtained. Each image was
105
obtained under the same exposure condition with and without the DAP meter. A total of
106
27 observation image data sets were obtained.
107
The observation image was read with a CR system, REGIUS model 170
108
(Konica Minolta, Tokyo, Japan). By setting the reading to manual, the entrance X-ray
109
dose is expressed linearly as a pixel value. The ImageJ software program (NIH,
110
available at http://rsb.info.nih.gov/ij/) was used to ensure that all images had the same
111
pixel value on the observation monitor. First, the original pixel value was converted
112
exponentially. Second, the average value was adjusted to the average pixel value of
113
condition C by the Divide function. Finally, it was returned to the logarithmic display.
114
When we displayed our images, we set the window level to 100 and the window width
115
to 500.
7 117
2.2 Observer test
118
Fifteen participants observed the images randomly. A RadiForce R22 (EIZO
119
Co., Ltd. Hakusan, Japan) was used as an observation monitor. A black piece of paper
120
with a square cut out was affixed in the same position as the small electrode and could
121
be observed on the monitor. Before the experiment, we explained to the observer that
122
the targeted small electrode was 4 cm × 4 cm in size on the image. We did not consider
123
the stimulus-response matrix. Likewise, irrespective of whether stimulation was present
124
or not, the right side of one 5 cm line segment was taken as the maximum value.
125
One participant observed all 27 images {(two signal (+) images + one signal (-)
126
image) x 9 exposure conditions = 27 images}. If the observer felt that the small
127
electrode (signal) was present, he/she placed a mark on the right side of a 5-cm line
128
segment. If the electrode was not present, then the observer placed a mark on the left
129
side. The position marked by the observer was displayed in length from the left end. Of
130
the 27 observed values, the position corresponding to the far-right side of the line
131
segment was regarded as the maximum value (defined as 1) of the participant. All other
132
results were normalized with a maximum value of 1. Fifteen participants performed the
133
same task, and the average value for each image was calculated. These average values
134
are shown as observed values.
8 136
2.3. Statistical analysis
137
In our study, the Sign test and Wilcoxon test were used to determine the
138
significance of differences. Briefly, the differences between the Sign test and the
139
Wilcoxon test are as follows: The Sign test simply analyzed which result was significant,
140
and this test is based on a binomial distribution. Therefore, in the Sign test, only the
141
direction of the difference is taken into consideration. On the other hand, the Wilcoxon
142
test not only shows the number, but it also ranks and displays the magnitude of both
143
differences (difference). In the Wilcoxon test, the magnitude of the difference is also
144
taken into consideration in the order of ranking; thus, its detection power is high.
145
In the conventional method, the presence or absence of the DAP meter is
146
compared with the standardized value. In other words, each result was compared (show
147
as the observed value) regardless of the presence or absence of the DAP meter. In the
148
proposed method, two types of CAF are used. The CAF of the DAP meter (+) was the
149
same as that of the conventional method; the other CAF was calculated as follows: 1 –
150
{observed value of the DAP meter (-)}. If the other CAF was significantly higher than
151
the CAF of DAP meter (+), it proved that the small electrode was not depicted.
152 153
3 Results
9
3.1 Sign test
155
The exposure conditions are listed on the left side of Table 2 (A to I). The
156
results obtained by the conventional method are shown in the middle and the results
157
obtained by the proposed method on the right. In the middle of Table 2, the observed
158
value was used (for example, representative values for condition I were 0.205, 0.295).
159
We compared the observed values obtained when the DAP meter was included with
160
those obtained when the DAP meter was not included. The result was recognized as "+"
161
when the observed value of the images including the DAP meter was higher than that of
162
the images that did not include the DAP meter; while the value was recognized as "-"
163
when the value of the images including the DAP meter was smaller than the images that
164
did not include a DAP meter.
165
In the conventional method, the probability that "+" was three (and "-"
166
becomes 6 at the same time) was 0.254, and the probability was greater than the level of
167
significance (P=0.05). Thus, the null hypothesis could not be ruled out.
168
On the other hand, in the proposed method, when the images obtained with a
169
DAP meter were "+" the result was equivalent to the “observed value” and when the
170
images without a DAP meter were "-" the result was equivalent to the “1-observed
171
value”. That is, “1-0.295 = 0.705 (condition = I)”. As nine "+" signs were shown, the P
172
value was 0.002 based on equation 1 (the "-" sign is zero; r = 0). This probability was
10
<0.05. Thus, a significant difference was confirmed.
174 175
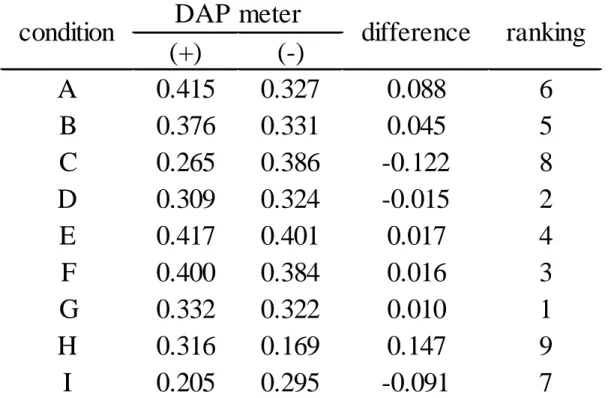
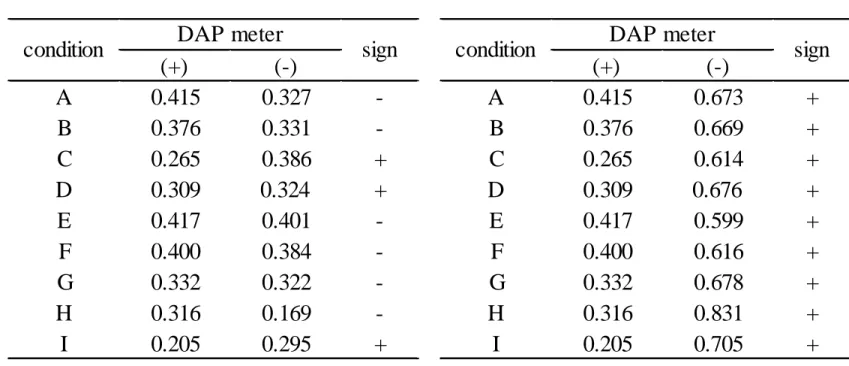
3.2 Wilcoxon test
176
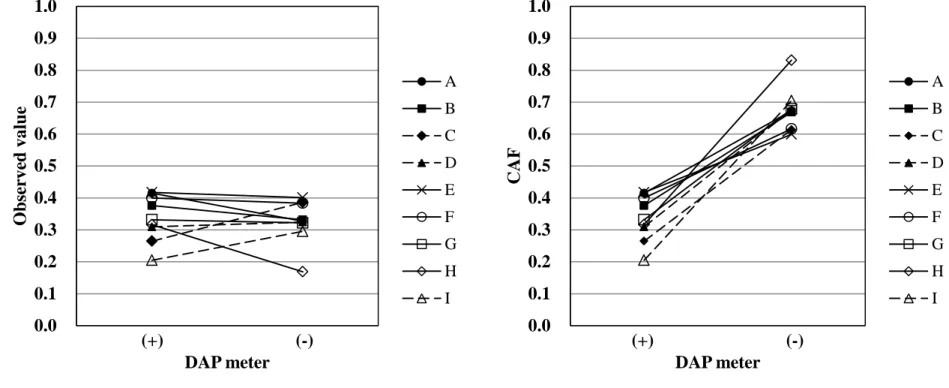
Figure 3 shows two graphs of the output values for each condition. The
177
magnitude of the difference for each ranking is shown in Table 3. There were nine
178
exposure conditions and the code number was nine. Using the Wilcoxon test table, when
179
the number of codes (n) to be compared is 9, the point at which T shows significance (P
180
= 0.05) is 5.
181
In the conventional method, when the exposure conditions were three (C, D
182
and I), the values of the images without the DAP meter became higher (Table 3). The
183
ranksum T at this time was 17. The result (T = 17) was ≥5 and did not reach 0.05. Thus,
184
it was not considered to be a significant difference.
185
In contrast, under the proposed method, the values of the images without the
186
DAP meter were high for all conditions (right side of Fig. 3). The ranksum at this time
187
was 0. This result (T = 5) is considered to reflect statistical significance at a significance
188
level of 0.05. Based on these statistically significant results, it can be stated that the
189
small electrode was not included in the image.
190 191
4 Discussion
11
The entrance surface dose is used to measure radiation exposure in general
193
imaging areas in Japan. The published DRL also refers to the entrance surface dose,
194
which is measured with an ionization chamber dosimeter. However, we believe that the
195
dose can be more accurately measured by a method that considers the size of the X-ray
196
radiation field, such as the method that is used in Europe and the United States.
197
Commercially available DAP meters not only measure the area dose but also
198
simultaneously estimate air kerma, which is useful for simply estimating the dose. It is
199
also possible to keep the dosimeter attached to the X-ray apparatus and to measure
200
exposure during actual imaging. Before DAP meters can be used in a clinical setting,
201
there are many problems that must be solved, including how to handle the value of the
202
area dose. In this study, as a first step, we investigated whether the small electrode of
203
the DAP meter was depicted in X-rays.
204
We used the Sign test and Wilcoxon test. The Sign test only evaluates the
205
number of signs. On the other hand, the Wilcoxon test includes both the sign and the
206
magnitude of the sensitivity difference. Using the conventional method, neither method
207
showed a significant difference. If we can prove that there is no significant difference,
208
then it could be stated that the DAP meter is not shown; however, it is not possible to
209
prove that there no significant difference using conventional statistical methods.
210
In the proposed method, two types of CAF were devised for the statistical
12
analysis to prove that there was a significant difference between them. As a result, both
212
observation tests showed the same sign. If the CAF of the image without the DAP meter
213
was significantly higher, then the observer did not recognize the DAP meter in the
214
image. That is, the analysis would prove that the small electrodes of the DAP meter
215
were not shown on the image. Thus, the method described in the present study made it
216
possible to prove that the leads were not depicted, which is impossible with
217
conventional methods. The proposed method proved that neither the Sign test nor the
218
Wilcoxon test showed the presence of the small electrode of the DAP meter in the
219 image. 220 221 5 Conclusion 222
In our study, the Sign test and Wilcoxon test were used to analyze the statistical
223
significance of differences. In the proposed method, two types of CAF are used, and
224
significant differences were recognized in both tests. The proposed method
225
demonstrated that the small electrodes of the DAP meter were not observed in the
226
image.
227 228
Compliance with ethical standards
229
Conflict of interest
13
All authors declare that they have no conflicts of interest.
231
Human and Animal Rights
232
All study procedures involving human participants were performed in accordance with
233
the 1964 Declaration of Helsinki. Furthermore, this study did not contain any animals.
234
Informed Consent
235
Our institutional review board approved the use of the image database and students of
236
the Tokushima University in this observation study (authorization number: 2797).
237
Informed consent for the study was obtained from all participants.
238 239
Acknowledgment
240
We are grateful to Mr. Yasushi Matsuda of TORECK CO., LTD. for improving the
241
manuscript and for their valuable discussions.
14
References
243
1) Ichikawa K. Statistics for Bioscience. Tokyo: Nankodo; 1991. p.42-45, p.50-53,
244
p.359. (In Japanese)
245
2) Diagnostic Reference Levels Based on Latest Survers in Japan – Japan DRLs 2015 –.
246
http://www.radher.jp/J-RIME/report/DRLhoukokusyoEng.pdf. Accessed 26 Jun
247
2018.
248
3) Karambatsakidou A, Tornvall P, Salh N, Chouliaras T, Löfberg PO, Fransson A.
249
Skin dose alarm levels in cardiac angiography procedures: is a single DAP value
250
sufficient? Br J Radiol. 2005; 78(933): 803-809.
251
4) Chida K, Saito H, Otani H, Kohzuki M, Takahashi S, Yamada S, Shirato K, Zuguchi
252
M. Relationship between fluoroscopic time, dose-Area Product, body weight, and
253
maximum radiation skin dose in cardiac interventional procedures. AJR Am J
254
Roentgenol. 2006; 186: 774-778.
255
5) Chida K, Kagaya Y, Saito H, Takai Y, Takahashi S, Yamada S, Kohzuki M, Zuguchi
256
M. Total entrance skin dose: An effective indicator of maximum radiation dose to the
257
skin during percutaneous coronary intervention. AJR Am J Roentgenol. 2007; 189:
258
224-227.
259
6) Chida K, Kaga Y, Haga Y, Kataoka N, Kumasaka E, Meguro T, Zuguchi M.
260
Occupational dose in interventional radiology procedures. AJR Am J Roentgenol.
261
2013; 200: 138-141.
262
7) Falco MD, Masala S, Stefanini M, Bagalà P, Morosetti D, Calabria E, Tonnetti A,
263
Verona-Rinati G. Effective-dose estimation in interventional radiological procedures.
264
Rad Phys & Tech. 2018; 11: 149-155.
265
8) Balter S. Methods for measuring fluoroscopic skin dose. Pediar Radiol. 2006; 36
266
(Suppl 2): 136-140.
267
9) IEC 60580 2nd Edition. Medical electrical equipment - Dose area product meters.
268
International Electrotechnical Commission; 2001.
269 270
15
Figure captions
271
Table 1: Exposure conditions
272
Table 2: Result of the Sign test. The exposure conditions are listed on the left (A to I).
273
The results obtained by the conventional method are shown in the left and the
274
results obtained by the proposed method are shown on the right.
275
Table 3: Magnitude of differences of each exposure condition. These signs of these
276
differences are the same as those shown in Table 2.
277
Figure 1: Dose area product (DAP) meter. The small electrode placed at the center can
278
simultaneously estimate the air kerma.
279
Figure 2: Geometry scheme for the observation image. Only the small electrode of the
280
DAP meter is included in the image; the subject is not included.
281
Figure 3: Wilcoxon test results. The results obtained by the conventional method and the
282
proposed method are shown on the left and right, respectively.
283
In the conventional method, the probability (observed value) of the DAP
284
meter (-) was higher than that of the DAP meter (+) under the conditions C, D,
285
and I.
286
Contrarily, in the proposed method, the CAF of DAP meter (-) was higher
287
than that of DAP meter (+) under all conditions. 288
Figure 1: The dose area product (DAP) meter. The small electrode placed at the center can
simultaneously estimate the air kerma.
Figure 2: Geometry scheme for the observation image. Only the
small electrode of the DAP meter is included in the image;
the subject is not included.
X-ray Tube
DAP meter
Imaging System
SID
100cm
Figure20.0 0.1 0.2 0.3 0.4 0.5 0.6 0.7 0.8 0.9 1.0 Ob se rve d value (+) (-) DAP meter A B C D E F G H I 0.0 0.1 0.2 0.3 0.4 0.5 0.6 0.7 0.8 0.9 1.0 CAF (+) (-) DAP meter A B C D E F G H I