Which Combination is the Best among Glycated Hemoglobin, Fasting Plasma Glucose, and 2-h Post-challenge Glucose for the Diagnosis of Prediabetes Type and Diabetes Type?
10
0
0
全文
(2) Kashima, et al. : Diagnosis of Prediabetes, Diabetes, and Normal Type diabetes, certain types of prediabetes and diabetes can be missed to undergo detection, for example, in cases where 2-h PG is not elevated but FPG is elevated due to hepatic insulin resistance. Ningen Dock usually involves the measurement of HbA1c, FPG, and 2-h PG on the same day; it does not aid in the diagnosis of clinical prediabetes and diabetes but can aid in the diagnosis of “prediabetes type” and “diabetes type” as well as “normal type.” Nevertheless, Ningen Dock is clinically meaningful because it can identify high-risk subjects and prescribe interventions to prevent new onset of diabetes and/or recognize subjects with overt diabetes who have not yet visited a hospital and remind them to do so at the earliest. Therefore, in this study, we investigated whether combinations of three measurements, namely, HbA1c, FPG, and 2-h PG, can be used simultaneously for an accurate diagnosis of “prediabetes type,” “diabetes type,” or “normal type.” In addition to the aforementioned points, the relative contribution and strength of the association between 2-h PG and HbA1c is only moderate and is much weaker than that between FPG and HbA1c 5 . To explore optimal use of these three measures, we aimed to identify the most suitable combination for the diagnosis of “prediabetes type,” “diabetes type,” and “normal type” from the possible combinations, namely, “HbA1c+FPG or HbA1c+2-h PG,” “HbA1c+ 2 -h PG,” “HbA1c+FPG,” “HbA1c alone,” “FPG+2-h PG,” “ 2-h PG alone,” and “FPG alone.” Furthermore, as HbA1c is known to be affected by age 6 , we analyzed the effect of age on these results.. Methods. The study protocol was reviewed and approved by the Kiryu Kosei General Hospital review board and conformed to the guidelines of the Declaration of Helsinki, 1964. Written informed consent was obtained from all participants. This clinical study included 3 , 681 subjects who underwent Ningen Dock at Kiryu Kosei General Hospital during 2016–2018. If a subject was repeatedly examined at Ningen Dock, then the most recent data were used for analysis. Subjects who had already been diagnosed with diabetes mellitus or who were taking diabetes medications were excluded from this study. Study subjects stayed in our hospital on day 1 and were requested to remain in a fasted state overnight (for 12 h). Blood samples were drawn at 8:00 the next morning and 2 h after oral administration of 75-g glucose as 75g OGTT on day 2. Venous blood samples were collected into tubes containing EDTA and fluoride; plasma was then separated from the cells within <1 h after sample collection, and plasma glucose concentration was determined by the hexokinase method using the Synchro. CX 4 /CX 5 glucose analyzer (Beckman Instruments, Fullerton, CA). Both intra- and inter-assay coefficients of variation were <2%, i.e., at <7 mmol/L. HbA1c was assessed using the HPLC method (Bio-Rad DIAMAT, Ivry-sur-Seine, France) in blood samples collected in EDTA-containing tubes. The normal range in this clinical study was set as 4.5% to 6.2%. Thus, all participants underwent the 75 g OGTT and HbA1c measurement, and cut-offs for FPG, 2-h PG, and HbA1c were determined based on guidelines provided by the Japan Diabetes Society. For FPG, <110 mg/dL was defined as “normal type,” 110≤ FPG <126 mg/dL as “prediabetes type,” and 126 mg/dL ≤ FPG as “diabetes type.” For 2-h PG, <140 mg/dL was defined as “normal type,” 140 mg/dL ≤2-h PG <200 mg/dL as “prediabetes type,” and 200 mg/dL ≤ as “diabetes type.” < HbA1c ≤6.2% as “normal type,” 6.2< HbA1c ≤6.5% as “prediabetes type,” and 6.5% < as “diabetes type.” The respective prevalence of “prediabetes type,” “diabetes type,” and “normal type” was estimated based on different combinations of three measures, namely, “HbA1c+FPG or HbA1c+2-h PG,” “HbA1c+2-h PG,” “HbA1c+FPG,” “HbA1c alone,” “FPG+2-h PG,” “ 2-h PG alone,” and “FPG alone.” Subjects were thus divided into three groups, namely, “normal type,” “prediabetes type,” and “diabetes type,” and further sub-divided into different age groups ( 40s, 50s, 60s, 70s, and 80s) to analyze the effect of age on the results. The number of subjects in each diagnostic group was determined using “the combination of HbA1c+FPG or HbA1c+2-h PG.” This number was defined as 100% because all measured factors (HbA1c, FPG, and 2-h PG) were involved in this combination and was considered the most reliable combination. We then estimated the efficiency and reliability of these different combinations for diagnosis by comparing the results obtained with each combination to those of the combination of “HbA1c+FPG or HbA1c+2-h PG” using statistical analysis. For this analysis, each group was not divided into various age groups (no subgroups). Mean values between groups were compared using one-way analysis of variance with post-hoc Tukey– Kramer comparisons to determine significant differences between mean values at p<0.05. The InStat 2.00 program was used for statistical analyses.. Results. The demographic characteristics of the 3,681 subjects in our cohort are as follows: male/female ratio of 2.3/1, age of 55 . 2±10 . 7 years (mean±standard deviation), body length (BL) of 165±8.9 cm, body weight (BW) 62 . 3±11. 8 kg, body-mass index (BMI) of 22 . 8±3 . 2 (kg/m 2 ), systolic blood pressure (SBP) of 120.1±15 mmHg, diastolic blood pressure (DBP) of 74 . 4±9.6. Ningen Dock International Vol.8 No.1 2021. 23 ( 23 ).
(3) Table 1. Subjects Background Characteristics Mean SD. Sex (M/F) 2.31. age 55.2 10.7. BL 165 8.9. BW 62.3 11.8. BMI 22.8 3.2. SBP 120.1 15. DBP 74.4 9.6. SCr 0.78 0.26. UA 5.6 1.3. HDL-C 64.3 16.8. LDL-C 128.9 29. TG 208.8 31.4. FPG 92.9 7.6. 2-h PG HbA1c 107.3 5.55 18.8 0.25. Summary demographic data of clinical study participants. M, male; F, female; age (years); BL, body length (cm); BMI, body-mass index (kg/m 2 ); SBP, systolic blood pressure (mmHg); DBP, diastolic blood pressure (mmHg); SCr, serum creatinine (mg/dL); UA, uric acid (mg/dL); HDL-C, high-density lipoprotein cholesterol (mg/dL); LDL-C, low-density lipoprotein cholesterol (mg/dL); TG, triglyceride (mg/dL); FPG, fasting plasma glucose (mg/dL); 2-h PG, 2-h post-challenge glucose level during 75g OGTT (mg/dL); HbA1c, glycated hemoglobin (%). Table 2. Subjects Background Characteristics by Age Sex (M/F). age. BL. BW. BMI. SBP. Mean SD. 2.76. 45.1 2.8. 168.6 8.3. 67.2 12.8. 23.6 3.6. 119 14.2. Mean SD. 0.29. 55.3 2.8. 166.9 7.9. 65.5 11.8. 23.4 3.3. 122.6 14.9. Mean SD. 2.9. 63.5 2.8. 164.4 7.9. 62.2 10. 22.9 2.8. 124.2 14.2. Mean SD. 0.68. 73.7 2.9. 158.6 9.1. 58.4 10.6. 23 2.8. 126.3 14.2. Mean SD. 1.4. 82.9 2.5. 155.2 8. 54 8.32. 22.3 2.47. 124.6 15. DBP SCr 40s 74.2 0.79 10 0.34 50s 77.1 0.77 10 0.18 60s 76.7 0.77 9 0.19 70s 75.4 0.75 8.8 0.2 80s 70.8 0.84 10.1 0.22. UA. HDL-C. LDL-C. TG. FPG. 2-h PG. HbA1c. 5.8 1.4. 62.5 17.1. 126.7 29.6. 125.3 88.9. 97.6 18.3. 109.2 22.1. 5.9 0.3. 5.8 1.3. 62.5 17.9. 126.1 30.5. 124 74.5. 102.1 21.5. 109.3 15.1. 5.9 0.3. 5.6 1.2. 62.5 16.4. 119 28.5. 116.5 76.7. 103.1 22.6. 129.1 37.2. 5.76 0.59. 5.4 1.2. 63.4 15.4. 118.1 25.4. 108.9 59. 101.4 20.4. 143.4 38.6. 5.86 0.51. 5.9 1.17. 64.2 16.1. 109.9 23. 100 74.2. 102.3 21.1. 130.1 47. 5.89 0.52. Summary of demographic characteristics by sub-group (age). M, male; F, female; age (years); BL, body length (cm); BMI, body-mass index (kg/m 2 ); SBP, systolic blood pressure (mmHg); DBP, diastolic blood pressure (mmHg): SCr, serum creatinine (mg/dL); UA, uric acid (mg/dL); HDL-C, high-density lipoprotein cholesterol (mg/dL); LDL-C, low-density lipoprotein cholesterol (mg/dL); TG, triglyceride (mg/dL); FPG, fasting plasma glucose (mg/dL); 2-h PG, 2-h post-challenge glucose level during 75g OGTT (mg/dL); HbA1c, glycated hemoglobin (%). Table 3. Diagnosis of “pre-diabetes type” Prediabetes type Year 40s. 50s. 60s. 70s. 80s. 2016 2017 2018 2016 2017 2018 2016 2017 2018 2016 2017 2018 2016 2017 2018 Mean SD. HbA1c+FPG or HbA1c+2-h PG 100 100 100 100 100 100 100 100 100 100 100 100 100 100 100 100. HbA1c+2-h PG. HbA1c+FPG. HbA1c alone. FPG+2-h PG. 86 80 100 77 50 79 85 92 84 89 100 100 100 80 100 86.8 13.41214801. 14 40 50 54 64 63 40 50 48 32 28 25 0 20 25 36.86666667 18.42307042. 0 0 0 0 7 5 0 12 20 21 7 25 0 20 25 9.466666667 10.04892792. 100 100 100 115 107 105 100 104 112 95 100 100 100 100 100 102.5333333 5.26262654. 2-h PG alone. FPG alone. 85 14 80 40 100 50 85 62 50 78 84 73 85 75 92 54 88 56 84 26 107 28 0 0 80 0 100 20 100 0 81.33333333 38.4 26.07315715 27.9943872. Diagnosis of “prediabetes type” was made based on seven combinations, as follows: “HbA1c+FPG or HbA1c+2-h PG,” “HbA1c+2-h PG,” “HbA1c+FPG,” “HbA1c alone,” “FPG+2-h PG,” “ 2-h PG alone,” and “FPG alone.” The number of “prediabetes type” patients estimated using the combination of “HbA1c+FPG or HbA1c+2-h PG” was defined as 100. The relative proportion represents the ratio of the actual measured number of subjects with the number derived when the combination of “HbA1c+FPG or HbA1c+2-h PG” for each year. Thus, values below 100 indicate the presence of false negatives, while values over 100 imply the inclusion of false positives. Each value was analyzed according to age. FPG, fasting plasma glucose (mg/dL); 2-h PG, 2-h post-challenge glucose level during 75g OGTT (mg/dL); HbA1c, glycated hemoglobin (%); HbA1c+FPG or HbA1c+2-h PG, the combination of HbA1c+FPG or HbA1c+2-h PG; HbA1c+2-h PG, the combination of HbA1c+2-h PG; HbA1c+FPG, the combination of HbA1c+FPG; FPG+2-h PG, the combination of FPG+2-h PG.. 24 ( 24 ). Ningen Dock International Vol.8 No.1 2021.
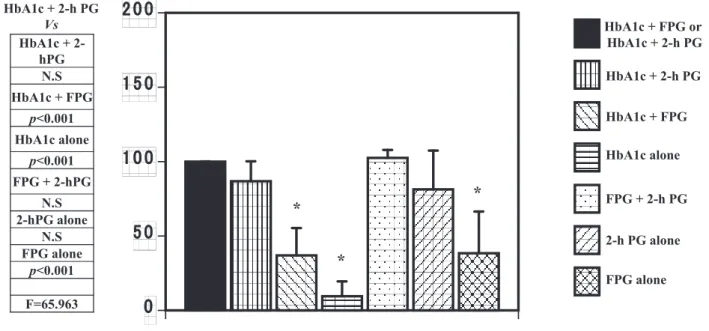
(4) Kashima, et al. : Diagnosis of Prediabetes, Diabetes, and Normal Type HbA1c + FPG or HbA1c + 2-h PG Vs HbA1c + 2hPG N.S HbA1c + FPG. 200. HbA1c + FPG or HbA1c + 2-h PG HbA1c + 2-h PG. 150. HbA1c + FPG. p<0.001 HbA1c alone p<0.001. HbA1c alone. 100. FPG + 2-hPG N.S 2-hPG alone N.S FPG alone p<0.001 F=65.963. *. *. 50. FPG + 2-h PG 2-h PG alone. *. FPG alone. 0. Fig. 1. Diagnosis of “prediabetes” Seven different combinations were used: “HbA1c+FPG or HbA1c+2-h PG,” “HbA1c+2-h PG,” “HbA1c+FPG,” “HbA1c alone,” “FPG+2-h PG,” “ 2-h PG alone,” and “FPG alone.” They were statistically compared using “the combination of HbA1c+FPG or HbA1c+2-h PG” as the standard. The results of the statistical analysis are presented in the left column. FPG, fasting plasma glucose (mg/dL); 2-h PG, 2-h post-challenge glucose level during 75g OGTT (mg/dL); HbA1c, glycated hemoglobin (%); HbA1c+FPG or HbA1c+2-h PG, the combination of HbA1c+FPG or HbA1c+2-h PG; HbA1c+2-h PG, the combination of HbA1c+2-h PG; HbA1c+FPG, the combination of HbA1c+FPG; FPG+2-h PG, the combination of FPG+2-h PG. *represents p<0.001. Table 4. Diagnosis of “diabetes type” Diabetes type Year 40s. 50s. 60s. 70s. 80s. 2016 2017 2018 2016 2017 2018 2016 2017 2018 2016 2017 2018 2016 2017 2018 Mean SD. HbA1c+FPG or HbA1c+2-h PG 100 100 100 100 100 100 100 100 100 100 100 100 100 100 100 100. HbA1c+2-h PG. HbA1c+FPG. HbA1c alone. FPG+2-h PG. 2-h PG alone. FPG alone. 100 100 100 100 100 100 40 83 87.5 100 100 100 100 100 100 94.03333333 15.83674149. 0 100 100 50 100 100 20 50 75 50 60 100 100 100 100 73.66666667 33.51261312. 0 100 100 50 100 100 20 16 50 50 40 50 100 100 100 65.06666667 36.59716356. 0 100 100 50 100 100 40 8 75 100 100 100 100 100 100 78.2 35.91696774. 0 100 100 50 100 100 20 66 62.5 50 80 100 100 100 100 75.23333333 32.90835037. 0 100 100 0 100 100 20 33 25 50 40 100 100 100 100 64.53333333 41.18402372. Diagnosis of “diabetes type” was made based on seven different combinations, as follows: “HbA1c+FPG or HbA1c+2-h PG,” “the combination of HbA1c+2-h PG,” “the combination of HbA1c and FPG,” “HbA1c alone,” “the combination of FPG+2-h PG,” “ 2-h PG alone,” and “FPG alone.” The number of patients diagnosed by the combination of “HbA1c+FPG or HbA1c+2-h PG” was 100. The relative proportion represents the ratio of the actual measured number and the number derived using “the combination of HbA1c+FPG or HbA1c+2-h PG” for each year. Thus, values below 100 indicate the presence of false negatives, while values over 100 imply the inclusion of false positives. Each value is represented by age. FPG, fasting plasma glucose (mg/dL); 2-h PG, 2-h post-challenge glucose level during 75g OGTT (mg/dL); HbA1c, glycated hemoglobin (%); HbA1c+FPG or HbA1c+2-h PG, the combination of HbA1c+FPG or HbA1c+2-h PG; HbA1c+2-h PG, the combination of HbA1c+2-h PG; HbA1c+FPG, the combination of HbA1c+FPG; FPG+2-h PG, the combination of FPG+2-h PG.. mmHg, serum creatinine (SCr) of 0.78±0.26 mg/dL, uric acid (UA) of 5.6±1.3 mg/dL, high-density lipoprotein cholesterol (HDL-C) of 64.3±16.8 mg/dL, lowdensity lipoprotein cholesterol (LDL-C) of 128.9±29. mg/dL, triglyceride (TG) of 208.8±31.4 mg/dL, FPG of 92.9±7.6 mg/dL, 2-h PG ( 2-h post-challenge glucose level during 75g OGTT) of 107.3±18.8 mg/dL, and HbA1c of 5.55±0.25%. The results of demographic. Ningen Dock International Vol.8 No.1 2021. 25 ( 25 ).
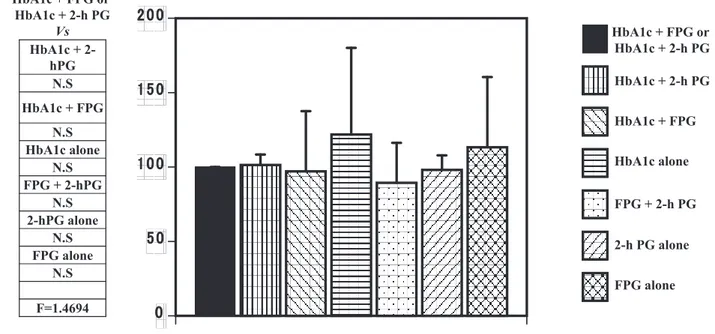
(5) HbA1c + FPG or HbA1c + 2-h PG Vs HbA1c + 2hPG N.S. 200. HbA1c + FPG or HbA1c + 2-h PG HbA1c + 2-h PG. 150. HbA1c + FPG N.S HbA1c alone p<0.05 FPG + 2-hPG N.S 2-hPG alone N.S FPG alone p<0.05 F=3.3954. *. 100. *. HbA1c + FPG HbA1c alone FPG + 2-h PG. 50. 2-h PG alone FPG alone. 0. Fig. 2. Diagnosis of “diabetes type” Seven different combinations were used, as follows: “the combination of HbA1c+FPG or HbA1c+2-h PG,” “HbA1c+2-h PG,” “HbA1c+FPG,” “HbA1c alone,” “the combination of FPG+2-h PG,” “ 2-h PG alone,” and “FPG alone.” They were statistically compared using “the combination of HbA1c+FPG or HbA1c+2-h PG” as the standard. The results of the statistical analysis are shown in the left column. FPG, fasting plasma glucose (mg/dL); 2-h PG, 2-h post-challenge glucose level during 75g OGTT (mg/dL); HbA1c, glycated hemoglobin (%); HbA1c+FPG or HbA1c+2-h PG, the combination of HbA1c+FPG or HbA1c+2-h PG; HbA1c+2-h PG, the combination of HbA1c+2-h PG; HbA1c+FPG, the combination of HbA1c+FPG; FPG+2-h PG, the combination of FPG+2-h PG. *represents p<0.05. HbA1c + FPG or HbA1c + 2-h PG Vs HbA1c + 2hPG N.S. 200. HbA1c + FPG or HbA1c + 2-h PG HbA1c + 2-h PG. 150. HbA1c + FPG N.S HbA1c alone N.S FPG + 2-hPG N.S 2-hPG alone N.S FPG alone N.S F=1.4694. HbA1c + FPG HbA1c alone. 100. FPG + 2-h PG. 50. 2-h PG alone FPG alone. 0. Fig. 3. Diagnosis of “normal type” Seven different combinations were used, as follows: “HbA1c+FPG or HbA1c+2-h PG,” “HbA1c+2-h PG,” “HbA1c+FPG,” “HbA1c alone,” “FPG+2-h PG,” “ 2-h PG alone,” and “FPG alone.” They were statistically compared by using “the combination of HbA1c+FPG or HbA1c+2-h PG” as standard. The results of the statistical analysis are shown in the left column. FPG, fasting plasma glucose (mg/dL); 2-h PG, 2-h post-challenge glucose level during 75g OGTT (mg/dL); HbA1c, glycated hemoglobin (%); HbA1c+FPG or HbA1c+2-h PG, the combination of HbA1c+FPG or HbA1c+2-h PG; HbA1c+2-h PG, the combination of HbA1c+2-h PG; HbA1c+FPG, the combination of HbA1c+FPG; FPG+2-h PG, the combination of FPG+2-h PG.. characteristics are summarized in Table 1. Of the 3,681 subjects, 624, 1,410, 1,177, 374, and 96 were in their 40s, 50s, 60s, 70s, and 80s, respectively, and these data are summarized in Table 2. Among 26 ( 26 ). the parameters tested, only hemoglobin (Hb) showed a tendency to reduce with an increase in age ( 14.7+1.7 g/dL in 40s to 13.5+1.2 g/dL in 80s), and all other parameters were comparable.. Ningen Dock International Vol.8 No.1 2021.
(6) Kashima, et al. : Diagnosis of Prediabetes, Diabetes, and Normal Type Table 5. Diagnosis of “normal type” Normal type Year 40s. 50s. 60s. 70s. 80s. 2016 2017 2018 2016 2017 2018 2016 2017 2018 2016 2017 2018 2016 2017 2018 Mean SD. HbA1c+FPG or HbA1c+2-h PG 100 100 100 100 100 100 100 100 100 100 100 100 100 100 100 100. HbA1c+2-h PG. HbA1c+FPG. HbA1c alone. FPG+2-h PG. 2-h PG alone. FPG alone. 95 103 100 95 112 107 92 107 108 89 100 113 100 100 100 101.4 7.018343313. 66 109 106 88 105 109 70 24 126 31 157 160 60 120 125 97.06666667 40.51537039. 62 114 111 76 122 130 53 228 141 15 176 186 60 180 175 121.9333333 58.19560885. 0 100 100 50 100 101 100 100 95 95 100 100 100 100 100 89.4 26.91418461. 95 103 100 95 115 108 92 100 91 79 80 113 100 100 100 98.06666667 9.821518326. 62 109 106 88 108 113 72 130 129 21 162 160 60 180 200 113.3333333 47.24498798. Diagnosis of “normal type” was made based on seven combinations, as follows: “HbA1c+FPG or HbA1c+2-h PG,” “HbA1c+2-h PG,” “HbA1c+FPG,” “HbA1c alone,” “the combination of FPG+2-h PG,” “ 2-h PG alone,” and “FPG alone” were tested. The number of patients diagnosed by the combination of “HbA1c+FPG or HbA1c+2-h PG” was 100. The relative proportion represents the ratio of the actual measured number and the number derived using “the combination of HbA1c+ FPG or HbA1c+2-h PG” for each year. Thus, values below 100 indicate the presence of false negatives, while values over 100 imply the inclusion of false positives. Each value is represented by age. FPG, fasting plasma glucose (mg/dL); 2-h PG, 2-h post-challenge glucose level during 75g OGTT (mg/dL); HbA1c, glycated hemoglobin (%); HbA1c+FPG or HbA1c+2-h PG, the combination of HbA1c+FPG or HbA1c+2-h PG; HbA1c+2-h PG, the combination of HbA1c+2-h PG; HbA1c+FPG, the combination of HbA1c+FPG; FPG+2-h PG, the combination of FPG+2-h PG.. For diagnosing “prediabetes type,” combinations of “HbA1c+2-h PG,” “FPG+2-h PG,” and “ 2-h PG alone” were found to be almost as reliable as “HbA1c+FPG or HbA1c+2-h PG” (Table 3 and Fig. 1 ), and the differences in mean and SD values were not significantly different (Table 3 and Fig. 1 ). However, the combination of “HbA1c+FPG,” “HbA1c alone,” or “FPG alone” was not reliable in diagnosing the “prediabetes type” as the measured values were significantly smaller than those for “HbA1c+FPG or HbA1c+2-h PG” (Table 3 and Fig. 1 ). For diagnosing “diabetes type,” combinations of “ HbA 1 c+ 2 -h PG ” or “ HbA 1 c+FPG ” or “ FPG+ 2 h PG” or “ 2 -h PG alone” were almost as reliable as “HbA1c+FPG or HbA1c+2-h PG” (Table 4 and Fig. 2 ), while combinations of “HbA1c alone,” or “FPG alone” were not suitable as the measured values were significantly smaller than those for “HbA1c+FPG or HbA1c+2-h PG” (Table 4 and Fig. 2 ). As shown in Fig. 3, excessive variation in the measured values for “normal type” precluded statistical comparison, suggesting that none of the six combinations are reliable (F=1.4694 ). Therefore, the “normal type” can only be reliably diagnosed using the combination of “HbA1c+FPG or HbA1c+2-h PG.” The effect of age on these results is shown in Tables 6 and 7 and Fig. 4, 5, and 6. We found similar patterns in the results among the various age groups with regard to diagnosing “prediabetes type,” “diabetes type,” and. “normal type.”. Discussion. Prediabetes is defined as levels of FPG, 2-h PG, or HbA1c greater than their consensus-derived normal ranges but below diagnostic thresholds for diabetes, and emphasis has been placed on intervening in those with prediabetes because early intervention can potentially prevent new onset of not only diabetes 3 but also atherosclerosis 4 . While prediabetes is a risk factor for type 2 diabetes mellitus (T2DM), given its high prevalence, affecting 35% of US adults 3 , interventions for everyone with prediabetes may not be cost-effective 7 . Furthermore, longitudinal observational studies have shown that ~40% of those who progressed to T2DM over a five-year period had normal glucose tolerance (NGT) at baseline, suggesting that “prediabetes” status may not adequately identify a portion of individuals at risk for diabetes 8 and that reliance on these established “prediabetes type” and “normal type” criteria may only detect such patients at a time point that is “later-than-optimal” for lifestyle intervention, that is, earlier intervention would have been more effective. Therefore, we tried to identify a reliable set of indices to accurately distinguish among “prediabetes type,” “diabetes type,” and “normal type” populations using seven different combinations of HbA 1 c, FPG, and 2-h PG, namely, “HbA1c+FPG or HbA1c+2-h PG,” “HbA1c+ 2 -h PG,” “HbA1c+FPG,” “HbA1c alone,”. Ningen Dock International Vol.8 No.1 2021. 27 ( 27 ).
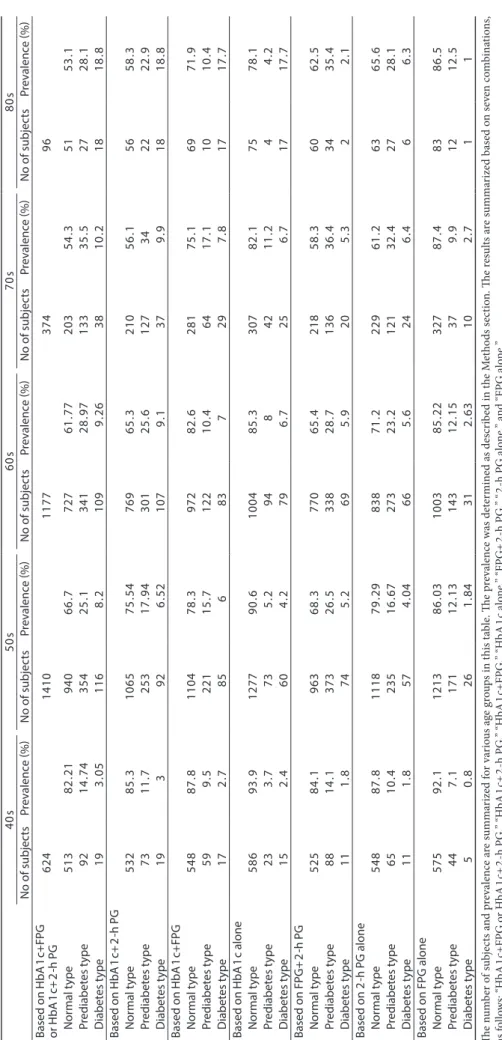
(7) 28 ( 28 ). Ningen Dock International Vol.8 No.1 2021. 50s No of subjects Prevalence (%). 60s No of subjects Prevalence (%). 70s No of subjects Prevalence (%). 80s No of subjects Prevalence (%). Based on HbA1c+FPG 624 1410 1177 374 96 or HbA1c+2-h PG Normal type 513 82.21 940 66.7 727 61.77 203 54.3 51 53.1 Prediabetes type 92 14.74 354 25.1 341 28.97 133 35.5 27 28.1 Diabetes type 19 3.05 116 8.2 109 9.26 38 10.2 18 18.8 Based on HbA1c+2-h PG Normal type 532 85.3 1065 75.54 769 65.3 210 56.1 56 58.3 Prediabetes type 73 11.7 253 17.94 301 25.6 127 34 22 22.9 Diabetes type 19 3 92 6.52 107 9.1 37 9.9 18 18.8 Based on HbA1c+FPG Normal type 548 87.8 1104 78.3 972 82.6 281 75.1 69 71.9 Prediabetes type 59 9.5 221 15.7 122 10.4 64 17.1 10 10.4 Diabetes type 17 2.7 85 6 83 7 29 7.8 17 17.7 Based on HbA1c alone Normal type 586 93.9 1277 90.6 1004 85.3 307 82.1 75 78.1 Prediabetes type 23 3.7 73 5.2 94 8 42 11.2 4 4.2 Diabetes type 15 2.4 60 4.2 79 6.7 25 6.7 17 17.7 Based on FPG+2-h PG Normal type 525 84.1 963 68.3 770 65.4 218 58.3 60 62.5 Prediabetes type 88 14.1 373 26.5 338 28.7 136 36.4 34 35.4 Diabetes type 11 1.8 74 5.2 69 5.9 20 5.3 2 2.1 Based on 2-h PG alone Normal type 548 87.8 1118 79.29 838 71.2 229 61.2 63 65.6 Prediabetes type 65 10.4 235 16.67 273 23.2 121 32.4 27 28.1 Diabetes type 11 1.8 57 4.04 66 5.6 24 6.4 6 6.3 Based on FPG alone Normal type 575 92.1 1213 86.03 1003 85.22 327 87.4 83 86.5 Prediabetes type 44 7.1 171 12.13 143 12.15 37 9.9 12 12.5 Diabetes type 5 0.8 26 1.84 31 2.63 10 2.7 1 1 The number of subjects and prevalence are summarized for various age groups in this table. The prevalence was determined as described in the Methods section. The results are summarized based on seven combinations, as follows: “HbA1c+FPG or HbA1c+2-h PG,” “HbA1c+2-h PG,” “HbA1c+FPG,” “HbA1c alone,” “FPG+2-h PG,” “ 2-h PG alone,” and “FPG alone.” FPG, fasting plasma glucose (mg/dL); 2-h PG, 2-h post-challenge glucose level during 75g OGTT (mg/dL); HbA1c, glycated hemoglobin (%). 40s No of subjects Prevalence (%). Table 6. Prevalence of “prediabetes type,” “diabetes type,” and “normal type”.
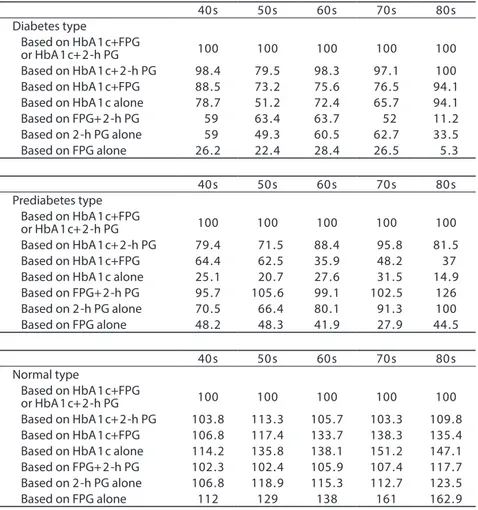
(8) Kashima, et al. : Diagnosis of Prediabetes, Diabetes, and Normal Type Table 7. Prevalence of “prediabetes type,” “diabetes type,” and “normal type” 40s. 50s. 60s. 70s. 80s. 100. 100. 100. 100. 100. 98.4 88.5 78.7 59 59 26.2. 79.5 73.2 51.2 63.4 49.3 22.4. 98.3 75.6 72.4 63.7 60.5 28.4. 97.1 76.5 65.7 52 62.7 26.5. 100 94.1 94.1 11.2 33.5 5.3. 40s. 50s. 60s. 70s. 80s. 100. 100. 100. 100. 100. 79.4 64.4 25.1 95.7 70.5 48.2. 71.5 62.5 20.7 105.6 66.4 48.3. 88.4 35.9 27.6 99.1 80.1 41.9. 95.8 48.2 31.5 102.5 91.3 27.9. 81.5 37 14.9 126 100 44.5. 40s. 50s. 60s. 70s. 80s. 100. 100. 100. 100. 100. 103.8 106.8 114.2 102.3 106.8 112. 113.3 117.4 135.8 102.4 118.9 129. 105.7 133.7 138.1 105.9 115.3 138. 103.3 138.3 151.2 107.4 112.7 161. 109.8 135.4 147.1 117.7 123.5 162.9. Diabetes type Based on HbA1c+FPG or HbA1c+2-h PG Based on HbA1c+2-h PG Based on HbA1c+FPG Based on HbA1c alone Based on FPG+2-h PG Based on 2-h PG alone Based on FPG alone. Prediabetes type Based on HbA1c+FPG or HbA1c+2-h PG Based on HbA1c+2-h PG Based on HbA1c+FPG Based on HbA1c alone Based on FPG+2-h PG Based on 2-h PG alone Based on FPG alone. Normal type Based on HbA1c+FPG or HbA1c+2-h PG Based on HbA1c+2-h PG Based on HbA1c+FPG Based on HbA1c alone Based on FPG+2-h PG Based on 2-h PG alone Based on FPG alone. Prevalence of “prediabetes type” (A.U.). The prevalence of “prediabetes type,” “diabetes type,” and “normal type” is summarized for various age groups in this table. The results are summarized based on seven combinations: “HbA 1 c+FPG or HbA1c+2-h PG,” “HbA1c+2-h PG,” “HbA1c+FPG,” “HbA1c alone,” “FPG+2-h PG,” “ 2-h PG alone,” and “FPG alone.” The prevalence was determined as described in the Methods section. FPG, fasting plasma glucose (mg/dL); 2-h PG, 2-h post-challenge glucose level during 75g OGTT (mg/ dL); HbA1c, glycated hemoglobin (%). 200. HbA1c & FPG or HbA1c & 2-h PG HbA1c & 2-h PG. 150. HbA1c & FPG HbA1c alone. 100. FPG & 2-h PG. 50. 2-h PG alone FPG alone. 0. 40s. 50s. 60s. 70s. 80s. Fig. 4. Prevalence of “prediabetes type” The prevalence of “prediabetes type” is represented by a bar graph. The prevalence was shown for various age groups. FPG, fasting plasma glucose (mg/dL); 2 -h PG, 2 -h post-challenge glucose level during 75 g OGTT (mg/dL); HbA 1 c, glycated hemoglobin (%). Ningen Dock International Vol.8 No.1 2021. 29 ( 29 ).
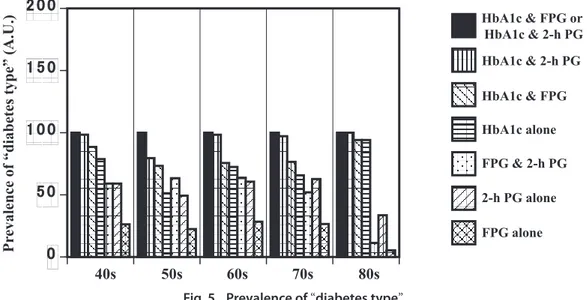
(9) Prevalence of “diabetes type” (A.U.). 200. HbA1c & FPG or HbA1c & 2-h PG HbA1c & 2-h PG. 150. HbA1c & FPG HbA1c alone. 100. FPG & 2-h PG. 50. 2-h PG alone FPG alone. 0 40s. 50s. 60s. 70s. 80s. Fig. 5. Prevalence of “diabetes type” The prevalence of “diabetes type” is represented by a bar graph. The prevalence was shown for various age groups. FPG, fasting plasma glucose (mg/dL); 2 -h PG, 2 -h post-challenge glucose level during 75 g OGTT (mg/dL); HbA 1 c, glycated hemoglobin (%). Prevalence of “normal type” (A.U.). 200. HbA1c & FPG or HbA1c & 2-h PG HbA1c & 2-h PG. 150. HbA1c & FPG HbA1c alone. 100. FPG & 2-h PG. 50. 2-h PG alone FPG alone. 0 40s. 50s. 60s. 70s. 80s. Fig. 6. Prevalence of “normal type” The prevalence of “normal type” is represented by a bar graph. The prevalence was shown for various age groups. FPG, fasting plasma glucose (mg/dL); 2 -h PG, 2 -h post-challenge glucose level during 75 g OGTT (mg/dL); HbA 1 c, glycated hemoglobin (%). “FPG+2-h PG,” “ 2-h PG alone,” and “FPG alone.” The combination of “HbA1c+FPG or HbA1c+2-h PG” is. the most reliable criterion because it includes HbA1c, which helps minimize the effects of day-to-day variation in FPG and 2-h PG values. Therefore, we used this to determine the prevalence of “prediabetes type” and “diabetes type” and “normal type” and designated this as 100%. Next, the incidence of diabetes type “prediabetes type” and “diabetes type” and “normal type,” calculated using the other combinations, was represented as the ratio relative to “HbA1c+FPG or HbA1c+2-h PG.” Ratios below 100 implied the presence of false negatives, while those above 100 indicated the inclusion of false positives. 30 ( 30 ). Our results show that, for diagnosing “prediabetes type,” the combinations of “HbA1c+2-h PG” when fit to prediabetes cut-offs, “FPG+2-h PG,” and “ 2-h PG alone” were statistically reliable compared to the combination of “HbA1c+FPG or HbA1c+2-h PG.” The other combinations evaluated, namely, “HbA1c+FPG,” “HbA1c alone,” and “FPG alone” were not reliable, even though they are currently being used for the diagnosis of clinical diabetes 2,3 . Although the combination “FPG+2-h PG” appeared reliable for diagnosing “prediabetes type,” its results are subject to day-to-day variation because it does not include HbA1c. In addition, as shown in Table 3, “FPG+2-h PG” contains false positives especially in 50s to 70s. Therefore, while. Ningen Dock International Vol.8 No.1 2021.
(10) Kashima, et al. : Diagnosis of Prediabetes, Diabetes, and Normal Type measurement of “FPG+ 2 -h PG” seem to be recommended for the diagnosis of “prediabetes type,” adding HbA1c values to this combination will minimize the effects of day-to-day variation and false positives, implying that an accurate diagnosis of “prediabetes type” requires not only the measurement of HbA1c but also of 75g OGTT. Unfortunately, our results did not support screening by FPG alone, although previous studies have described the usefulness of FPG in this context 4 . Next, for diagnosing the “diabetes type,” we found that the combinations of “HbA1c and 2-h PG” when both were fit to diabetes criteria, “HbA1c+FPG,” and “FPG+2-h PG” and “ 2-h PG alone” were statistically comparable to the combination of “HbA1c+FPG or HbA1c+2-h PG” in terms of reliability. The other combinations, such as “HbA1c alone” and “FPG alone,” were not reliable despite their current use in the diagnosis of clinical diabetes 2,3 . However, careful examination of the data revealed a large standard deviation in all six combinations tested, suggesting great variability. Thus, diagnosis of “diabetes type” would require HbA1c, FPG, and 2-h PG values. For diagnosing “normal type,” none of the combinations were suitable compared to “HbA1c+FPG or HbA1c+2-h PG.” Thus, for the diagnosis of “normal type,” it is better to measure all three parameters, that is, HbA1c, FPG, and 2-h PG. Taken together, we show that an accurate diagnosis of “prediabetes type,” “diabetes type,” and “normal type,” requires the measurement of HbA1c, along with the 75g OGTT to evaluate FPG and 2-h PG. Importantly, this inference concurs with that of other recent reports, which state that this combination possesses the advantages of sensitivity and reproducibility 9 and that FPG, 2-h PG, and HbA1c cannot be used individually as stand-alone tests for diagnosing “prediabetes,” “diabetes type,” or “normal type 9 .” Notwithstanding the aforementioned information, this clinical study has a few limitations that warrant discussion. First, as our sample size was small (n=3,681 ), the generalizability of our results is restricted, and therefore, these should be verified in a larger cohort. Second, this study has a selection bias with respect to ethnicity, age, sex, weight, and other similar factors, and studies that include a wider range of demographics are needed.. the review board in accordance with the principles of the Declaration of Helsinki. Written informed consent was obtained from the participants before the publication of this manuscript and any accompanying images. A copy of the written consent is available for review by the Editor-in-Chief of this journal.. Consent for publication. Written informed consent was obtained from the people in each case for the publication of this manuscript and any accompanying images. A copy of the written consent is available for review by the Editor-inChief of this journal.. Conflict of interest. The authors declare that there are no conflicts of interest that could be perceived as prejudicing the impartiality of the research reported. This research did not receive any specific grant from funding agencies in the public, commercial, or not-for-profit sectors.. References. 1.. 2. 3. 4.. 5.. 6.. 7. 8.. 9.. Conclusion. For accurate diagnosis of “prediabetes” and “diabetes type” and “normal type,” a combination of HbA1c measurement and 75g OGTT appear adequate.. Rahbar S, Blumenfeld O, Ranney HM: Studies of an unusual hemoglobin in patients with diabetes mellitus. Biochem Biophys Res Commun 1969; 36: 838–843. The International Expert Committee: International Expert Committee report on the role of the A 1 C assay in the diagnosis of diabetes. Diabetes Care 2009; 32: 1327–1334. Centers for Disease Control and Prevention: National diabetes statistics report, 2017. Ando T, Okada S, Niijima Y, et al.: Impaired glucose tolerance, but not impaired fasting glucose, is a risk factor for early-stage atherosclerosis. Diabet Med 2010; 27: 1430– 1435. Ketema EB, Kibret KT: Correlation of fasting and postprandial plasma glucose with HbA 1 c in assessing glycemic control; systematic review and meta-analysis. Arch Public Health 2015; 73: 43. Davidson MB, Schriger DL: Effect of age and race/ethnicity on HbA1c levels in people without known diabetes mellitus: implications for the diagnosis of diabetes. Diabetes Res Clin Pract 2010; 87: 415–421. Kahn R, Davidson MB: The reality of type 2 diabetes prevention. Diabetes Care 2014; 37: 943–949. Unwin N, Shaw J, Zimmet P, et al.: Impaired glucose tolerance and impaired fasting glycaemia: the current status on definition and intervention. Diabet Med 2002; 19: 708– 723. Jagannathan R, Neves JS, Dorcely B, et al.: The oral glucose tolerance test: 100 years later. Diabetes Metab Syndr Obes 2020; 13: 3787–3805. (Received August 9, 2020 ; Accepted January 7, 2021). Declarations. Ethics approval and consent to participate The study protocol was reviewed and approved by Ningen Dock International Vol.8 No.1 2021. 31 ( 31 ).
(11)
図

+3
関連したドキュメント
Furuta, Two extensions of Ky Fan generalization and Mond-Pecaric matrix version generalization of Kantorovich inequality, preprint.
(In the sequel we shall restrict attention to homology groups arising from normalising partial isometries, this being appropriate for algebras with a regular maximal
In particular, we consider the following four subgroups: the intersection of all tidy subgroups for H on G (in the case that H is flat); the intersection of all H -invariant
Inside this class, we identify a new subclass of Liouvillian integrable systems, under suitable conditions such Liouvillian integrable systems can have at most one limit cycle, and
Possibly new results derived from these formulas are a limit from Koornwinder to Macdonald polynomials, an explicit formula for Koornwinder polynomials in two variables, and
In this paper, we …rst present a new de…nition of convex interval–valued functions which is called as interval–valued harmonically h–convex functions. Then, we establish some
2 To introduce the natural and adapted bases in tangent and cotangent spaces of the subspaces H 1 and H 2 of H it is convenient to use the matrix representation of
In Section 6 we derive expressions for the intersection parameters of the coherent configuration R(q) on the non-tangent lines L of the conic O; so in particular we obtain
