Surface Soil in a Swidden and Subsequent
Fallow in a Northwestern Region of Malaita
Island, Solomon Islands
著者
NAKANO Kazutaka, MIYAUCHI Nobufumi
journal or
publication title
南太平洋研究=South Pacific Study
volume
17
number
1
page range
1-20
Changes in Physical and Chemical Properties of Surface
Soil in a Swidden and Subsequent Fallow in a
Northwestern Region of Malaita Island,
Solomon Islands
*Kazutaka N
AKANO**and Nobufumi M
IYAUCHI***Abstract
Changes in the physical and chemical properties of the surface layers of soil of a slash-and-burn swidden
(garden) in a tropical and ever-humid climate region in northwest Malaita Island, Solomon Islands, were
investi-gated. Soil samples were obtained from the same site nearly spanning the entire swidden cycle and from an almost adjacent long fallow forest. The fallow period in the swidden cycle was slightly more than ten years. The soil there was found to be acidic. The changes in physical properties suggest that slight soil compaction of the surface layers occurred during the fallow, and that the soil became softer, and more permeable with increasing fallow length. The changes in the content of organic carbon seem to parallel this change. Both organic carbon and total nitrogen in the topsoil had the lowest value in the middle of the fallow period. The surface layers accumulated much organic matter during the long fallow period. The levels of available phosphorus, exchangeable calcium, magnesium, potassium, and sodium, base saturation percentage and pH of the topsoil were lowest during the fallow period. On the other hand, effective cation exchange capacity was high in the middle of the fallow period owing to a high value of exchange acidity. Exchangeable calcium was noticeably abundant in both the topsoil and the 15 20cm soil layer in the long fallow forest. After burning the plant debris, no rise of pH value measured in de-ionized water was recognized.
From the preceding results, it can be concluded that some properties of the topsoil in fallows far less than ten years after garden abandonment are less favorable for swiddening even when the beneficial effects of heating and adding ash are taken into account. Furthermore, the present investigation suggests that the ecological characteris-tics of swiddening in an ever-humid region are substantially different from those in a region with humid and distinctly dry seasons.
Key words: Soil properties, Swidden cycle, Malaita Island(Solomon Islands).
*
This study was partially funded by Fukutake Science and Culture Foundation in Japan. The receipt of this grant-in-aid 1988 is gratefully acknowledged.
**
鹿児島大学南太平洋海域研究センター 中野和敬
Kagoshima University Research Center for the South Pacific, 1-21-24, Korimoto, Kagoshima, JAPAN 890.
***
鹿児島大学農学部生物環境学科生産制御化学講座土壌科学研究室 宮内信文
Laboratory of Soil Science, Chair of Agronomical and Food Chemistry, Department of Environmental Sciences and Technology, Faculty of Agriculture, Kagoshima University, 1-21-24, Korimoto, Kagoshima, JAPAN 890.
Introduction
Determining the changes in soil properties of an actual swidden and its subsequent fallow during a swidden cycle has some aspects of great significance for relevant fields of science and technology. The two main aspects are as follows. Determining these changes is a basic step for understanding mineral cycling in the whole ecosystem of a swidden and the subse-quent fallow; understanding these changes can indicate the factors responsible for the changes in the fertility and other growing conditions for the crops during the respective stages of the cycle(namely, clearing a forest, burning the debris of felled or slashed plants,
growing crops, abandoning the swidden, and fallowing till the next cycle). For the latter
purpose, quantitatively detailed data of the properties of surface soils should be emphasized, since most roots of the majority of the herbaceous crops in the region where this investiga-tion was pursued do not penetrate very deeply into the soil, and the growth of those crops is considered to be related mainly to the fertility and the physical conditions of the shallow soil layers directly in contact with their roots.
So far, a considerable, though not satisfactory, amount of quantitative data concerning the properties of the soils in swiddens and the subsequent fallows all over the world has been accumulated. However, such data covering one entire cycle are not numerous. For the Asian and the Pacific regions, those have been obtained only from East Malaysia(ANDRIESSE, 1977), Northern Thailand (SABHASRI, 1978; ZINKE et al., 1978; NAKANO, 1978), and
North-Eastern India(RAMAKRISHNAN, 1992). Many investigations which provide data on
changes in soil properties in a swidden are based on the analyses of soil samples from various stages of the swidden cycle(from forest selection to abandonment or a few years
of the fallows).
Most of these studies have a serious defect: that is, the comparisons of the results of analyses are not made from identical sampling sites at various stages. According to ANDRIESSE (1977, p. 10), "the natural variability in soil properties within one field, or
between fields of one soil series is a serious limitation in studying the effect of one or more external factors upon such properties". In order to surmount this problem, NAKANO (1978) adopted a measure of combining data on quantitative changes of the
chemical components of soil obtained over a year or so in some sites. Despite improvement, this measure does not provide a highly satisfactory model of change in soil properties during a swidden cycle.
STR MGAARD (1992) studied, over nine years since the stage shortly before burning
piled slash, changes in soil properties of a swidden and the subsequent fallow stages in Miombo woodlands in Zambia. The samples for analyses from any Plot for his investigation were obtained from an identical site. Even if the data of his Plots A and B at the stage before burning the plant debris are considered to indicate the soil properties at the final stage of the preceding swidden cycle with a long fallow period, however, his investigation did not cover the entire swidden cycle, because his last sampling at either Plot A or B was conducted at the several years fallow stage which is the early phase in the whole fallow
period there.
This paper presents quantitative data, by means of physical and chemical analyses of the samples from the same site, on the change in the properties of surface soil in an actual swidden or garden and the subsequent fallow in a northwestern region of Malaita Island, Solomon Islands. Samples represent a nearly complete swidden cycle. Quantitative data on vegetational change of the site during the fallow have been already published(NAKANO, 1992). Thus, this paper should be regarded as one of a pair of papers which describe and
discuss the dynamic relationship between vegetation and soil of a complete swidden cycle
(garden and fallow) in an ever-humid island of Melanesia.
We are deeply indebted to the staff of Soil Section(represented formerly by Mr. Rodney
J. CHEATLE and successively, till 1994, Mr. Morgan WAIRIU) at Dodo Creek Research
Station, the Ministry of Agriculture and Fisheries of Solomon Islands, for providing the first author of this paper with the opportunity for pursuing the field surveys to complete the present paper. We owe much to the inhabitants of the Aitea Hamlet for their willingness and cooperative hospitality.
Survey Procedure
The location of the survey site for the present investigation near Aitea Hamlet has been shown in the previous paper(NAKANO, 1992). According to the FAO-UNESCO system of
soil taxonomy, the soils in the region where this site is situated are Haplic Phaeozems
(Anonymous, 1978), although some data shown below do not appear to satisfy fully the
revised condition necessary for this soil group(Anonymous, 1988). Furthermore, this site
is also in one of the regions characterized by Tamba’a Land System(WALLand HANSELL, 1974).
As mentioned in the previous paper(NAKANO, 1992), this site has a typical ever-humid
tropical climate; and usual monthly precipitation there is more than 100mm. Table 1 shows that this region had only nine months with less than 100mm of precipitation during the 74 months from January 1989 until February 1995. Table 1 also shows that none of those nine months appear twice or more. This means that this region has no definite, distinctly recog-nized dry season. Moreover, it should be also noted that all the region’s inhabitants agree that Aitea Hamlet has, on account of its higher altitude, much more precipitation than coastal Auki where the meteorological data shown in Table 1 were obtained.
The soil samples were collected from a site previously designated as "Old Garden 1" and "Sanctuary Forest"(NAKANO, 1992). A soil profile was sampled by horizons and is
pre-sented in Table 2. In addition, surface soils at the two depth layers(0 5cm and 15 20cm)
were sampled five times in the "Old Garden 1", namely, at these stages: 1) after clearing
the vegetation of slightly more than ten years fallow; 2) one week after burning the debris
Ipomoea batatas (L.) LAM.) garden; 4) two years and a half fallow; and, 5) five years
fallow. It was impossible to separate the ash components from the top soil sampled one week after burning. Each sampling occasion is shown in Tables 3 and 4. With respect to Table 1, the sampling site had no very dry period during at least one month before each sampling occasion. When the last sampling was conducted in March 1995, the owner of the "Old Garden 1" told the first author that the fallow vegetation would be cleared again for gardening in two years. This means that, in the swidden cycle since 1989, the fallow period of the "Old Garden 1" was to be seven years, which is several years less than the previous cycle. Taking these processes into account, the sampling occasions in the "Old Garden 1" cover nearly an entire swidden cycle, although the present investigation cannot be referred to as a monitoring study. In addition to the "Old Garden 1", surface soil in the "Sanctuary Forest" was sampled in November, 1990, shortly after the vegetational survey reported in the previous paper(NAKANO, 1992).
The land which includes both the "Old Garden 1" and the "Sanctuary Forest" consists of a ridge extending roughly in a north south direction and having an east facing side slope. The maximal angle of inclination is approximately 15 degrees. As mentioned previously(N AKANO, 1992), the "Sanctuary Forest" lies on an inconspicuous almost flat peak. The areas
of the "Old Garden 1" and the "Sanctuary Forest" were slightly more than 0.1ha and less than 0.03ha respectively. The distance between respective centers of the two is somewhat more than 50m. Precisely speaking, the boundaries of the two are not adjacent to each other, but are interrupted by another swidden and its subsequent fallow. This intervening site, too, was gardened successively after planting sweet potatoes in the "Old Garden 1". The samples Table 1. Months(from January 1989 to February 1995), when the actual precipitaion was
less than 100mm at the meteorological station in Auki, Malaita Island, Solomon Islands.
Note 1 : The year 1989 had no months when the precipitation was less than 100mm. Note 2 : Auki is located 10km to the south-south-west of the survey site.
Data source : Solomon Islands Meteorological Service.
Year Month Precipitation(mm)
1990 February 98.0 1991 April 60.4 1992 1992 May June 60.0 29.0 1993 1993 January October 96.6 73.3 1994 1994 1994 September Novemer December 27.4 89.6 53.6
from the "Sanctuary Forest" were obtained only from the plot(0.01ha) for the vegetational
survey(NAKANO, 1992).
A soil profile was dug in a remnant fallow forest of the "Old Garden 1" shortly before clearing it. This fallow forest was the stage slightly more than ten years in age. The hard-ness at each horizon of soil profile was measured using a Yamanaka Type hardhard-ness meter and was determined by averaging the more than five values actually measured there when the sample pit was dug. The soil samples for the bulk density analysis were obtained from each horizon using three 100ml metallic cylindrical soil samplers. Samples for the analyses of particle size distribution and chemical analyses were collected using a stainless steel knife at the corresponding depths.
In both the "Old Garden 1" and the "Sanctuary Forest", most samples for physical and chemical analyses of the two surface layers were obtained using the preceding cylindrical samplers. With regard to a few bulk density samples from the 15 20cm depth layer, how-ever, suitable sizes of rectangular parallelopipedons of soil were, at stony spots, manually cut out with a stainless steel knife. The sampling spots were always determined randomly. At respective sampling occasions, the samples were usually collected from ten spots in the "Old Garden 1" or the "Sanctuary Forest". Except for the samples from the five years fallow, in most cases, one sample for physical analyses and two for chemical analyses were taken at one depth at each spot. At the first two sampling occasions shortly before and after burning the plant debris, however, the samples for measuring water permeability were not collected, because no plan to collect data on this physical property had been arranged during the initial phase of the present investigation. The samples for physical analyses were sealed and kept separately until analyses in Japan. All of the samples for chemical analyses ob-tained from one depth of ten spots were thoroughly mixed, air-dried locally and sent to Japan to be analyzed.
With reference to the five years fallow stage, the samples were collected from four or five points distributed in a square less than 1,000cm2
area. The samples for physical analyses from one or two points and the samples for chemical analyses from three or four points were taken at one depth at each sampling spot. Those for physical analyses were treated similarly as stated above. On the other hand, those for chemical analyses from three or four points at one depth of each spot were thoroughly mixed. The respective mixed and air-dried ones from two depth layers from each of the ten spots were kept separate. That is, these twenty batches in total were sent to Japan for chemical analyses.
Soil Analyses
1) Physical analyses
Except for bulk density and water permeability, analyses were made on air-dried soil samples sieved through a 2mm mesh. Particle size distribution of the samples was
determined using the procedure described in NAKANO and Syahbuddin (1989). Water
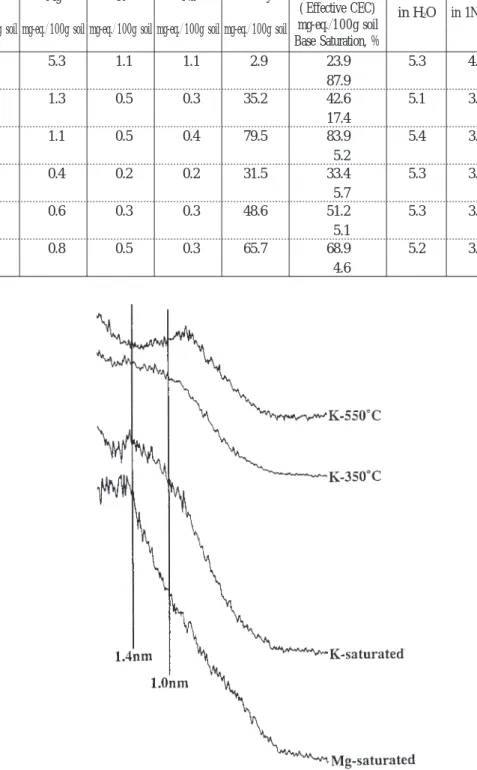
permeability was measured using a DIK-4000 apparatus manufactured by Daiki Rika Kogyo Co. Ltd., Japan. Mineralogical analysis of the clay fraction by x-ray diffraction was conducted as follows: After a small amount of soil sample was treated with hydrogen peroxide to oxidize the organic matter in it, it was suspended in de-ionized water, and only the clay fraction with less than 2μ diameter was collected. One half of this clay fraction
was Mg-saturated, and the other half was K-saturated. The Mg- or K-saturated material was dropped on a glass slide, dried, and x-rayed by means of a RAD-rB type apparatus manu-factured by Rigaku-denki Co. Ltd., Japan, using CuKα.
2) Chemical analyses
Besides the preceding analysis for particle size distribution, chemical analyses were partly conducted in cooperation with the technical staff of Palynosurvey Co. Ltd. in Japan. All analyses were carried out on air-dried soil samples sieved through a 2mm mesh. pH was measured by glass electrode and using a suspension of 10 g soil in 25 ml of de-ionized water or 1N KCl solution. Organic carbon was measured by ALLISON’s (1960) method.
Total nitrogen was estimated by a semi-micro KJELDAHLtechnique using K2SO4and CuS
O4 as catalysts. "Available" phosphorus was measured by the TRUOG and the BRAY II
methods according to, respectively, ALLENet al.(1974) and Commission for Determining
the methods of Plant-nutrient Analyses of Soil (1970). Exchangeable cations were
ex-tracted from soil samples with 1N ammonium acetate at pH 7.0 and analyzed using atomic absorption spectroscopy for calcium and magnesium, and flame photometry for potassium and sodium. Exchange acidity was determined by the titration of 0.02N NaOH solution to the extract from 10g soil with 25 ml of 1N KCl solution for five days. With respect to cation exchange capacity(CEC), LANDON(1984, p.128) remarks that "in acid soils the exchange
capacity equals the sum of the exchangeable bases plus the exchange acidity". Thus, this suggestion is followed and the above-stated values are designated here as "effective cation exchange capacity".
Results and Discussion
1) Soil profile
The description of the soil profile in the remnant fallow forest in the "Old Garden 1" is as follows:
Horizon Depth(cm) Description
A1 0 10(on the average) Brownish black (5YR2 1, moist) friable heavy
clay, fine angular blocky structure with abundant roots of various sizes, mixed with small and angular stones and gravel(3% in areal ratio), gradual and
noticeably wavy boundary to the following deeper horizon.
A3 10 13(on the average) Brownish black (5YR3 1, moist) friable heavy
clay, fine angular blocky structure with small amount of roots of various sizes, mixed with small and angular stones and gravel(5% in areal ratio),
gradual and noticeably wavy boundary to the fol-lowing deeper horizon.
B1 13 18(on the average) Bright brown (7.5YR5 6, moist) friable heavy
clay, moderately fine angular blocky structure with very small amount of fine roots, mixed with angular stones (5% in areal ratio), gradual and noticeably
wavy boundary to the following deeper horizon.
B21 18 60 Reddish brown (5YR4 8, moist) friable heavy
clay, medium-sized angular blocky structure with fine roots scarcely found (down to 50cm depth),
mixed with angular stones(7 10% in areal ratio),
clear and smooth boundary to the following deeper horizon.
B22 60 70 Dull reddish brown(5YR4 3, moist) friable heavy
clay, medium-sized angular blocky structure with
no roots, mixed with angular stones
(7 10% in areal ratio), clear and smooth boundary
to the following deeper horizon.
B23 70 85 Brown(7.5YR4 6, moist) friable heavy clay,
me-dium-sized angular blocky structure with no roots, mixed with angular stones(10 20% in areal ratio),
gradual and wavy boundary to the following deeper horizon.
B24 85 100 & 105 Red (10R4 8, moist) friable heavy clay, medium
sized angular blocky structure with no roots, mixed with angular stones (nearly 20% in areal ratio)
gradual and wavy boundary to the following deeper horizon.
B3 100 & 105 Bright reddish brown(5YR5 8, moist), mixed with
angular stones and white gravel(40 50% in areal
ratio).
Most stones in the upper horizons were found to be tuff-breccia. The result of hardness measurement at the respective horizons was as follows: A1, 8.5mm; A3, 15.7mm; B1,
17.2mm; B21, 18.0mm; B22, 19.1mm; B23, 18.4mm; B24, 18.2mm; B3, 18.0mm. These values
indicate that the roots have little difficulty in penetrating down to 50cm depth.
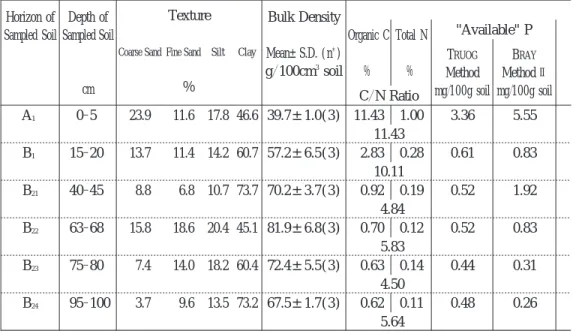
Table 2 shows the data of soil texture, bulk density, and the results of chemical analyses of the soil samples from the respective horizons except for very thin A3. The data of soil
texture precisely confirm the observed texture in the preceding profile description. Fundamentally, the soil in the survey site is acidic at every horizon. The difference of the pH values(between those measured in de-ionized water and 1N KCl solution) is
consider-able. By the latter method, pH values of the B horizon show noticeably high acidity. The contents of both organic carbon and total nitrogen indicate richness in organic matter in the top layer. The decrease in C N ratio between 20cm and 40cm depths is marked. Base saturation percentage in the top layer is very high mainly owing to the high content of exchangeable calcium. The corresponding values of exchangeable calcium in the B horizon are rather low although the values of effective cation exchange capacity are high because of noticeably high values of exchange acidity. Exchangeable potassium is higher in the B24horizon than in the B22and B23. This fact may reflect the great mobility of potassium
with leaching(ANDRIESSEand SCHELHAAS, 1987b; STR MGAARD, 1992). If so, the higher
content of exchangeable potassium at the bottom layer of soil can be concluded to be a consequence of its accumulation owing to the leaching process during the fallow period. The data in Table 2 seem to support this inference. As has been mentioned above, given the base saturation data in Table 2, this soil does not appear to fulfill the requirements for Phaeozems as indicated by the revised legend of FAO-UNESCO system of soil taxonomy
(Anonymous, 1988).
Fig. 1 displays a result of x-ray diffraction analysis on the composition of clay minerals in a sample from the B horizon of the profile. This and other figures strongly suggest that the soil contains no 1 : 1 type mineral, such as kaolinite and halloysite. More complex clays are indicated by the mixture of vermiculite- and illite-structured clay minerals including Table 2. Some properties of the soil sampled from a profile at a fallow near Aitea
*Number of samples. Horizon of Sampled Soil Depth of Sampled Soil cm
Texture Bulk Density
Mean±S.D. (n*) g 100cm3 soil Organic C % Total N % "Available" P TRUOG Method mg 100g soil BRAY MethodⅡ mg 100g soil Coarse Sand Fine Sand Silt Clay
% C N Ratio A1 0 5 23.9 11.6 17.8 46.6 39.7±1.0(3) 11.43 1.00 3.36 5.55 11.43 B1 15 20 13.7 11.4 14.2 60.7 57.2±6.5(3) 2.83 0.28 0.61 0.83 10.11 B21 40 45 8.8 6.8 10.7 73.7 70.2±3.7(3) 0.92 0.19 0.52 1.92 4.84 B22 63 68 15.8 18.6 20.4 45.1 81.9±6.8(3) 0.70 0.12 0.52 0.83 5.83 B23 75 80 7.4 14.0 18.2 60.4 72.4±5.5(3) 0.63 0.14 0.44 0.31 4.50 B24 95 100 3.7 9.6 13.5 73.2 67.5±1.7(3) 0.62 0.11 0.48 0.26 5.64
Hamlet, northwestern Malaita Island, Solomon Islands.
Content of Exchangeable Main
Cations+ Exchange Acidity ( Effective CEC) mg-eq. 1 0 0 g soil Base Saturation,% pH Exchangeable Exchange Acidity in H2O in 1N KCl Ca Mg K Na
mg-eq. 100g soil mg-eq. 100g soil mg-eq. 100g soil mg-eq. 100g soil mg-eq. 100g soil
13.5 5.3 1.1 1.1 2.9 23.9 87.9 5.3 4.4 5.3 1.3 0.5 0.3 35.2 42.6 17.4 5.1 3.8 2.4 1.1 0.5 0.4 79.5 83.9 5.2 5.4 3.7 1.1 0.4 0.2 0.2 31.5 33.4 5.7 5.3 3.9 1.4 0.6 0.3 0.3 48.6 51.2 5.1 5.3 3.8 1.6 0.8 0.5 0.3 65.7 68.9 4.6 5.2 3.7
Al-vermiculite which shows properties different from those of typical vermiculite. Furthermore, smectite is not readily found in this figure. These conclusions support the above-referred passage in Booker Tropical Soil Manual(LANDON, 1984) concerning CEC,
and are compatible with the high values of exchange acidity(Table 2).
2) Change in Soil Properties during the Swidden Cycle
Tables 3 and 4 show the detailed data of the changes in some physical and chemical properties of 0 5cm and 15 20cm soil layers, respectively, in the swidden and subsequent fallow for the swidden cycle and the corresponding data of the "Sanctuary Forest". Both the means and standard deviations are presented for physical properties. On the other hand, the standard deviations for chemical analysis data at most stages cannot be calculated, because all the samples for chemical analyses (except for those at the stage of five years fallow)
were thoroughly mixed. Nevertheless, a rough approximation of the standard deviations is possible if the standard deviations of the five years fallow are applied to those of the other stages. In the following discussion, the data of samples collected shortly before burning the felled or slashed and dried plants are considered to be equivalent to those at slightly more Table 3. Change in some physical and chemical properties of the soil(0 5cm depth)
properties of the soil(0 5cm depth) of a sanctuary forest beside the swidden
Stage
Physical Properties Content of
Bulk Density Mean±S.D.(n* ) g 100cm3 soil (g soil m2 ) log10Permeability Mean±S.D.(n* ) log10(ml cm2 sec.)
Organic C Total N "Available" P Mean±S.D.(n*) % (g m2 ) Mean±S.D.(n*) % (g m2 )
TRUOGMethod BRAYMethodⅡ Ca Mean±S.D.(n* ) mg 100g soil (g m2 ) Mean±S.D.(n* ) mg 100g soil (g m2 ) Mean±S.D.(n* ) mg-eq. 100g soil (g-eq. m2 ) C N Ratio 1 week after burning 41.9±5.4(4) (20,950) no data 7.44±n.a.**(10) (1,560) 0.70±n.a.**(10) (147) 2.58±n.a.**(10) (0.54) 3.45±n.a.**(10) (0.72) 14.2±n.a.**(10) (2.97) 10.57 8 months fallow 44.6±5.9(5) (22,300) 0.83±0.52(3) 6.93±n.a.** (10) (1,550) 0.63±n.a.** (10) (140) 1.31±n.a.** (10) (0.29) 0.87±n.a.** (10) (0.19) 5.1±n.a.** (10) (1.14) 11.00 2½ years fallow 44.8±3.4(6) (22,400) 1.03±0.49(5) 7.20±n.a.**(10) (1,610) 0.67±n.a.**(10) (150) 1.05±n.a.**(10) (0.24) 1.62±n.a.**(10) (0.36) 5.6±n.a.**(10) (1.25) 10.75 5 years fallow 45.0±7.6(6) (22,500) 1.64±0.24(5) 4.58±0.90 (10) (1,030) 0.49±0.090 (10) (110) 0.95±0.28 (10) (0.21) 1.34±0.80 (10) (0.30) 3.0±2.00 (10) (0.68) 9.34±0.87 (10) Slightly more than 10 years fallow*** 40.6±3.1(6) (20,300) no data 6.34±n.a.**(10) (1,280) 0.66±n.a.**(10) (134) 1.79±n.a.**(10) (0.36) 2.27±n.a.**(10) (0.46) 11.5±n.a.**(10) (2.33) 9.54 Long fallow ("Sanctuary Forest") 34.3±5.3(5) (17,150) 0.86±0.64(5) 10.56±n.a.** (10) (1,810) 1.00±n.a.** (10) (171) 3.19±n.a.** (10) (0.55) 1.66±n.a.** (10) (0.28) 24.2±n.a.** (10) (4.15) 10.56
* Number of sampling spots. **Not available.
than ten years fallow stage, even though the samples were taken after clearing the fallow vegetation. Some changes in soil properties during, at the majority of sampling spots, one or more months between the clearing and burning times cannot be completely ruled out as the values of a few components in the profile sample(Table 2) are noticeably higher than
the corresponding ones in Table 3. At any rate, however, it ought to be remembered that the data in Table 2 are based on the samples from only one spot.
a. Physical properties, organic carbon, and total nitrogen
None of the differences in bulk density values are statistically significant at 5% level (two-sided) using the STUDENT’s t-tests (TAKEUCHI, 1963). At 10% level, however, the
topsoil bulk density value is significantly lower in the slightly more than ten years fallow in comparison with the two years and a half fallow, and will be further lowered as the fallow period is increased. This coincides with the conclusion from AWETO’s(1981b) data
from southwestern Nigeria. As for the 15 20cm layer, the standard deviation at the stage of one week after burning plant debris is so high that the mean value is somewhat unreliable. Nevertheless, at 10% level, the bulk density which shows an increase up to the stage of five
years fallow seems to be lowered when the fallow period becomes very long. The results of water permeability, expressed in log10values, seem to parallel those of bulk density. At
in a swidden and the subsequent fallow during a swidden cycle and the corresponding near Aitea Hamlet, northwestern Malaita Island, Solomon Islands.
Exchange Acidity Exchangeable Main Cations+Exchange Acidity (Effective CEC) Mean±S.D.(n* ) mg-eq. 100g soil (g-eq. m2 ) Base Saturation,% pH Exchangeable in H2O in 1N KCl Sampling Time Mg K Na Mean±S.D.(n* ) mg-eq. 100g soil (g-eq. m2 ) Mean±S.D.(n* ) mg-eq. 100g soil (g-eq. m2 ) Mean±S.D.(n* ) mg-eq. 100g soil (g-eq. m2 ) Mean±S.D.(n* ) mg-eq. 100g soil (g-eq. m2 ) Mean±S.D.(n* ) Mean±S.D.(n* ) Month, Year 5.6±n.a.**(10) (1.17) 1.5±n.a.**(10) (0.31) 0.6±n.a.**(10) (0.13) 1.7±n.a.**(10) (0.36) 23.6±n.a.**(10) (4.94) 92.8
5.6±n.a.**(10) 4.8±n.a.**(10) May, 1989
2.0±n.a.** (10) (0.45) 0.2±n.a.** (10) (0.04) 0.2±n.a.** (10) (0.04) 4.8±n.a.** (10) (1.07) 12.3±n.a.** (10) (2.74) 61.0 4.6±n.a.** (10) 3.9±n.a.** (10) December, 1990 2.9±n.a.**(10) (0.65) 0.3±n.a.**(10) (0.07) 0.3±n.a.**(10) (0.07) 1.9±n.a.**(10) (0.65) 12.0±n.a.**(10) (2.69) 75.8
5.1±n.a.**(10) 4.2±n.a.**(10) August, 1992
1.44±0.53 (10) (0.32) 0.18±0.04 (10) (0.04) 0.26±0.05 (10) (0.06) 19.1±6.8 (10) (4.30) 24.1±6.3 (10) (5.42) 22.3±15.2 (10) 4.5±0.13 (10) 4.1±0.07 (10) March, 1995 4.1±n.a.**(10) (0.83) 0.5±n.a.**(10) (0.12) 0.7±n.a.**(10) (0.14) 2.0±n.a.**(10) (0.41) 18.9±n.a.**(10) (3.84) 89.4
5.6±n.a.**(10) 4.4±n.a.**(10) May, 1989
4.1±n.a.** (10) (0.70) 0.5±n.a.** (10) (0.09) 0.9±n.a.** (10) (0.15) 1.7±n.a.** (10) (0.29) 31.4±n.a.** (10) (5.39) 94.6 5.8±n.a.** (10) 5.3±n.a.** (10) November, 1990
10% level, the permeability of the topsoil at the five years fallow stage has significantly
decreased from the two years and a half fallow. On the other hand, it is markedly higher in the "Sanctuary Forest". The results of physical properties suggest that slight soil compaction at the surface layer occurred during the course of fallow, and that the soil became softer and more permeable as the fallow period became longer than ten years. The data of organic carbon content may support this inference. In both the topsoil and the deeper layers, the respective contents of organic carbon at the five years fallow stage have the lowest
(signifi-cant at 0.1% level) values during the swidden cycle, while those at the "Sanctuary Forest"
are respectively much higher. AWETO’s(1981b) results, which were based on the samples
from different sites (AWETO, 1981a), should be noted here. His results showed a slight
decline in topsoil organic matter during the first three years following the cessation of cultivation and its recovery after the early fallow stage.
The effects of burning on the organic or total carbon of topsoil have been presented by many authors. In the paper based on the soil samples collected in Northern Thailand, N
AKANO(1978) reported that carbon content in the topsoil following a distinct dry season
was slightly lowered after burning, although the difference was not significant. R Table 4. Change in some physical and chemical properties of the soil(15 20cm
depth)prop-erties of the soil(15 20cm depth) of a sanctuary forest beside the swidden
Stage
Physical Properties Content of
Bulk Density Mean±S.D.(n* ) g 100cm3 soil (g soil m2 ) log10Permeability Mean±S.D.(n* ) log10(ml cm2 sec.)
Organic C Total N "Available" P Mean±S.D.(n*) % (g m2 ) Mean±S.D.(n*) % (g m2 )
TRUOGMethod BRAYMethodⅡ Ca Mean±S.D.(n* ) mg 100g soil (g m2 ) Mean±S.D.(n* ) mg 100g soil (g m2 ) Mean±S.D.(n* ) mg-eq. 100g soil (g-eq. m2 ) C N Ratio 1 week after burning 71.5±25.1(4) (35,750) no data 2.26±n.a.**(10) (810) 0.27±n.a.**(10) (97) 0.70±n.a.**(10) (0.25) 1.05±n.a.**(10) (0.38) 4.8±n.a.**(10) (1.72) 8.37 8 months fallow 52.7± 9.1(5) (26,350) 1.20±0.62(3) 1.93±n.a.** (10) (510) 0.22±n.a.** (10) (58) 0.48±n.a.** (10) (0.13) 0.09±n.a.** (10) (0.02) 1.5±n.a.** (10) (0.40) 8.77 2½ years fallow 59.4± 5.5(5) (29,700) 2.11±1.35(5) 2.03±n.a.**(10) (600) 0.22±n.a.**(10) (65) 0.31±n.a.**(10) (0.09) 0.57±n.a.**(10) (0.17) 1.2±n.a.**(10) (0.36) 9.23 5 years fallow 65.1± 6.3(6) (32,550) 2.49±0.58(5) 1.45±0.24 (10) (470) 0.20±0.030 (10) (65) 0.50±0.32 (10) (0.16) 0.57±0.26 (10) (0.19) 1.05±0.40 (10) (0.34) 7.20±0.92 (10) Slightly more than 10 years fallow**** 63.7± 8.7(6) (31,850) no data 2.20±n.a.**(10) (700) 0.27±n.a.**(10) (86) 0.66±n.a.**(10) (0.21) 0.44±n.a.**(10) (0.14) 5.3±n.a.**(10) (1.69) 8.15 Long fallow ("Sanctuary Forest") 53.0± 9.2(5) (26,500) 0.62±0.14(4) 3.69±n.a.** (10) (980) 0.39±n.a.** (10) (103) 12.15±n.a.** (10) (3.22) 4.46±n.a.** (10) (1.18) 19.6±n.a.** (10) (5.19) 9.46
* Number of sampling spots. ** Not available.
***One sample with a suspect value of exchange acidity, 150.4mg-eq. 100g soil, is excluded. If included, the means and the ****The spots where soil sampling was conducted had already been cleared but not burned.
AMAKRISHNANand TOKY (1981) reported similar results for North-Eastern India. On the
other hand, SEUBERTet al.(1977) found an increase in organic carbon in the low jungle
of Peruvian Amazon where there was no pronounced dry season. In Table 3 of this paper, the content of organic carbon increased significantly, if the standard deviation at the five years fallow stage is applied to all the other stages, at 5% level after burning the plant
debris. We agree with STR MGAARD’s(1992, p. 23) view that "... the concentration and
burning of woody matter resulted in the addition of considerable amounts of partly burned and unburned biomass to the surface soil." The quantity of such additions may be larger for ever-humid regions like this one. In contrast to regions where the thoroughly dried plant debris is easily burned towards the end of a distinct dry season, burning wettish or, some-times, thoroughly wet organic matter in the ever-humid Malaita Island is laborious. Furthermore, in this case, the temperature at the topsoil does not rise very much during burning. ANDRIESSEand SCHELHAAS(1987b) have a similar conclusion.
Total nitrogen in the topsoil is the lowest (significant at 1% level) in the five years
fallow stage. In the 15 20cm layer, however, the differences between the five years and eight months or two years and a half fallow stages are not found to be significant. In in a swidden and the subsequent fallow during a swidden cycle and the corresponding near Aitea Hamlet, northwestern Malaita Island, Solomon Islands.
Exchange Acidity Exchangeable Main Cations+Exchange Acidity (Effective CEC) Mean±S.D.(n* ) mg-eq. 100g soil (g-eq. m2 ) Base Saturation,% pH Exchangeable in H2O in 1N KCl Sampling Time Mg K Na Mean±S.D.(n* ) mg-eq. 100g soil (g-eq. m2 ) Mean±S.D.(n* ) mg-eq. 100g soil (g-eq. m2 ) Mean±S.D.(n* ) mg-eq. 100g soil (g-eq. m2 ) Mean±S.D.(n* ) mg-eq. 100g soil (g-eq. m2 ) Mean±S.D.(n* ) Mean±S.D.(n* ) Month, Year 1.4±n.a.**(10) (0.50) 0.4±n.a.**(10) (0.14) 0.3±n.a.**(10) (0.11) 4.2±n.a.**(10) ( 1.50) 11.1±n.a.**(10) ( 3.97) 62.2
5.2±n.a.**(10) 4.1±n.a.**(10) May, 1989
0.4±n.a.** (10) (0.11) 0.1±n.a.** (10) (0.03) 0.1±n.a.** (10) (0.03) 20.1±n.a.** (10) ( 5.30) 22.2±n.a.** (10) ( 5.85) 9.5 4.7±n.a.** (10) 3.7±n.a.** (10) December, 1990 0.4±n.a.**(10) (0.12) 0.1±n.a.**(10) (0.03) 0.1±n.a.**(10) (0.03) 20.4±n.a.**(10) ( 6.06) 22.2±n.a.**(10) ( 6.59) 8.1
5.1±n.a.**(10) 4.0±n.a.**(10) August, 1992
0.55±0.28 (10) (0.18) 0.10±0.09 (10) (0.03) 0.18±0.06 (10) (0.06) 32.2±16.1 (9)*** (10.48) 34.0±16.4 (9)*** (11.07) 5.9±2.5 (9) 4.9±0.14 (10) 4.1±0.16 (10) March, 1995 1.8±n.a.**(10) (0.57) 0.4±n.a.**(10) (0.13) 0.3±n.a.**(10) (0.10) 28.2±n.a.**(10) ( 8.98) 36.0±n.a.**(10) (11.47) 21.7
5.0±n.a.**(10) 3.9±n.a.**(10) May, 1989
0.8±n.a.** (10) (0.21) 0.1±n.a.** (10) (0.03) 0.3±n.a.** (10) (0.08) 0.5±n.a.** (10) ( 0.13) 21.3±n.a.** (10) ( 5.64) 97.7 6.4±n.a.** (10) 5.7±n.a.** (10) November, 1990
standard deviations of exchange acidity and effective CEC are respectively 44.0±40.4(10*
) and 45.9±40.8(10*
contrast to organic carbon, the increase in total nitrogen in the topsoil at the burning stage is not statistically significant, and, in this respect, the result here is not similar to that of S
EUBERTet al.(1977) which shows a marked increase in total nitrogen as well as organic
carbon. Both organic carbon and total nitrogen in both soil layers in the "Sanctuary Forest" are very high. This implies that, as the fallow period increases, the layer rich in organic matter becomes thicker. The results stated so far seem to support the popular view that "... soil humus increases in amount under the fallow"(NYEand GREENLAND, 1960, p. 47). As
well as organic carbon, the C N ratio in the topsoil increases significantly at the burning stage. These increases are probably related to the amount of partly burned and unburned biomass. The C N ratio of the topsoil is also the lowest at the stage of five years fallow. The difference between this and the previous stages is significant. On the other hand, the increase during the later phase of fallow (until the slightly more than ten years fallow
stage) does not appear to be significant. The C N value of the "Sanctuary Forest" marks
again significantly higher one than that at the five years fallow stage. With reference to the 15 20cm layer, this ratio at the five years fallow stage is significantly the lowest(Table 4).
b. "Available" phosphorus
The increase in "available" phosphorus as a result of burning the plant debris is obvious in the topsoil and is consistent with the results reported in many other papers. The percent-age increase in "available" phosphorus here, however, is not as noticeable as that reported in Northern Thailand (NAKANO, 1978) where the plant debris was burned during the late
stage of a distinct dry season. ANDRIESSE and KOOPMANS (1984) found an increase of
"available" phosphorus to be due partly to soil heating and possible mineralization of or-ganic phosphorus. The difference in the percentage increase of "available" phosphorus between this case and that in Northern Thailand may be due to the difference in the degree of temperature rise at the topsoil layer. This inference is based on the difference in the circumstances of the two cases. Whereas thoroughly dried plant debris were burned and, accordingly, the topsoil temperature ought to have risen very much in Northern Thailand(Z INKEet al., 1978), burning wet organic matter ought not to have raised it much in the case
of the present investigation.
In the topsoil, the content of "available" phosphorus, measured by the TRUOGand the B
RAYII methods, significantly decreases during the cropping stage and the subsequent initial stage of fallow, and significantly increases during the later phase of fallow. Whether its decrease during the earlier phase of fallow is statistically significant or not depends on the analysis method. LANDON(1984) has a cautious attitude towards the TRUOGmethod. If we regard the BRAYmethod as more reliable in this case, the decrease during the earlier phase of fallow is not significant. The results by this method indicate that its increase in the 15 20cm layer at the burning stage is significant, and the lowest value appears at the stage of 8 months fallow(Table 4). According to both methods, "available" phosphorus in the 15
20cm soil layer in the "Sanctuary Forest" are much higher than the topsoil. STR MGAARD (1992) reported another somewhat similar phenomenon. His data show an increase in
have no idea whether or not our preceding result is basically caused by the same procedure as the phenomenon shown in his data. Nevertheless, it is reasonable to assume that the long fallow may ensure the supply of "available" phosphorus at a deeper cropping layer. c. Exchangeable cations, effective CEC, and pH
Although the increase in exchangeable calcium in the topsoil at the burning stage is statistically significant, it is not very noticeable. The decline of exchangeable calcium during the cropping stage and the subsequent initial stage of fallow is marked. The lowest value of exchangeable calcium is found at the five years fallow stage. It seems to increase during the later phase of fallow. The content of exchangeable calcium in the soil in the "Sanctuary Forest" is abundant. In the 15 20cm layer, the changes are roughly parallel with those of the topsoil, although no increase at the burning stage is found(Table 4). These
data indicate, in contrast to those by RAMAKRISHNANand TOKY(1981), the importance of
fallow in the establishment of high levels of exchangeable calcium.
The pattern of exchangeable magnesium in both soil layers during the swidden cycle is very similar to that of exchangeable calcium, although the corresponding absolute values
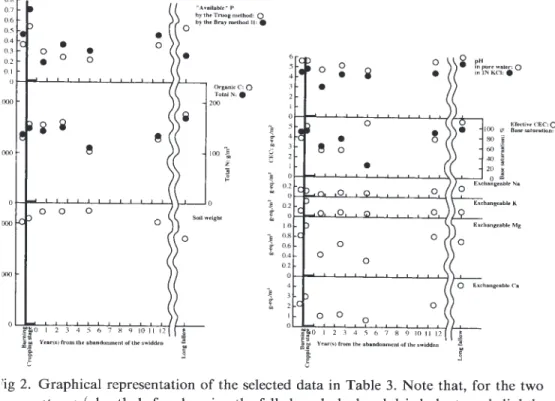
Fig 2. Graphical representation of the selected data in Table 3. Note that, for the two stages
(shortly before burning the felled or slashed and dried plants and slightly more than 10
years fallow), the respectively identical data shown by the ordinates of the graphs are
plotted, because the very soil sample obtained at the former stage is also that at the latter stage.
are much lower. In the "Sanctuary Forest", however, the amount of exchangeable magne-sium in each soil layer is not more than that found in the slightly more than ten years fallow. In the case of exchangeable potassium, there is a marked increase in the topsoil at the burning stage. This component was probably supplied by the ash. The decline in the topsoil during the cropping stage and the subsequent initial fallow stage is sharp. A recovery, however, from the lowest value at the five years fallow stage is significantly recognized in the later phase of fallow(Table 3 and Fig. 2). During a long fallow period, the
exchange-able potassium content in the topsoil does not seem to increase at all. Exchangeexchange-able potas-sium in the 15 20cm layer is very low throughout the earlier phase of fallow. As well as the topsoil, its increase at this layer during the late phase of fallow is noticeable(Table 4).
In the "Sanctuary Forest", however, exchangeable potassium is low in the 15 20cm layer. The change pattern of exchangeable sodium parallels that of exchangeable potassium. The former, however, does not show an increase at the burning stage at all. The "Sanctuary Forest" topsoil shows some accumulation of sodium(Table 3).
JORDAN’s(1987) experimental study showed little decrease in exchangeable calcium and
potassium during the cropping stage, but a noticeable decline at the initial fallow stage. On the other hand, NAKANO(1978) indicated declines in both components in the topsoil during
the cropping stage as well as the fallowing stage. The data in this paper concerning ex-changeable calcium and potassium are inconclusive as to which pattern is applicable. NYE
and FOSTER(1961) presented the idea of "pumping of nutrients" during the fallow phase.
The results of this investigation suggest exchangeable cations accumulate to some degree at the surface layers during the late phase of fallow in the swidden cycle.
The nutrient stock in soil is determined by the balance between its supply and loss. As shown in the previous paper (NAKANO, 1992), the recovery growth of vegetation in this
survey site during the earlier phase of fallow is very vigorous. Therefore, it is reasonable to suggest that large amounts of some nutrients are depleted from the surface layer of soil, besides the losses from leaching and soil erosion, partly by absorption through the roots of seedlings. Further factor at the initial fallow stage may be low litter production. These factors will bring about the decline in the stock of those components at the surface layer of soil. This popular theory seems to be reflected by the results of some components in Tables 3 and 4, and is displayed in Fig. 2.
The values of effective cation exchange capacity(CEC) in the topsoil decrease markedly
during the cropping stage and the initial fallow stage owing to the decline in exchangeable cations. During the middle and later stages of fallow in the swidden cycle, however, effec-tive CEC recovers, at first, owing mainly to the high value of exchange acidity(Table 3).
Accordingly, the base saturation percentage at the five years fallow stage is lowest during the swidden cycle. The topsoil of the "Sanctuary Forest" has high values of both cation exchange capacity and base saturation percentage. The change patterns of the two indicators are also displayed in Fig. 2. ANDRIESSE and SCHELHAAS (1987b) showed a noticeable
dry season. They reported that this rise in CEC was closely related to the increase in carbon because of the incomplete burning of wet organic matter. The circumstances at Aitea, Malaita Island, are similar to those in Sarawak. Table 3 showed a slight increase in CEC after burning, although the statistical significance of the difference cannot be confirmed. In the case of the present investigation(Table 3), however, the CEC increase is due mainly
to the increase in exchangeable calcium and potassium, probably derived from the ash. We are unsure whether or not this fact supports ANDRIESSEand SCHELHAAS’s(1987b)
asser-tion. In reference to the 15 20cm layer, on the other hand, its sharp decline at the burning stage is marked mainly because of the abrupt decline, the reason for which is unknown at present, in exchange acidity. However, it increases during the cropping stage and the initial stage of fallow, and has almost recovered in the middle of the fallow period due mainly to the rise of the values of exchange acidity. The change pattern of base saturation percentage at the 15 20cm layer is opposite to that of cation exchange capacity. The exchange acidity of the soil in the "Sanctuary Forest" shows a very low value, and, accordingly, base satura-tion percentage is extremely high. The effective CEC value at this deeper soil layer of the "Sanctuary Forest" is similar to or much lower than that of the fallow, and lower than that of the topsoil there(Tables 3 and 4).
A rise of pH at the burning plant debris stage is confirmed(for instance, NAKANO, 1978; JORDAN, 1987). Its rise is sometimes discussed in relation to the availability of phosphorus
components in acid soils(JORDAN, 1987). In this investigation, such a rise was not
meas-ured in pure water for topsoil layer, although it seems fully significant in 1N KCl. The pH measurements of the sample from the 15 20cm layer show also only slight rises during the burning time for both methods. Throughout the earlier phase of fallow up to the five years fallow stage, all the pH values of topsoil samples are noticeably lower, by means of both methods, than the stage of one week after burning. During the later phase of fallow, its value seems to rise significantly. The sample from the "Sanctuary Forest" showed higher values using both methods than the corresponding sample from the fallow. These results are also displayed in Fig. 2. According to the both methods, the pH values of the samples from the 15 20cm layer did not change much throughout the swidden cycle. Those of the 15 20cm layer sample from the "Sanctuary Forest" showed much higher values than any from the fallow. Particularly, the pH value of the "Sanctuary Forest" in pure water is remarkably high. On the basis of the discussion mentioned above, this result may be related to the high content of "available" phosphorus in this deeper soil layer.
Concluding Remarks
From Table 3 and Fig. 2, it can be concluded that some properties of the topsoil in the fallows far less than ten years after garden abandonment are less favorable for the
reutilization of the investigation site as a swidden. This conclusion does not seem to change even when the beneficial effects of heating and adding ash are taken into account. After the stage of five years fallow, the soil condition seems to improve gradually. In this investiga-tion, the significance of long fallow for swiddening is considered to have been scientifically pointed out, at least, to some degree. As was discussed in the previous paper(NAKANO, 1992), the results in Fig. 2 strongly suggests the appearance and spread of degraded and
irreversible grasslands are brought about mainly by soil conditions unfavorable for forest recovery, particularly if the fallow periods of most swiddens in a region are extremely shortened.
LAMBERT’s(1986) data based on his three years investigation in seasonally wet and dry
Belize show considerable monthly fluctuations of the values concerning soil properties. Not a few fluctuations, however, appear to be related to these seasons. Because the northwestern region of Malaita Island where this investigation is sited is ever-humid (Table 1), the
fluctuations owing to dry periods may have been alleviated by our sampling schedule. Nevertheless, future investigations will involve precise monitoring over a few decades of swidden cycles.
We suggest that, on the basis of this study, ecology of a swidden cycle in an ever-humid region ought to be considered substantially different from those in a region with humid and distinctly dry seasons because "The precise action of bush-fallow on soil fertility under different climatic conditions is still not completely understood" (ANDRIESSE and S
CHELHAAS, 1987a, p. 286).
References
ALLEN, S.E., GRIMSHAW, H.M., PARKINSON, J.A., and QUARMBY, C. 1974. Chemical Analysis of Ecological Materials. x+565 pp.+1 folded sheet of diagrams. Blackwell
Sci. Pub., Oxford, London, Edinburgh, and Melbourne.
ALLISON, L.E. 1960. Wet-combustion apparatus and procedure for organic and inorganic carbon in soil. Soil Sci. Soc. America Proc., 24: 36-40.
ANDRIESSE, J.P. 1977. Nutrient level changes during a 20 year shifting cultivation cycle in Sarawak(Malaysia). Paper Presented at the ISSS Conference ’CLAMATROPS’, Kuala
Lumpur, August 15 20th 1977. Royal Tropical Institute, Amsterdam.
and KOOPMANS, T.Th. 1984. A monitoring study on nutrient cycles in soils used for shifting cultivation under various climatic conditions in tropical Asia. I. The influence of simulated burning on form and availability of plant nutrients. Agriculture, Ecosystems and Environment, 12: 1-16.
and SCHELHAAS, R.M. 1987a. A monitoring study of nutrient cycles in soils used for shifting cultivation under various climatic conditions in tropical Asia. II. Nutrient stores
in biomass and soil results of baseline studies. Agriculture, Ecosystems and Environment, 19: 285-310.
and 1987b. A monitoring study on nutrient cycles in soils used for shifting cultivation under various climatic conditions in tropical Asia. III. The effects of land clearing through burning on fertility level. Agriculture, Ecosystems and Environment, 19: 311-332.
Anonymous 1978. FAO-Unesco Soil Map of the World, 1:5 000 000. Vol. X: Australasia. xiv+220 pp.+2 maps, UNESCO, Paris.
1988. FAO-Unesco Soil Map of the World: Revised Legend. World Soil Resources Report 60. 119 pp. FAO, Rome.
AWETO, A.O. 1981a. Secondary succession and soil fertility restoration in south-western Nigeria. I. Succession. Jour. Ecol., 69: 601-607.
1981b. Secondary succession and soil fertility restoration in south-western Nigeria. II. Soil fertility restoration. Jour. Ecol., 69: 609-614.
土壌養分測定法委員会(編) 1970. 肥沃度測定のための土壌養分分析法. 440頁, 養
賢堂, 東京. [Commission for Determining the Methods of Plant-nutrient Analyses of
Soil(ed.) 1970. Analysis Methods of Plant-nutrient Components in Soil for Evaluating
Soil Fertility. 440 pp., Yokendo, Tokyo.]
JORDAN, C.F. 1987. Shifting cultivation: Slash and burn agriculture near San Carlos de Rio Negro, Venezuela. In: Amazonian Rain Forests: Ecosystem Disturbance and Recovery. Ecological Studies 60 (Ed. JORDAN, C.F.), 9-23, Springer-Verlag, New York, Berlin,
Heidelberg, London, Paris, and Tokyo.
LAMBERT, J.D.H. 1986. Nutrient dynamics in milpa agriculture and the role of weeds in initial stages of secondary succession in Belize, C.A. Plant and Soil, 93:303-322. LANDON, J.R.(ed.) 1984. Booker Tropical Soil Manual. xiv+450 pp., Booker Agriculture
International Ltd., London, and Longman, Burnt Mill, U.K.
NAKANO, K. 1978. An ecological study of swidden agriculture at a village in Northern Thailand. South East Asian Studies, 16: 411-446.
1992. On the vegetational change in fallows at a hamlet in a northwestern region of Malaita, the Solomon Islands. South Pacific Study, 12: 113-127.
and Syahbuddin 1989. Nutrient dynamics in forest fallows in South-East Asia. In: Mineral Nutrients in Tropical Forest and Savanna Ecosystems. Special Publication Series of the British Ecological Society, No. 9 (Ed. PROCTOR, J.), 325-336, Blackwell Sci.
Pub., Oxford, London, Edinburgh, Boston, and Melbourne.
NYE, P.H. and FOSTER, W.N.M. 1961. The relative uptake of phosphorus by crops and
natural fallow from different parts of their root zone. Jour. Agric. Sci., 56: 299-306. and GREENLAND, D.J. 1960. The Soil under Shifting Cultivation. Technical Communication No. 51 of Commonwealth Bureau of Soils, Harpenden, vi+156 pp.;
Commonwealth Agricultural Bureaux, Fahnham Royal, U.K.
RAMAKRISHNAN, P.S. 1992. Shifting Agriculture and Sustainable Development: An Interdisciplinary Study from North-Eastern India. Man and the Biosphere Series, Vol. 10, xviii+424 pp., UNESCO, Paris, and the Parthenon Pub., Carnforth, U.K., and Park
Ridge, New Jersey, U.S.A.
RAMAKRISHNAN, P.S. and TOKY, O.P. 1981. Soil nutrient status of hill agro-ecosystems and recovery pattern after slash and burn agriculture (jhum) in North-Eastern India. Plant
and Soil, 60: 41-64.
SABHASRI, S. 1978. Effects of forest fallow cultivation on forest production and soil. In: Farmers in the Forest: Economic Development and Marginal Agriculture in Northern Thailand.(Ed. KUNSTADTER, P., CHAPMAN, E.C., and SABHASRI, S.),
160-184, The Univ. Press of Hawaii, Honolulu.
SEUBERT, C.E., SANCHEZ, P.A., and VALVERDE, C. 1977. Effects of land clearing methods on soil properties of an ultisol and crop performance in the Amazon jungle of Peru. Trop. Agric.(Trinidad), 54: 307-321.
STR MGAARD, P. 1992. Immediate and long-term effects of fire and ash-fertilization on a Zambian Miombo woodland soil. Agriculture, Ecosystems and Environment, 41: 19-37. TAKEUCHI, K. 1963. Mathematical Statistics: Methods for the Analyses of Data. viii+373
pp., Toyo-keizai-shinpo-sha, Tokyo.
WALL, J.R.D. and HANSELL, J.R.F. 1974. Land Resources of the British Solomon Islands Protectorate (Land Resource Study 18), Vol. 3: Malaita and Ulawa. x+125 pp.+8
separated maps. Land Resources Div., Ministry of Overseas Development, Surrey, U.K. ZINKE, P.J., SABHASRI, S., and KUNSTADTER, P. 1978. Soil fertility aspects of the Lua’ forest fallow system of shifting cultivation. In: Farmers in the Forest: Economic Development and Marginal Agriculture in Northern Thailand.(Ed. KUNSTADTER, P., C
HAPMAN, E.C., SABHASRI, S.), 134-159, The Univ. Press of Hawaii, Honolulu.