Emergency Medical Support System for Visualizing
Locations and Vital Signs of Patients in Mass Casualty Incident
Teruhiro Mizumoto1, Shinya Imazu1, Weihua Sun1, Naoki Shibata2and Keiichi Yasumoto1 1Graduate School of Information Science, Nara Institute of Science and Technology
Ikoma, Nara 630-0192, Japan Email:{teruhiro-m, shinya-i, sunweihua, yasumoto}@is.naist.jp
2Department of Information Processing and Management, Shiga University
Hikone, Shiga 522-8522, Japan Email: shibata@biwako.shiga-u.ac.jp
Abstract—The triage tag is used in Mass Casualty Incident
(MCI) to check the priority of patients treatments and condi-tions. However, it is difficult to grasp a change in the patient’s information since it is a paper tag. In this paper, we propose a system using the electronic triage tag (eTriage) that facilitates emergency medical technicians to grasp patients locations and conditions through visualization. This system provides the following three views of the patients information: (1) Inter-site view which shows on a map an overview of the latest status in multiple first-aid stations including the number of technicians and patients of each triage category; (2) Intra-site view which shows detailed status of each first-aid station including the location, triage category, and vital signs of each patient on a 3D map created based on the environment mapping technique; and (3) Individual view which shows vital information of patients on a tablet PC according to its orientation using the augmented reality technique. In this paper, we describe the design and implementation of the proposed system with some preliminary evaluation results.
Keywords-emergency medical support system, electronic
triage tag, vital signs, visualization
The triage tag is used in Mass Casualty Incident (MCI) to check the priority of patients treatments and conditions. However, with the triage tag made from paper, the informa-tion of the patient cannot be obtained until a doctor finds and picks it up. This can lead to a treatment delay and inadequate treatment order of patients. In this paper, we design and develop a system using the electronic triage tag (eTriage) [1] that allows emergency medical technicians to easily grasp patients locations and conditions through visualization.
This system supports officers and emergency medical technicians in a command post and first-aid stations. To appropriately allocate limited resources like technicians and ambulances, the command post requires to grasp the number of technicians and patients per triage category on each first-aid station. First-aid stations require to grasp sudden change of patient’s condition, and other information like locations and vital signs in order to instruct an appropriate technician to treat the specified patient. Accordingly, we design a system with the following views of the patients information: (1) Inter-site view which shows on a map an overview of the latest status in multiple first-aid stations including the number of technicians and patients of each
triage category; (2) Intra-site view which shows detailed status of each first-aid station including the location, triage category, and vital signs of each patient on a 3D map created based on the environment mapping technique; and (3) Individual view which shows vital information of patients on a tablet PC by overlaying it on the realtime captured video using the augmented realty technique. We have developed a system with the above functions consisting of (i) electronic Triage tags with vital sensors and the ZigBee communication interface, (ii) a web server with Java Servlet and a database, and (iii) three types of client software for realizing the above three views.
The remainder of this paper is organized as follows: Section I overviews the present triage system and our eTriage project. Section II gives related work. The proposed system is described in Section III and Section IV. Section V provides preliminary evaluation results. Finally, we conclude the paper in Section VI.
I. ELECTRONICTRIAGEPROJECT
In this section, first we briefly look at the present triage system and identify the problems. Then, we describe overview of our eTriage project.
A. Present Triage and Problems
Simple triage (First stage triage) is usually applied to pa-tients in an MCI, in order to prioritize the papa-tients according to the severity of their injuries. This simple triage is done before transportation of the patients to hospitals is ready. The categorization of patients is done by attaching paper-based tags to patients. An example of paper tags is shown in Fig. 1. The patients are labeled with one of the four triage categories with the following colors:
• Black/Deceased: dead or mortally wounded/ no care required.
• Red/Immediate: immediate care/ life-threatening.
• Yellow/Delayed: urgent care/ can delay up to one hour.
• Green/Minor: delayed care/ can delay up to three hours. S.T.A.R.T (Simple Triage And Rapid Treatment) [2] is a widely used simple triage system. The procedure of S.T.A.R.T is shown in Fig. 2. This method is used in MCIs
© 2012 IEEE. Personal use of this material is permitted. Permission from IEEE must be obtained for all other uses, in any current or future media, including reprinting/republishing this material for advertising or promotional purposes, creating new collective works, for resale or redistribution to servers or lists, or reuse of any copyrighted component of this work in other works. DOI:10.1109/PerComW.2012.6197611
Figure 1. Ordinary Paper-based Triage Tags
Figure 2. Classification of severity by START method.
by earthquakes, train wrecks, bus accidents and so on. By S.T.A.R.T method, a lightly trained emergency personnel can apply triage to a patient in 2 minutes.
The triage category (color) for a patient is decided as follows:
1) If the patient can walk by himself/herself, then the patient is tagged with the green label.
2) If the patient is not breathing, then the personnel will try to clear the airway and perform possible airway maneuvers to get the patient breathing. If all attempts fail, then the patient is presumed dead, and thus tagged with the black label.
3) If the patient is breathing, then the personnel measures the breathing rate. If the rate is greater than 30 per minute or less than 10 per minute, then the patient is tagged with a red label requesting immediate care because that is one of the primary signs for shock. 4) If the patient’s breathing rate is normal, pulse and the
circulatory system are checked. If the patient lacks a radial pulse (greater than 120 or less than 30 per minute), then immediate attention is required, and thus tagged with a red label. Otherwise, the personnel evaluates the patient’s mental status.
5) The personnel will ask the patient to follow simple questions/instructions like “Clench your fist.” If the patient can follow the instructions, then he/she is labeled with the yellow tag, Otherwise, the patient is labeled with the red tag.
However, the paper triage tag has the following problems:
• Even when the patients’ conditions change, their triage tags can neither reflect the change nor alert emergency
Figure 3. Electronic Triage Tag ”Light” for fingertip
Figure 4. Electronic Triage Tag ”Full” for arm
personnel.
• Since there is no priority among patients with the same color tag, they are transported in random order.
• Mis-diagnosis cannot be avoided.
• The emergency personnel’s feeling of oppression (on a possible wrong diagnosis) in deciding the color code for each patient is heavy.
B. eTriage Project
To resolve the above problems, the electronic triage project [1][3] has developed the electronic triage tag (eTriage) composed of biosensors and a IEEE 802.15.4 based communication function. There are two types of eTriage: the Light type which is attached to a finger as shown in Fig. 3 and the Full type which is attached to an arm as shown in Fig. 4. The Light type can sense the patients’ pulse and blood oxygen levels (Spo2). In addition to these, the Full type can sense the patients’ breathing rate. The eTriage sends the above information to the management server and technicians devices by wireless communication. Technicians mobile devices (iPhone is used) which interact with eTriage and the management server and display the patients’ information are also developed. The technician can input and send a special diagnostic information to the management server with this device.
Moreover, this project develops a range-free localization algorithm based on ZigBee [4] that calculates positions of patients and technicians. In addition, this project develops a mobile router equipped with ZigBee/WiFi communication and GPS functions so that it can be used as a reference point. In this paper, in addition to the above system, we de-velop an emergency medical support system for intelligibly displaying the patients’ vital and location information.
II. RELATEDWORK
Killeen et al. developed a system called WIISARD which inputs and sends the patients’ information using PDAs [5]. In WIISARD, the triage result is determined by inputting age, gender, a respiratory rate, capillary refilling time, and mental status of a patient. In addition, all patients’ information in a disaster site can be shared through IEEE 802.11 commu-nication. In this system, however, the patients’ information
Figure 5. System organization
can not be sensed in realtime, so technicians can not grasp sudden change of patients’ condition.
Chu et al. proposed a wireless telemedicine system (called WISTA) [6]. WISTA collects information in a disaster site with video cameras, sensors and texts. WISTA can provide not only the triage result but also information and video of ECG and ultrasound. In WISTA, however, the patients’ triage result and location are manually input by PDAs, so the information can be delayed. In addition, WISTA displays individual patient’s information in detail, but does not provide a function for showing an overview of the latest status in the whole disaster site.
Aiming to realize an advanced triage system, multiple institutes and organizations advanced several projects. The Advanced Health and Disaster Aid Network (AID-N) [7][8] was developed by the Johns Hopkins University Applied Physics Laboratory with the National Library of Medicine (NLM). AID-N is a testbed for technologies that facilitate emergency medical personnel to more efficiently triage, track, and transport patients while sharing real-time patient information and conditions in a disaster site among the personnel.
III. PATIENTSINFORMATIONVISUALIZATIONSYSTEM
In this section, first we show organization of the proposed system, and then describe the detail of the three different views that show patients information in different ways for effective emergency medical support.
A. System organization
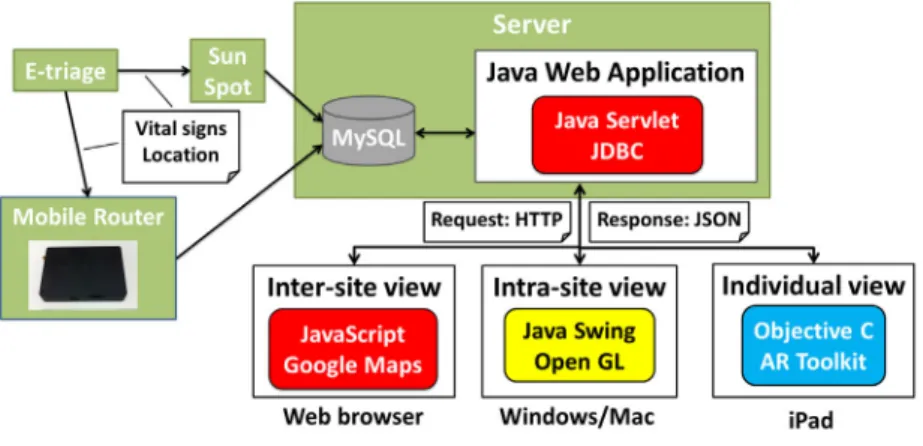
The system organization is shown in Fig. 5. The server collects patients information such as vital signs and loca-tions by eTriage and stores the information in a database (MySQL). The system components realizing inter-site, intra-site, and individual views access the server and receive patients data (in JSON format) by HTTP. Each component displays the received patients data as described below.
B. Inter-site view
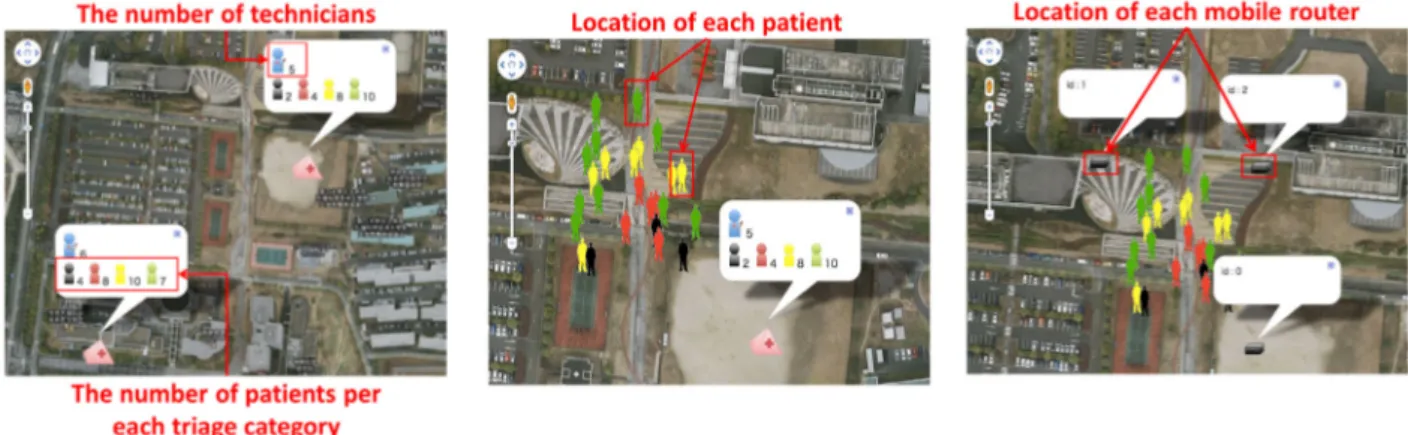
The inter-site view aims to facilitate a commander in a command post to grasp the number of patients and allocated technicians in multiple first-aid stations (temporarily built in disaster sites) so that the commander can decide appropriate dispatch of technicians and ambulances to each first-aid station. Therefore, we designed the inter-site view as a web-based GIS (Geographic Information System) application that shows an overview of patients and technicians latest information over multiple sites on Google Maps. This view can be easily used through arbitrary web browser. This view displays the number of technicians and patients per triage category on each first-aid station and their locations depending on the map scale. In case of a small scale map, as shown in Fig. 6, it displays a balloon showing the number of technicians and patients per triage category for each first-aid station. In case of a large scale map, as shown in Fig. 7, it displays each patient as an icon to clarify its position and triage category. Moreover, as shown in Fig. 8, it can display the positions of mobile routers (with GPS) and adjust their positions on the map in order to improve triage tag’s localization accuracy by reducing GPS positioning error. Similarly, it can display other useful information on the map, for example, locations of ambulances if they are available. C. Intra-site view
The intra-site view facilitates a leader at each first-aid station to monitor the vital signs and location of patients and find sudden changes of patients conditions. This view enables real-time monitoring of detailed position and vital signs of each patient. In order to display the position of each patient intuitively, it displays a 3D object for each patient on a 3D panoramic view created by the environment map creation tool explained in Section IV.
As shown in Fig. 9, the intra-site view consists of four windows: (i) 3D view window, (iii) bird-eye view window, (iii) vital sign window, and (iv) event window. In the 3D
Figure 6. Inter-site view (small scale) Figure 7. Inter-site view (large scale) Figure 8. Inter-site view with location of MobileRouter
view window, patients and medical staff are displayed as 3D objects on the photographic background according to the position and angle of the virtual camera. The 3D objects of the patients are painted in one of the four triage colors while objects of the medical staff are painted in white. In the bird-eye view window, the positions of the patients are displayed on the satellite image of the corresponding area. The camera position and angle for the 3D panoramic view can be chosen by clicking camera icon.
In the vital sign window, real-time vital and position information of patients taken by electronic triage tags are displayed. By using “direct the camera” function from a pop-up menu on a selected patient in the list, the specified patient is immediately displayed on the 3D view window. In the event list window, the times and explanations of events are displayed. For example, when there is an urgent condition change of a patient, the time of the event and the ID of the patient is added and displayed on the event list. This list also has the “direct the camera” function which can be used via a pop-up menu to immediately display the corresponding patient on the 3D view window.
D. Individual view
Emergency medical personnel can know rough positions of patients with the inter-site view or the intra-site view. However, since localization based on ZigBee will produce several meters error and/or there may be many patients in close proximity, it may be difficult to find the specified patient to transport or treat.
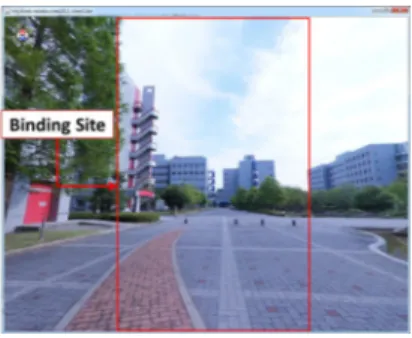
Thus, we provide the individual view that is used by a technician to easily look at the detailed vital information of patients and find the specified patient by directing a tablet PC toward the patients. This view uses augmented reality (AR) to overlay the patient’s information on the patient in the real-time video captured by a camera. Fig. 10 shows an example usage of the individual view for two patient’s conditions.
Figure 9. Intra-site view
To use this view, we suppose that eTriage and a marker associated with the eTriage ID are attached to each patient. The technician can look at the patient’s condition by just directing the mobile device toward the patient. To realize this, a marker attached to the patient is identified by the camera of the mobile device and the patient’s information is retrieved from the database server with the ID of the marker. The individual view has been implemented on iPad 2 with ARToolKit [9].
IV. ENVIRONMENTMAPCREATIONTOOL
In this section, we explain the environment map creation tool which creates 3D panoramic images used in the intra-site view. This tool consists of the editing tool for control points, the image converter and the environment map viewer. These tools can create and display a 360-degree panoramic image on the spot from a few fisheye images and some control points input by a user. For this purpose, the user uses a commodity single-lens reflex camera with a circular
Figure 10. Individual view
Figure 11. Editing Tool for Control Points
fisheye lens and a tripod to take three fisheye images by rotating the camera 120 degrees on the tripod after taking each picture.
A. Editing Tool for Control Points
The user first loads the fisheye images as shown in Fig. 12. Then the user selects two images from all the images and specify 5 to 10 control points. This operation must be repeated for all pairs of fisheye images and the resulting information is saved in a control point state file. The blue squares in Fig. 11 are the control points specified by the user.
B. Converter
The user opens a control point state file saved in the editing tool, and performs conversion of images. When we apply conversion to the fisheye images in Fig. 12, the six images in Fig. 13 that correspond to cube faces are created. When the conversion is performed, it finishes the conversion in about 10 seconds against three 2448x1624 images on a Core-i7, 16GB, Windows7 64bit workstation.
C. Viewer
After the conversion is finished, the user can check the synthesized 3D panoramic image using the viewer tool. The user can adjust the direction and magnification so that the user can see the environment from any angle. Fig. 14 shows
Figure 12. The original fisheye image
Figure 13. The created cube map
an example usage of the viewer. In this example, 10 control points were used. The distortion of the resulting image can be reduced by increasing the number of control points.
V. PRELIMINARYEVALUATION
In this section, we describe the preliminary evaluation about the performance of each view. This evaluation con-firms the time until reflecting latest patients’ vital signs on each view. In order to use many patients’ data, we developed a patients simulator which creates patients and automatically updates the patients vital signs and reflect them in the database. We confirmed the performance for 1, 10, and 100 patients. The inter-site view should display the information about multiple first-aid stations. Therefore, we also confirmed the performance of the inter-site view for 1000 patients. We used a Core-i7, 4 GB, Windows 7 32 bit as the server. The server runs Apache, MySQL, the patients simulator for creating patients and the web application for sending information to each view. For the inter-site view and the intra-site view, another Core-i7, 4GB, Windows 7 32 bit was used. We ran the individual view program on a 1 GHz dual-core, 512 MB, iOS 4.3 iPad2. The client machine (Windows 7) is connected with the server via a Gigabit Ethernet LAN, and iPad2 is connected to the server via a 802.11g WLAN access point connected to the gigabit Ethernet.
Each view program sends a request message to the server to receive the information as patients’ vital signs and loca-tion. In this evaluation, we measured the processing time
Figure 14. Viewer
since the request message is sent to the server until the information is reflected in each view. We measured 100 times the processing time and calculated the average. The result is shown in Table I.
Table I
THE AVERAGE PROCESSING TIME AGAINST NUMBER OF PATIENTS
Inter-site Intra-site Individual 1 0.06s 0.6s 0.05s Number of 10 0.08s 0.8s 0.06s patients 100 0.16s 1.12s 0.14s 1000 1.16s N/A N/A
In the case of 1, 10 and 100 patients, the inter-site view and the individual view could reflect the information within 0.2 seconds. Although the intra-site view needed more processing time than the inter-site view and the individual view in order to display more information, it could reflect the information within about 1 second. Even if there are 1000 patients, the inter-site view could reflect the information within about 1 second.
In this experiment, we did not consider the delay imposed between eTriage and the server, but it will take some time due to packet collision, etc when there are many eTriage in proximity. So, we need to reduce the processing time especially when there are many patients. In order to reduce the overall reflection time, we will try to incorporate a strategy that the server preferentially sends information of high priority patients and do not send information without a big change in vital signs from the previous measurement.
VI. CONCLUSION
In this paper, we proposed an emergency medical sup-port system that displays information over a large disaster area to emergency medical personnel. The proposed system provides three views: inter-site view (displays overviews of the status of multiple disaster sites), intra-site view (dis-plays patients locations and conditions on a 3D panoramic background), and individual view (superimposes patients conditions and triage category onto real view by using AR technology). We described the system organization and implementation to realize the three views consisting of
eTriage, a server with web application and a database, and client software.
Our future work includes demonstration of the proposed system on field experiments such as disaster prevention practice in order to evaluate its effectiveness and perfor-mance. In the experiments, we plan to evaluate to what extent the three views of the proposed system help a com-mander/leader/technician in grasping the overall situation of multiple disaster sites, the sudden condition change of a patient, and the position of the patient with the sudden change, respectively.
ACKNOWLEDGEMENT
This work was supported by Japan Science and Technol-ogy Agency, CREST.
REFERENCES
[1] “Advanced Wireless Communication Technology for Efficient Rescue Operations,” http://www-higashi.ist.osaka-u.ac.jp/research/e-triage.html. URL last accessed November 15, 2011.
[2] Benson, M., Koenig, KL., and Shultz, CH.: “Disaster triage: START, then SAVE-a new method of dynamic triage for victims of a catastrophic earthquake,” Prehospital Disaster
Med, Vol. 11, No. 2, pp. 117–124, 1996.
[3] Kiyama, N., Kusuda, J., Fujii, S., Uchiyama, A., Hiromori, A., Umedu, T., Nakamura, Y., Oode, Y., Tanaka, H., Yamaguchi, H. and Higashino, T.: “An Advanced Electronic Triage System for Rescue Operations in Disasters,” J. IPS. Japan,Vol. 51, No. 9, pp. 1916–1929, 2010.
[4] Higashino, T., Uchiyama, A. and Yasumoto, K.: “eTriage: A Wireless Communication Service Platform for Advanced Rescue Operations,” Proc. of IoTSP 2011, 2011.
[5] Killeen, J., Chan, T., Buono, C., Griswold, W. and Lenert, L.: “A Wireless First Responder Handheld Device for Rapid Triage, Patient Assessment and Documentation during Mass Casualty Incidents,” Proc. of AMIA Annu Symp 2006, pp. 429– 433, 2006.
[6] Chu, Y. and Ganz, A.: “WISTA: A Wireless Telemedicine System for Disaster Patient Care,” J. of MONET, Vol. 12, No. 2–3, pp. 201–214, 2007.
[7] Gao, T., Massey, T., Selavo, L., Crawford, D., Chen, B., Lorincz, K., Shnayder, V., Hauenstein, L., Dabiri, F., Jeng, J., Chanmugam, A., White, D., Sarrafzadeh, M. and Welsh, M.: “The Advanced Health and Disaster Aid Network: A Light-weight Wireless Medical System for Triage,” Trans. on
BioCAS, Vol. 1, No. 3, pp. 203–216, 2007.
[8] Gao, T., Pesto, C., Selavo, L., Chen, Y., Ko, G., Lim, H., Terzis A., Watt, A., Jeng J., Chen, B., Lorincz, K. and Welsh, M.: “Wireless Medical Sensor Networks in Emergency Response: Implementation and Pilot Results,” Proc. of 2008 IEEE Conf.
on Tech. for Homeland Security, pp. 187–192, 2008.
[9] Kato, H. and Billinghurst, M: “Marker tracking and HMD calibration for a video-based augmented reality conferencing system,” Proc. of IWAR ’99, pp. 85–94, 1999.