Sustainability, Inclusive Wealth and Health
Stock
著者
Isma Addi Bin Jumbri
学位授与機関
Tohoku University
学位授与番号
11301乙第9410号
SUSTAINABILITY, INCLUSIVE WEALTH AND HEALTH STOCK
A Thesis Submitted
In Partial Fulfilment of the Requirements
For the Doctoral Degree
By Isma Addi Jumbri
To the
GRADUATE SCHOOL OF ENVIRONMENTAL STUDIES
TOHOKU UNIVERSITY
Sendai, Japan
2020
ii
ABSTRACT
All this time, it has been an elusive search in determining how to go beyond Gross Domestic Product (GDP) in achieving a true indicator of sustainable development and social well-being. Although GDP is seen as a fair measure of economic activity, however GDP ignores social costs, environmental impacts, and income inequality. Recently, economists suggest that to measure real economic growth and social well-being, GDP needs to be replaced. It needs indicators that enhance a fundamentally sustainable development i.e. development that boosts quality of life while living within the supporting ecosystems’ capacity. Compared to other possibilities, Inclusive Wealth (IW) has several significant advantages as sustainable development measure. The IW explores a country’s well-being through sustainability lens, measuring the social value instead of its currency value, of all its wealth, including its natural resources, human and produced capital.
Elaborating more on the IW concept for local and global scope, this thesis is divided into five chapters. Chapter 1 entails the background and objectives of the study. Sustainability, IW and focusing on health stock are explained in Chapter 2. Chapter 3 depicts the health stock results from 140 countries from 1990 to 2015, forecasting trends from 2016 to 2100 and discussion on the implications for achieving sustainable society from the heterogeneous health stock condition. Extending the framework of health stock, Chapter 4 presents global and comparison between countries inequalities in length of health stock for 140 countries from 1990 to 2015 and investigate the relationship between countries inequalities of health stock and national wealth. National wealth in this study includes GDP, IW and also firms’ net income. Last but not least, Chapter 5 draws the conclusion and suggestions to extend this research.
iii
Low-income countries (LICs) have much larger and more rapidly growing health stocks based on health stocks from 1990 to 2015. In the long run, in 2100 (forecast year), upper-middle income countries (UMICs), specifically countries in the Middle East and North Africa (MENA), are showing great growth that benefits from the working-age populations. Immigration has determined as one of the factor contributing to health stock growth together with fertility rate, ageing population, working-age and youth populations.
In terms of health stock inequality and its relation to national wealth, the projected global health Gini coefficient shows that the health stock declined globally. The Gini coefficient for LICs showed the deepest drop in health stock, falling in 25 years from 0.69 to 0.66. Based on the analysis, rapid population growth and an increase in the youth share of the working-age population in LICs were the contributing factors of the inequality decline. Many countries with positive growth in health stock also showed a strong positive relationship with GDP and IW. However, several countries, still exhibited a negative relationship with natural capital, a part of the IW.
These findings enhanced the understanding that health stock is an important component of global sustainable development that should be regularly included in the assessments of other assets as a stock-based sustainability index to calculate national wealth and sustainability accurately. For instance, the negative relationship between health stock and natural capital is a sign of unstable development because sustainable development requires not only the preservation of GDP but also IW, as it is a collective set of assets consists of human, natural and produced capital. This thesis concludes that health stock is also an important component assessing health inequality and sustainable development goals (SDGs) related to health.
iv
TABLE OF CONTENTS
Table of Contents………. ii
List of Figures ……….vii
List of Tables………..………..ix
List of Abbreviations……….x
Abstract ……… ii
Chapter 1: Introduction………..… 1
1.1 Sustainability Measure ………..……1
1.2 Sustainability, Well-Being, and Inclusive Wealth……….……….... 6
1.3 Previous Application Review....……….……….. 11
1.4 Health and Sustainable Development Goals (SDGs)………14
1.5 Inclusive Wealth and Health Stock………...15
1.6 Objectives and Contributions………... 19
1.7 Thesis Overview……….. 21
Chapter 2: Sustainability, Productivity and Inclusive Wealth………. 23
2.1 Introduction………. 23
2.2 Inclusive Wealth Measurement………24
2.3 TFP Measurement……… 25
2.3 Inclusive Wealth Adjusted by TFP Measurement….……….. 28
2.4 Data……….………. 30
2.5 Empirical Results………..…... 31
2.5.1 Total Factor Productivity………..31
v
2.7 Inclusive Wealth Index Adjusted (IWI-Adjusted)………40
2.8 G7 Countries………...…..44
2.9 Conclusion………47
Chapter 3: Heterogeneous Global Health Stock and Growth: Quantitative Evidence from 140 Countries, 1990-2100………...…… 49
3.1 Background……….…. 49
3.1.1 Health and Sustainability Development Goals (SDGs)……….…….. 49
3.2 Methods………..……. 52
3.3 Results………... 59
3.3.1 Heterogeneous Growth of Health Stock (1990-2015) ……… 59
3.3.2 Global Health-stock Forecasting (2016-2100)……… 65
3.4 Discussion……….….….. 71
3.5 Conclusion……….….……. 72
Chapter 4: Inequality of Health Stock and the Relation to National Wealth ………..……. 73
4.1 Background ………... 73
4.2 Methods………..………. 77
4.3 Results ………...……….. 80
4.3.1 Global Health Stock Inequality (1990-2015)………..………. 80
4.3.2 Regional and Income Group ………... 81
4.3.3 Association among Inequality and Other Statics………. 85
4.4 Discussion ………... 94
4.5 Conclusion ……….……. 97
Chapter 5: Conclusion and implications ……….. 98
5.1 Conclusions and policy implications ………..… 98
vi
References ………...102 Publications ………..……. 125 Acknowledgements………128
vii
LIST OF FIGURES
Figure 1.1 Inclusive Wealth Index and Sustainable Development Goals (SDGs)...………... 5
Figure 1.2 Framework of the Thesis ...……….... 21
Figure 2.1 Average of TFP for 140 countries (1990-2010)……….31
Figure 2.2 Mean TFP change, efficiency change, and technical change, 1990 to 2010……...34
Figure 2.3 Mean TFP change in six regions (1990-2010)………35
Figure 2.4 Before IW-TFP adjusted……….37
Figure 2.5 After IW-TFP adjusted………37
Figure 2.6 Before IWI adjusted………41
Figure 2.7 After IWI adjusted………..41
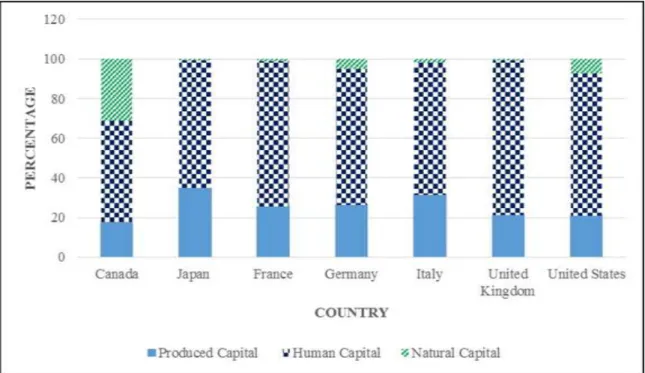
Figure 2.8 Percentage of wealth composition of G7 countries (1990-2010)………...45
Figure 2.9 TFP growth of the G7 countries……….46
Figure 3.1 Steps performed in the forecasting using the ARIMA model in the R programming language. ………... 58
Figure 3.2 Health-stock growth (1990–2015)………. 59
Figure 3.3 Average health-stock growth in six regions (1990–2015)……….… 62
Figure 3.4 Average health-stock growth by country income (1993–2015)……… 63
viii
Figure 3.6 Historical and forecasted health-stock growth by region (1990–2100) ………… 68
Figure 3.7 Health-stock growth by income region (1990–2100)……… 69
Figure 3.8 Health-stock, population and fertility growth by income region (1990–2100) … 70
Figure 4.1 Gini coefficient of health stock among 140 countries (1990 – 2015) ………..… 80
Figure 4.2 Gini coefficient categorized by income groups (1990 – 2015)……….. 84
Figure 4.3 Median percentage growth by regions and income groups (1990 – 2014) ………85
Figure 4.4 Scatterplot matrix median health stock, GDP and total inclusive wealth, 140 countries ………..………… 92
Figure 4.5 Relationship between health stock growth & log natural capital, 140 countries.. 92
Figure 4.6 Relationship between health stock and working-age population, 140 countries…93
Figure 4.7 Log of median growth of net income (firm-level), GDP, IWI and health stock, 43 countries (1990-2010) ………. 95
ix
LIST OF TABLES
Table 1.1 Component of inclusive wealth………....12
Table 2.1 Ranking and summary of estimated TFP……….32
Table 2.2 Means of TFP, efficiency change and technical change (1990-2010) based on regions………..35
Table 2.3 Results of IW-TFP adjusted per capita and percentage of change………..38
Table 2.4 Results after TFP adjusted per capita and percentage of change ……….42
Table 3.1 Data sources used to calculate the health stock ………..… 54
Table 3.2 ARIMA model (p, d, q) for each country ……….. 57
Table 3.3 Ranking of average health-stock growth in 140 countries between 1990-2015…..60
Table 3.4 Ranking & summary of the estimated forecast health-stock growth (1990–2100)..65
Table 4.1 Gini coefficient of health stock in 1990 and 2015, change over time by regions… 82 Table 4.2 Median percentage growth (%) (1990 – 2014) ……….. 83
Table 4.3 Summary of Pearson correlation between health stock with GDP, IWI, Produce Capital (PC), Human Capital (HC), Natural Capital (NC), life expectancy, fertility rate, mortality rate, population and working-age population ……….. 86
x
LIST OF ABBREVIATIONS
ACF Auto-Correlation Function
ANS Adjusted Net Saving
ARIMA Autoregressive Integrated Moving Average
GDP Gross Domestic Product
GNI Gross national income
GS Genuine Saving
HDI Human Development Index
HICs High-income countries
IW Inclusive Wealth
IWI Inclusive Wealth Index
IWR Inclusive Wealth Report
LAC Latin America and the Carribean
LICs Low-income countries
LMICs Low-and middle income countries
MENA Middle East and North Africa
OECD Organization for Economic Cooperation and Development
xi
SDGs Sustainable development goals
SEEA System of Environmental-Economics Accounts
SNA System of National Accounts
SSA Sub-Saharan Africa
TBL Triple Bottom Line
TFP Total factor productivity
UMICs Upper-middle income countries
UN United Nations
UNEP United Nations Environment Program
UNU-IHDP United Nations University’s International Human Dimension Program on
Global Environmental Change
VSL Value of statistical life
WAVES Wealth Accounting and the Valuation of Ecosystem Services (WAVES)
WCED World Commission on Environment and Development
WHO World Health Organization
1
CHAPTER 1
INTRODUCTION
1.1 Sustainability Measure
In an effort to achieve the SDGs, the 2030 Agenda for Sustainable Development was adopted by the United Nations (UN) General Assembly effective September 2015. These important goals range from responsible consumption and production, enhance well-being, provide quality education and health services to global asset protection, and including the stability of the oceans and climates. Once the government runs a program, there is a need to provide tools for continuous assessment and monitoring as a benchmark for its sustainability with the goals set (Dasgupta et al. 2015). Adherence to the requirements of preservation and maintain for the welfare guarantee can only be achieved through sustainable development, although it is undeniably a complicated thing to do.
According to Neumayer (2013), when it comes to the concept of sustainable development, there is a tendency for individuals to give different definitions based on the perspective and scope of their environment. He proposed an explanation for sustainable development economics by writing in his report, "development is sustainable if it does not reduce the capacity to provide non-declining per capita utility for infinity", and considers it a universal definition. In this case, the ability to meet the conditions of retention refers to "capacity"; capacity should not be translated directly as it will not convey a precise meaning in
2
this context. In order to provide and maintain a stable and booming future utility, it requires a sufficient amount of capital; as a result, the government of a country needs a certain amount of capital, which generally refers to stock or wealth. Among other scholars who has contributed to the body of knowledge was Arrow et al. (2013) who argued that sustainable development involves two alternative perspectives, specifically, the present generation and intergenerational being. This statement was in agreement with Mumford (2016) who stated that the well-being of today, tomorrow, and the next generation was represented and closely linked by the well-being of the intergenerational.
Scholars have given various definitions of the term "sustainable development", however, the World Commission on Environment and Development (WCED) provides a widely accepted definition of the world in a report published in 1987 entitled 'Our Common Future'. This report states that it is a noble and good idea to integrate a vision of achieving sustainable economic growth through business and high environmental quality (Liyanage, 2017). The report also defines sustainable development as a strategy “that meets the needs of the present generations without compromising the ability of future generations to meet their own needs”. Based on this definition, it can be concluded that a generation should only maximise profits in the best way without harming future generations; the generation transition will occur, and they are also expected to do the same for the next generation.
From the perspective of economists, they point out that through the use of GDP exclusively as indicators or measures of national sustainable development, the scope of measurement will be limited. It is undeniable that GDP is a good measure when it comes to economic activity, but everyone should be aware of the fact that GDP does not take into account social cost factors, in addition to environmental impact, and income inequality when assessing the economy (Costanza et al., 2014). However, all of these factors are embedded in sustainable development that clearly does not deny the involvement of the entire community, economy,
3
organisation, and individuals. Refining this alone is enough to give the connotation that the concept of sustainability is different from the optimal idea. Sustainability can be achieved through the creation and retention of wealth. Dasgupta et al. (2015a) in their study confirmed that the country's GDP did not contribute to the role of natural capital in production. Another opinion by Oleson (2011) was that GDP should be replaced by a more comprehensive tool or as a benchmark for studies of economic growth and well-being. Instead of using GDP, measuring instruments and indicators that replace it will produce more satisfactory, comprehensive results. Inclusive indicators will positively promote sustainable development because through them the quality of human life during life will be enhanced in the capacity of ecosystems that support development (Costanza et al., 2014).
In 1990, the United Nations first introduced the Human Development Index (HDI); through it, the quality of life can be measured more effectively. The initiative is aimed at raising concerns about the fading of GDP and the outlook for well-being beyond economic growth and income. HDI considers three key areas that significantly impact the quality of life. They are; first, the national health and quality of medical services. The second one is the quality of the education system, while the third is the current economic status. HDI is translated through the gross national income (GNI) per capita beginning in 2010 (Balcerzak & Pietrzak, 2017). Unfortunately, HDI has failed to become a comprehensive measure for studying sustainability, but it requires several other mechanisms to be used together. If they are well integrated, Sagar & Najam (1998) posited that the natural resources of accounting would be diminished due to their increasing ability to capture the sustainability dimension of human development. Indeed, sustainable development of a country cannot be financially based on GDP or HDI alone (Dasgupta, 2010).
Not long ago, recognising the need for more comprehensive and practical indicators, the agenda was streamlined by international organisations that allowed sustainability and
well-4
being measured by giving the environment more emphasis. Accordingly, the System of Environmental-Economic Accounts (SEEA) was developed by the UN since 1993. It strengthens the scope of the conventional System of National Accounts (SNA) system when the economic impact of environmental inputs such as natural resources and waste are included (Managi, 2015). The World Bank subsequently introduced the Adjusted Net Saving (ANS) measure later in 1998; through this approach, the World Bank invests in health, education, and the environment. The World Bank introduced Wealth Accounting and the Valuation of Ecosystem Services (WAVES) in 2012. A year later, the Green Growth indicator was added by the Organization for Economic Cooperation and Development (OECD), followed by the Inclusive Wealth Index (IWI) that introduced by United Nations Environment Program (UNEP) in 2012 and 2014.
Natural Capital is undoubted of importance when several economic reports speak of it. The involvement of natural capital in national income accounting enables wealth to be defined more comprehensively and broadly. In other words, all types of capital should be preserved for the sustainability of the economy and the country. This is acknowledged through actions taken on the basis of reports in 2012 and 2014 by the Stiglitz Commission (Stiglitz et al., 2009), the World Bank (World Bank, 2006) and the Inclusive Wealth Report by the United Nations University's International Human Dimension Program on Global Environmental Change (UNU-IHDP) and the UN Environment Program (UNEP). Through the measurement or indication of new sustainable development, other components of wealth among others are generated, human capital and natural capital are facelifted, and they are allowed more interactions to occur between them over time.
Wealth has historically been characterised as an inventory of capital produced such as buildings, machinery, as well as equipment, and infrastructure. According to the World Bank (2006) there is a strong relationship between wealth change and sustainable development in
5
economic theory. For example, if the nation’s wealth has been declining or deteriorating, it is not assumed that the country will develop a sustainable path. Nevertheless, in the reports by World Bank titled ‘Where is the Wealth of Nations in 2006’, ‘The Changing Wealth of Nations in 2011’and Inclusive Wealth Report in 2012, it can be concluded that interventions have expanded the definition of wealth through the incorporation of other specific assets into a wealth system. Such studies highlighted the importance of including natural capital in national income accounting as well as focusing on the theoretical foundation's economic welfare model. The calculation of prosperity and well-being is based on wealth shifts rather than economic growth and profits.
Figure 1.1 Inclusive Wealth Index and Sustainable Development Goals (SDGs)
Source: Urban Institute EvaCva-sustainable, Kyushu University, edited by the author.
Inclusive Wealth Index
Natural Capital
Human Capital
Produced Capital
Forest, Agricultural land, Fishery, Minerals, Ecosystem
service
Education, Health Equipment, machineries, road, among others In d ivid u al t arg et o f re lati n g main S DG s
6
In recognition about the need for sustainability calculation, the UNU-IHDP and UNEP (2014) used the concept of IW, which is the social value (not the dollar price) for all productive assets, and calculated well-being determinants. Sustainability can, therefore, be characterised as the positive change in human well-being, expressed by non-decreasing equitable wealth, referring to human capital, generated capital, and natural resources (see Figure 1.1). This approach provides a logically consistent wealth assessment as a key to measuring sustainability (Kurniawan and Managi, 2017).
1.2 Wealth, Well-being and Sustainability
Wealth commonly refers to the measure of the value of all assets or capital owned by an individual, community, company or nation. Earlier, Arrow et al. (2003) conducted research that proposed the IW framework. The theoretical framework of IW uses a social welfare theory to address multiple issues related to sustainable development. According to Arrow et al. (2003), an economy’s wealth is the worth of its capital assets; the list of assets include not only produced capital but also human capital (health, knowledge, and skills) and natural capital.
This framework emphasizes the importance of maintaining a particular asset-based, in addition to total capital asset or wealth. The researchers considered this framework as representing the nation’s productive-base to make a tangible measurement of a nation or government’s sustainable development. This framework provides information to policy makers about the perfect forms of capital investment should be directed toward sustaining an economy’s productive-base.
This framework highlights several important issues. First, it emphasizes the importance of environmental and natural ecosystem concerning in wealth accounting. Therefore, the country must make an effort to maintain non-declining welfare over time by taking into account
7
the natural capital in measuring a capital stock or wealth. Second, it indicates that population growth also has an impact on sustainability. Finally, it highlights both global responsibility and the effect that other nations have on the achievement of sustainable development worldwide.
Sustainability can be determined by non-declining IW, including human capital, produced capital, natural capital and all other types of capital which are sources of human well-being. This connotation is due to the fact that non-declining IW also implies the possibility of non-declining human well-being (Sato et al., 2015). Besides, sustainability is related to the chance of sustaining resources or wealth at a particular level. Therefore, the focal point of sustainable development should be on the flow instead of stock. Moreover, GDP alone is insufficient to measure sustainability because it is primarily an indicator of economic factors. As a result, it is crucial to develop a more comprehensive index that focuses not only on economic factors but also on environmental and societal factors, thus, complementing GDP.
Key to sustainability is the issue of non-declining well-being attributed to development. According to Dasgupta (2001), well-being refers to the quality of life, and all sources or stock that contribute to the quality of life should be considered as the sources of well-being. In the economic perspective, the types of stocks indicated in IW include production capital also known as human-made capital; physical capital; human capital; and natural capital. Dasgupta (2009) also described IW as wide dimension that encompassed social capital, knowledge (education), culture and time, all of which contributed to the productive well-being of individuals and nations.
According to Wiersum (1995) the concept of sustainability at earlier has been accepted in the studied of forestry since the 18th century. This implied that at that time, there was never
happened over-harvest, more than the actual forest produces in new growth. The word sustainability is rooted in the term of ‘nachhaltigkeit’ which is literally a German term for
8
durability that first used this meaning in 1713 (Kuhlman and Farrington, 2010; Wiersum, 1995). Meanwhile, there is an argument by Jeronen (2013) who holds that sustainability is a word derived from Latin sustinere (tenere, to hold; sus, up). Currently, the term sustainability is in line with Standard English, which means that the ability or possibility of a particular item is supported. The concept of sustainability has long been practised but may use different terms due to its development, supported by a long history (Kidd, 1992). Most likely the use of the word 'sustainability' began in 1972, it was written in a book entitled Blueprint for Survival that elaborated about the context of human future; as a result, the normative concept becomes more prominent.
However, the concept of sustainability cannot escape its complexity as it refers to everything needed in an effort to maintain or protect something for the sake of sustainability and well-being. Well-being and welfare are often used together. Welfare, based on UNECE, OECD, and Eurostat (2008), is a benefit that one receives after using certain goods and services over some time. In other words, it is the current value of the utility's future discount. The amount that results from measuring usage that represents all members of society is known as social welfare. Economists have said this from a different perspective that consumption will produce mainly interested in the well-being. This concept of use encompasses the enjoyment of goods or services that contribute to well-being, as well as taking into account free products such as forest products and other natural resources. Sustainability, on the one hand, can be considered a multi-faceted or three-dimensional concept known as the "Triple Bottom Line" (TBL) that is environmentally, economically and socially (Choi & Gray, 2008; Weidinger, Fischler, & Schmidpeter, 2014). Sustainable development and global sustainability are very close. Though complicated, however, over the centuries, every generation has strived to bring about sustainable development with their own perspective. The concepts and principles of sustainable development have taken their place in world development and development as early
9
as 1987. They are inspired by the Brundtland report titled Our Common Future by World Commission on Economic Development (WCED). The report literally defines sustainable development as:
“Development which meet the needs of the present without compromising the ability of future generations to meet their own needs (WCED, 1987)”.
Environmental, economic, and equity principles, based on WCED requirements, need to be implemented simultaneously for sustainable development to take place. They influence the well-being of many generations including the present and future generations. Therefore, it is essential to manage the diversification of capital assets by implementing a productive economic base without compromising the environment but in the end, as the ultimate goal is to provide human welfare.
In macro perspective, when policymakers make any proposals regarding sustainable development, as Pezzey (1992) points out, it is a natural fit for them to take into account essential concepts of the relationship and dependence between economics and the environment. The role of this concept was so dramatic and dramatic that it brought about a clash of ideas and opinions called “Limits to Growth” in the early 1970s. At the same time, many scholars began to open their minds and minds on the importance of sustainable development, especially after recognising the fact that human well-being could be maintained without denying world development. Arrow et al. (2012) explore two alternative formulations of the well-being of the present generation and the well-being of the current generation. By definition, welfare according to Neumayer (2004) is a virtue or utility that satisfies human satisfaction. Satisfaction will also determine the level of human well-being in which the relationship
10
between these two elements is positive and significant. Achievement of well-being is driven by good use and good relations with the environment. The environment is an essential factor in this case because all people are aware of this fact that human reliance on the environment or natural resources is critical, so it must be considered in every developmental decision-making process.
Several researchers have studied the importance of the environment, the changes in the environment, whether positive or negative, and its impact on human well-being. As explained earlier, in addition to the current generation, well-being also directly affects future generations because the continuation of the generation will occur naturally. So both generations are considered as far as sustainability is concerned about using prudent capital including natural capital. Brundtland reports on productivity measurement, but measurement methods are not described in detail (Holden, Linnerud, and Banister, 2014). As a result, GDP is still considered relevant by some countries in assessing the level of human well-being. It is undeniable that GDP is a reflection of economic activity, but on the other hand, GDP fails to take into account social costs, environmental impacts, and income inequality when assessing. The neglect of the use of several factors has led to the use of methods other than GDP, as suggested byOleson (2011). More comprehensive and inclusive new indicators need to be developed to promote sustainable development, which supports the development of quality of human life while living in a favourable ecosystem (Costanza et al., 2014).
In a country level, sustainable economic development is determined by using Genuine Saving (GS) as a critical economic indicator. Unofficially, Hamilton (1994) and Pearce, Hamilton, and Atkinson (1996) provide a brief definition of GS; before being converted to Inclusive Wealth, among other names leading to GS connotations, according to Hanley, Dupuy, and Mclaughlin (2014) were Adjusted Net Savings, and Comprehensive Investment.
11
1.3 Previous Application Review
To measure the progress of the wellness framework by stakeholders, many scholars have studied this field. Among others Polasky et al., 2015; Sato, Tanaka, and Managi, 2018; in addition to Tokimatsu, Dupuy, and Hanley, 2019; as well as Yamaguchi, Islam, and Managi, 2019), does not deny that IW, also known as GS, is a consistent theory. For some researchers, their research was conducted taking into account two other factors, namely market and non-market assets of all types of capital, which significantly affected the welfare level (Dasgupta, 2014; Duraiappah and Muñoz, 2012; Ikeda, Tamaki, Nakamura, and Managi, 2017; Kurniawan and Managi, 2018; Managi and Kumar, 2018). In terms of cross-country research, the use of IW enables administrators to identify regional wealth levels and assess sustainable development. For instance, following the tsunami that led to the massive destruction of Japan, Yamaguchi, Sato, and Ueta (2016) have measured the country's sustainability. Other researchers also conducted studies in the context of post-disaster sustainability such as Acar and Gultekin-Karakas (2016) measured Turkey’s sustainability development, Mota, Domingos, and Martins (2010) in Portugal, as well as Ollivier and Giraud (2010) assessed the sustainability for Madagascar. Based on these studies, it is found that they use indicators closely related to IW, making them useful indicators of sustainability context (Yamaguchi and Managi, 2017).
Productive well-being is assessed by approaches that take into account capital. In this regard, inter-generational well-being should not be underestimated as it is an essential element in the study of sustainable development. Shadow price represents the element to address the issue of economic growth more clearly, where it should always increase or stabilise without decline; this is because IW has a positive relationship with human well-being. The three main
12
components of the physical, human and natural capitals are based on the shadow price balance sheet, as stated in the Inclusive Wealth Report (2012, 2014).
Among the three, reliable and most complete data can be obtained by refining the physical capital of which the elements contained are among others equipment, machinery, and roads, as well as include produced capital. According to Arrow et al. (2012), human capital encompasses additional educational achievement and compensation functions over time. The third component of natural capital is the fossil fuels (oil, coal, natural gas), minerals (nickel, gold, silver, iron, lead, tin, zinc, phosphate, copper, bauxite), in addition to forest resources (wood and non-wood), and agricultural land (cropland and pasture land). The BP Statistical Review of World Energy (BP, 2013) is a reference to industry players, especially in terms of fuel prices such as coal, natural gas, and oil. However, the researcher of the present study focused on GDP as output. Capital assets are divided into three categories: physical capital (PC), human capital (HC) and natural capital (NC) that represent specific factors, while 2005 million US $ million is based on capital asset calculations.
Table 1.1: Component of Inclusive Wealth
Capital Note Variables Data Sources
Produced (PC)
Also known as physical and manufactured capital.
Method develop by (King and Levine, 1994)
Perpetual Inventory Method (PIM)
Investment United Nations Statistics Division (2016)
Output United Nations Statistics Division (2016)
Depreciation rate Feenstra et al. (2016) Output Growth (GDP) United Nations Statistics
Division (2016)
Population United Nations
Population Division (2015)
Human (HC)
Arrow et al. (2012), who based their method upon (Knowles and Owen, 1995).
Population by age and gender
United Nations
Population Division (2015)
Mortality probability by age and gender
World Health
Organization (2016) Discount rate It is assumed a rate of 8.5
percent
Employment International Labor
13
Conference Board (2016) Educational attainment http://www.barrolee.com/
Barro and Lee (2016), Samir KC & Lutz W (2017) Employment compensation OECD (2016) Feenstra et al. (2016) Lenzen et al (2016) Labor force by age and
gender
International Labor Organization (ILO) Fossil fuels
(NC)
Including oil, natural gas, and coal.
Reserves U.S Energy Information Administration (2015) Production U.S Energy Information
Administration (2015)
Price BP (2015)
Rental rate Narayanan et al (2012) Minerals
(NC)
10 mineral which is including bauxite, copper, gold, iron, lead, nickel, phosphate, silver, tin, and zinc.
Reserves U.S Geological Survey
(2015)
Production U.S Geological Survey (2015)
Prices U.S Geological Survey
(2015)
Rental rate Narayanan et al. (2012) Forest
resources (NC)
Represent timber and non-timber benefits. Non-timber forest
products (NTFPs)
Forest stock Food and Agricultural Organization (FAO 2015), every 5 years. Forest stock commercial Food and Agricultural
Organization (FAO 2006) Wood production Food and Agricultural
Organization (FAO 2015) Value of wood production Food and Agricultural
Organization (FAO 2015) Forest area Food and Agricultural
Organization (FAO 2015) Rental rate Bolt el. al (2002)
Agricultural Agricultural lands like wind breaks, shelter belts, abandoned areas of shifting cultivation, and corridors of trees. Excludes trees
established with the primary purpose of agricultural production, horticultural and agroforestry system.
Quantity of crops produced Food and Agricultural Organization (FAO 2015) Price of crops produced Food and Agricultural
Organization (FAO 2015) Rental rate Narayanan et al. (2012) Harvested area in crops Food and Agricultural
Organization (FAO 2015) Discount rate It assumed a rate of 5
percent. Permanent pastureland
area
Food and Agricultural Organization (FAO 2015) Permanent crops land area Food and Agricultural
Organization (FAO 2015) Source: UNU-IHDP and UNEP (2014), edited by the author.
14
Prosperity and wealth of the country can be determined by the wealth of capital and assets it possesses. Various types of national capital assets, when properly integrated and managed, will form the basis of national productivity. These productive forms, from another perspective, will be the basis for sustainable development driven by the sustainability of the productive forms, as well as a benchmark for stakeholders, in this case especially the government, to continuously enrich, monitor and track state-owned assets. IWR 2014 and IWR 2018 further elaborate on the theories, methods and calculations related to the topics discussed earlier.
1.3 Health and Sustainable Development Goals (SDGs)
Fifty-four years ago, Kenneth Arrow published "Uncertainty and the welfare economics of medical care” in the American Economic Review. This paper became the most popular and widely cited not only in the field of health economics but also a source of reference in other areas. In that paper, Arrow (1963) specified that medical care was different from other themes in financial and the researcher promoted the health economy as a discipline. Since health economics is a rapidly expanding field, measuring human well-being by considering health as an indicator has been widely accepted in economics.
People acknowledge that health is significant in daily life, and it can be considered as the main factor in the level of contentment. In the year 1972, noted that the increment in people’s stock of knowledge or human capital contributed to the increment in their productivity in the market sector of the economy. Grossman (1999) also stated that health capital was different from other forms of human capital. This is especially true because people’s stock knowledge affects their market and nonmarket productivity levels, while their stock of health will determine the time they can spend to generate more earnings and commodities. According
15
to this idea, health can be treated both as consumption and an investment of good consumption. For instance, health makes people feel better and at the same time, increases the number of productive days to work and earn incomes.
On 25 September 2015, the 17 SDGs of the 2030 Agenda for Sustainable Development were adopted by world leaders in the United Nations General Assembly. The new agenda and goals ranging from putting an end to poverty, improvement in well-being, the quality education, environmental and climate change to economic growth and also focusing on SDG 3 (to ensure a healthy life and promote well-being for all regardless of ages). As such, the additional resources must come together into a unit to strengthen a comprehensive health service delivery towards the attainment of SDG 3 and universal health coverage especially to low-income and middle-income countries (Stenberg et al., 2017). However, Sankoh (2017) asserted that without reliable population based data, the need to establish SDGs became more noteworthy. For instance, the difficulties to generate data for low-and middle-income countries (LMICs) will make it difficult to determine, track, design, implement and fine-tune the policies and programmes needed to achieve the SDGs. A study by Lassi et al. (2016) justified that reducing maternal mortality and improving maternal health will achieve SDGs, especially in LMICs.
1.5 Inclusive Wealth and Health Stock
In our daily life, health is vital and can be considered as the primary contributor to our happiness. Therefore, by measuring health stock as part of human capital can serve on the ways it relates to the economic, productivity and long-term sustainability and development of the nations. A study by Barro (1991, 1996); Kareem et al. (2017); Mankiw, Romer, and Weil (2014) and Solow (1956) indicated that human capital in term of health and education were significant to the economic growth. Bloom and Canning (2008) posited that health could affect
16
income, labour productivity, children’s education, saving and investment, demographic structure, development and economic growth. Anand and Sen (2000) explained that improving the health, education, and nutrition was not only crucial in enhancing the capabilities that led to more fulfilling lives but also important in increasing the economic and sustainability of human capital.
In recent years, many organizations and researchers have taken steps to produce more inclusive measures of the health stock as a part of human capital. These measures have been developed to serve different analytic purposes, and they typically relied on a variety of approaches (Boarini and Liu, 2012). For instance, Schultz (1961) claimed that education, internal migration to take advantage of better job opportunities and health were variables that needed to be considered when it came to forming a human capital; Mushkin (1962) opined that the labour productivity increased was resulting from higher education or escalating health programs; Grossman (1972) also believed that education and health are parts of a human or durable capital stock that produced an output of healthy time; in an agreement with this statement, Becker (2007) posited that health especially mortality rates, quality of health and the statistical value of life were essential and must be considered as parts of the measurement indicators of human capital. Recently, Arrow et al. (2012) suggested for the total value of health stock to be included in human capital to be measured by the entire discounted years of life expectancy for each group in the country's population.
Recently, several researchers treated health as a form of human capital or a capital asset. Even though health suitable is arguable as an input of production function, however, is the researchers have common understanding that health needs to be considered in measuring human well-being and achieving the objectives of sustainable development. For instance, in the Inclusive Wealth Report 2012 (IWR 2012) published by United Nations (UN) University's International Human Dimension Programme on Global Environmental Change (UNU-IHDP)
17
and the UN Environment Programme (UNEP) treated health as a form of wealth by estimating the value of the improvement in life expectancy over a nineteen-year period from the year 1990 to 2008. However, in that report, they considered health capital as a separate entity from other forms of capital. To calculate health stock, the method that has been proposed by Arrow et al. (2012) was used and extended the data of 20 countries to 140 countries from the year 1990 to 2015.
On the other hand, forecasting is one of the initial steps in planning, and many plans depend on the prediction. The SDGs also need a plan and estimation in order to be achieved the objectives. Projection or forecasting is utilised for many purposes; one of them is to plan future health affairs. Concerns about health and its long-term sustainability have stimulated the development of health forecasting including also the measurement and forecast of health stock as a part of human capital. Health is not only a vital component of an individual’s welfare and standard of living, but it is also a sound investment that increases the future productive power of individuals, country and the economy. For instance, a study by Barro (1991, 1996); Kareem et al. (2017); Mankiw, Romer, and Weil (2014) and Solow (1956) indicated that human capital in term of health and education was significant to the economic growth. Bear a resemblance to the researchers, Bloom and Canning (2008) posited that health could affect income, labour productivity, children's education, saving and investment, demographic structure, development and the economic growth.
Similarly, Anand and Sen (2000) argued that by improving the health, education, and nutrition is not only crucial in enhancing the capabilities to lead more fulfilling lives but also important in increasing the economic and sustainability of human capital. Likewise, Kjærgård, Land, and Pedersen (2013) attested that the simultaneous deterioration of public health and the state of the environment is partly linked to the inadequate integration of health promotion and sustainability dimensions between local, regional and global levels. In addition, in the IWI also
18
comprehensively evaluates the wealth of human capital stock, including health status and happiness, as an essential proxy for welfare (Ikeda et al., 2017). Thus, health stock or stock of health capital is also needed to be forecasted particularly to achieve the SDGs 3 that have been focusing on the healthy living and wellbeing.
Health forecasting is a new area of prediction, such as demands for health services and healthcare needs (Soyiri and Reidpath, 2013). Concerns about health care expenditure growth and its long-term sustainability have risen to the top of the policy agenda in many countries to launch forecasting projects to support policy planning. It is also increasingly recognized as a valuable tool to facilitate health service provision and resource allocation (Villani et al., 2017a). Soyiri and Reidpath (2013) set forth that health forecasting was often embedded on time series, a sequence of data points collected at successive, equally spaced time intervals which may be characterized by trend, seasonality, cyclicality, and randomness. The authors also testified that monitoring population health, which included demographic and health surveillance and epidemiological studies on disease surveillance can generate useful data in health forecasting. Thus, forecasting of health stock or stock of health capital can be considered as part of health forecasting; in the health capital model, health is treated as a stock that provides direct utility (Galamaa & Kippersluis, 2013).
The decline in global and between-country health inequality has been a significant challenge to be overcome completely. However, limited studies have systematically investigated the relationship between inequality of health stock and national wealth (both GDP and IWI) and net income at the firm-level analysis. Understanding the relationship between health, national wealth, and firm-level analysis provides an essential policy implication and stimulates sustainable development because health and economic gains are closely intertwined. Moreover, health is both a beneficiary and a prerequisite for sustainable development (World
19
Health Organization, 2002). A better understanding of health stock and its inequality will help in shaping policies to attain SDG 3 and SDG 10 to reduce inequalities.
1.6 Health Stock and Inequality
Thus, in an effort to explain trends in global health stock and inequality, this study focused on the time-series pattern of the health stock of 140 countries from the year 1990 to 2100. At first, the measurement of the health stock index was subjected to the method proposed by Arrow et al. (2012); however, this study extended the period; from the year 1990 to 2015. Furthermore, based on the historical trends of health stock that have been measured, forecasting of future values was done by using Autoregressive Integrated Moving Average (ARIMA) or also known as the Box-Jenkins model. The future time series were collected from the year 2016 to 2100. The trend components values of time series and demographic data projected by the United Nations (UN) demonstrate the growth pattern of health stock, income and health inequality of 140 countries. As a conclusion, this study focused on forecasting health stock, monitored global health and investigated the relationship between inequality of health stock and national wealth (both GDP and IWI) and net income at the firm-level analysis.
1.7 Objectives and Contributions
The IWI was introduced as a new indicator of sustainability and well-being. IWI undoubtedly stood out as one of the most promising endeavours among recent high-profile new indicators of sustainability and well-being (Roman & Thiry, 2016). In the framework of IWI, at the minimum, sustainability requires the simultaneous preservation not only in produced capital related to manufactural assets such as roads and machines, but also natural capital involving forest and fossil fuels and human capital covering education and health
20
(Balasubramanian, 2018). By considering these inputs, the researcher analyse how countries differ with respect to the effective utilisation of their productive assets. Based on this study can understand why the same productive base of a country could lead to an increase or decrease in aggregate output over time depending on productivity changes as a result of the ways resources are used. Some countries use their endowed capital efficiently with appropriate productivity changes and future-oriented stock consumption schemes, while others do not use their capital as efficiently as they should.
In the existing economic perspective, health is perceived as a category of capital stock that yields ‘healthy days’ in the society. Accounting for health as a capital stock can be measured using a method initiated by (Arrow et al., 2012). The amount of health stock can be measured by the total discounted years of life expectancy in a country’s population. This indicates the need to measure health stock to determine trends in global inequalities in health. Nevertheless, the study in the area of health capital stock are still limited to certain contexts only. This study aims to measure as well as forecast the health stocks in 140 participating countries from year 1990 to 2100. The health capital stock in every country from year 1990 to 2015 was projected using a capital approach. The future health stocks in the year 2016 and 2100 were forecasted by using a time-series model.
This study also estimate global and compare between countries inequalities in length of health stock for 140 countries from 1990 to 2015 and investigate the relationship between countries inequalities of heath stock with national wealth. National wealth in this study not only GDP, but also use firm net income and the latest indicators to measure sustainability and well-being which is known as IWI. To achieve these objectives, this research employ several quantitative approaches, including the application of IW framework as sustainability measures and combined the framework with the statistical technique.
21
In this research, to measure the national health capital stock in global perspective, a method as proposed by Arrow et al.(2012) is used to measure health stock for 140 countries from 1990 to 2015. This measurement covers more countries and time-span than in Inclusive Wealth Report 2012. Then, based on the previously measured historical health-stock data, the future health stocks between 2016 and 2100 were forecast using a time-series model. Based on the health stock data from 1990 to 2015, global and regional health inequalities in health stock were measured using the Gini Index. Further, the country’s GDP, IWI and firms’ net income used to examine the association between the health stock and national wealth.
1.5 Thesis Overview
Figure 1.2 Framework of the Thesis CHAPTER 1
Introduction
CHAPTER 2
Sustainability, Productivity and Inclusive Wealth
CHAPTER 4
Inequality of Health Stock and the Relation to National Wealth CHAPTER 3
Heterogeneous Global Health Stock and Growth: Quantitative
Evidence from 140 Countries, 1990 - 2100
CHAPTER 5
22
This thesis is divided into 5 chapter and organized as follows. Chapter 1 entails the background and objectives of the study. Sustainability, IW and focusing on health stock are explained in Chapter 2. Chapter 3 depicts the health stock results from 140 countries from 1990 to 2015, forecasting trends from 2016 to 2100 and discussion on the implications for achieving sustainable society from the heterogeneous health stock condition. Extending the framework of health stock and utilizing global dataset, 140 countries, Chapter 4 presents global and comparison between countries inequalities in length of health stock for 140 countries from 1990 to 2015. Furthermore, Chapter 4 also investigate the relationship between countries inequalities of health stock and national wealth. National wealth in this study includes GDP and also firms’ net income IW. Finally, Chapter 5 draws the conclusion and suggestions to extend this research. The framework of this thesis is provided in Figure 1.2.
23
CHAPTER 2
SUSTAINABILITY, PRODUCTIVITY AND INCLUSIVE WEALTH
2.1 Introduction
Published by the WCED in the year 1987, the Brundtland Commission Report rendered the term “sustainable development” to be commonplace. That report entitled “Our Common Future” defines sustainable development as “development that meets the needs of the present without compromising the ability of future generations to meet their own needs” (WCED, 1987). This definition implies that regardless of development and its objectives, it is essential to ensure that the next generation is able to fulfil its own needs and obtain wealth at least to the extent enjoyed by the previous generation.
A lot of theoretical work and several studies have demonstrated that sustainable development required non-declining per capita wealth; wealth is defined to include produced, natural, human and social capital. According to Arrow et al. (2012), wealth is intuitive that an economy's productive base comprises the entire range of capital assets to which people have access. Wealth not only includes reproducible capital goods (roads, buildings, machinery and equipment), human capital (health, education, skills), and natural capital (ecosystems, minerals and fossil fuels); but also population (size and demographic profile), public knowledge, and the myriad of formal and informal institutions that influence the allocation of resources.
24
Pearce and Atkinson (1993) proposed the movement of wealth that satisfactory for the measurement of sustainable development. The researchers defined sustainable development as an economic path along which wealth did not decline. Hamilton (1994) certified that the greener measures of wealth per capita and savings rates were more relevance to measure the progress towards sustainable development and adjustments to national product. However, the previous definition was not initiated on the more fundamental notions of intergenerational well-being. In a study by Dasgupta and Mäler (2000), they identified the relationship between wealth and changes in intergenerational well-being independently by assuming a constant in population and total factor productivity (TFP). Coincide with them, Hamilton and Clemens (1999) declared that at a full optimum intergenerational well-being increased at a date (t) if and only if comprehensive wealth increase at (t). In addition to their theoretical finding, Hamilton and Clemens extended the empirical work in World Bank (1997) by constructing an improved set of estimates of comprehensive investment. This extensive investment was also known as Genuine Saving (Arrow, Dasgupta, and Mäler, 2003).
2.2 Inclusive Wealth Measurement
The aggregated capital is a term for inclusive investment, a key indicator of IW. According to Arrow et al. (2003), an economy enjoys sustainable development if and only if its IW is at constant price or does not decline relative to its population. IW is a measure of intergenerational well-being, where the accumulation of wealth corresponds to sustained development and is a key to economic progress (Dasgupta, 2007). Thus, we can define IW at the time (t) as Wt that includes produced, human, and natural capital. This can be defined as:
25
where Q(t) is the shadow price of the time asset (TFP in our case). Each P is a shadow price of the capital asset, defined as δWt/δC, where K is each capital which is PC(t), HC(t) and NC(t)
representing produced capital, human capital and natural capital at time t, respectively. Therefore, the total capital asset is its quantity multiplied by the present value of the flow of social benefits’ extra unit that would be able to be generated over time. This present value is called an asset's shadow price. Hence, an economy’s IW is the shadow value of its productive base, and inclusive investment, 𝐼𝑊(𝑡), is the shadow value of the net change in its productive base (Dasgupta, 2008). All capitals are evaluated on the basis of each of their own accounting prices in the current period. The IW should be positive and contrast from recorded investment; thus, the sustainability condition can be expressed as:
𝑰𝑾(𝒕) ≥ 𝟎 for all t (time)
2.3 TFP Measurement
To measure cross-country productivity, we adopt the Malmquist Productivity Index (MPI) as described by Coelli, Rao, and Battese (1998) and Färe et al. (1994) as a measurement of TFP, to investigate if there is any change in wealth by mapping capital assets (human capital, produced capital and natural capital). This is because the MPI is suitable for assessing the relationship between inputs and outputs under the multivariate input inefficiency. By using the MPI, technological progress and the inefficiency of resource use also can be estimated. Therefore, MPI can be considered as the most suitable index to achieve the objectives of this research.
When calculating TFP, we applied produced, human and natural capital as a separate unit, each capital as an input and GDP as an output. Because of the multivariate inputs – which
26
are, produced, human and natural capital – we adopted the non-parametric frontier analysis of Data Envelopment Analysis (DEA) to measure TFP. By using the distance function specification, our problem can be formulated as follows:
𝑻(𝒕) ≡ {(𝒙𝒕, 𝒚𝒕): 𝒙𝒕 𝒄𝒂𝒏 𝒑𝒓𝒐𝒅𝒖𝒄𝒆 𝒚𝒕} (1)
In this case, 𝒙 = (𝒙𝟏, … 𝒙𝑴) ∈ 𝑹+𝑴 and 𝒚 = (𝒚𝟏, … 𝒚𝑵) ∈ 𝑹+𝑵 are the input and output
vectors, respectively. The technology set is defined by equation (2), which consists of all feasible input vectors, xt and output vectors, yt, at time t. According to Managi (2011), the
estimation of efficiency relative to the production frontiers relies on the theory of distance or gauge functions. In economics, distance functions are related to the notion of the coefficient of resources utilization (Debreu, 1951) and to efficiency measures (Farrell, 1957). This distance function defined t as:
𝒅𝒕(𝒚
𝒕, 𝒙𝒕) = 𝒎𝒊𝒏{𝜹: (𝒙𝒕, 𝒚𝒕/𝜹) ∈ 𝑻(𝒕)} (2)
Where 𝛿 is the maximal proportional amount to which 𝑦𝑡 can be expanded given technology T(t). Data Envelopment Analysis (DEA) and the output-oriented function are used to estimate the distance function under constant returns to scale (CRS) by solving the following optimization problem (Managi, 2003):
𝒅𝑻(𝒕)(𝒙𝒕, 𝒚𝒕) = 𝒎𝒂𝒙𝜹,𝝀𝜹
𝒔. 𝒕 𝒀𝒕𝝀 ≥𝒚𝒊𝒕 𝜹
𝑿𝒕𝝀 ≤ 𝒙𝒊𝒕
27
From formula (3), 𝛿 is the measure of efficiency for country i in year t. 𝜆 is an N x 1 vector of weights, and 𝑌𝑡 and inputs 𝑋𝑡 are the vectors of outputs 𝑦𝑡 and inputs 𝑥𝑡. To estimate productivity over time, several distance functions are used for the input-output vector for period 𝑡 + 1 and technology in period 𝑡. The MPI (𝑀0) for the output-oriented productivity index is as follows: 𝑴𝟎(𝒚𝒕, 𝒙𝒕, 𝒚𝒕+𝟏, 𝒙𝒕+𝟏) = [ 𝒅𝒐𝒕(𝒚𝒕+𝟏,𝒙𝒕+𝟏) 𝒅𝒐𝒕(𝒚𝒕,𝒙𝒕) × 𝒅𝒐𝒕+𝟏(𝒚𝒕+𝟏,𝒙𝒕+𝟏) 𝒅𝒐𝒕+𝟏(𝒚𝒕,𝒙𝒕) ] 𝟏 𝟐 (4)
In formula (4), d represents the geometric distance to the frontier, which can be decomposed into efficiency change (i.e., catching up to the frontier) and technological change (i.e., change in the production frontier) (Färe et al., 1994). Based on this formula, a country on the frontier will perform better under the same resource constraints than a country that is further away from the frontier. The estimation of this is performed by using DEA, which is a non-parametric estimation method. 𝑀0 can be divided into two components. First, efficiency change represents the first ratio, while technological changes represent the second. Based on this formulation, we estimate the MPI and estimated IW as follows:
𝒇: { 𝑷𝑷𝑪𝑷𝑪, 𝑷𝑯𝑪𝑯𝑪, 𝑷𝑵𝑪𝑵𝑪} Inclusive wealth (IW) (5)
In this estimation, it is possible for two countries to have different levels of sustainable development even if they have a similar level of capital assets. This is due to the fact that sustainable development is dependent not only on how the countries use their capital assets, but also on their different saving rates. The MPI is reformulated as follows:
28 𝑴𝟎(𝑮𝑫𝑷𝒊,𝒕, 𝑷𝑪𝒊,𝒕, 𝑯𝑪𝒊,𝒕, 𝑵𝑪𝒊,𝒕, 𝑮𝑫𝑷𝒊,𝒕+𝟏, 𝑷𝑪𝒊,𝒕+𝟏, 𝑯𝑪𝒊,𝒕+𝟏, 𝑵𝑪𝒊,𝒕+𝟏) = [𝒅𝒕(𝑮𝑫𝑷𝒊,𝒕,𝑷𝑪𝒊,𝒕+𝟏,𝑯𝑪𝒊,𝒕+𝟏,𝑵𝑪𝒊,𝒕+𝟏) 𝒅𝒕(𝑮𝑫𝑷 𝒊,𝒕,𝑷𝑪𝒊,𝒕,𝑯𝑪𝒊,𝒕,𝑵𝑪𝒊,𝒕) × 𝒅𝒕+𝟏(𝑮𝑫𝑷𝒊,𝒕+𝟏,𝑷𝑪𝒊,𝒕+𝟏,𝑯𝑪𝒊,𝒕+𝟏,𝑵𝑪𝒊,𝒕+𝟏) 𝒅𝒕+𝟏(𝑮𝑫𝑷 𝒊,𝒕,𝑷𝑪𝒊,𝒕,𝑯𝑪𝒊,𝒕,𝑵𝑪𝒊,𝒕) ] 𝟏 𝟐 (6)
The equation above indicates the feasibility of producing goods with fewer inputs. Where d is the geometric distance to the production frontier, it represents the best available technology for the given inputs and output. The country under analysis in this research refers to i, which runs from 1 to 140 countries in our sample. GDP is the corresponding value of the gross domestic product; PC stands for produced capital; HC represents human capital and NC stands for natural capital. This index is measured by the ratio between two years; thus, a value greater than one represents an improvement or otherwise in the TFP calculation. Using this index allows us to examine TFP’s contribution to IW by country.
2.3 Inclusive Wealth Adjusted by TFP Measurement
By using the new TFP results and based on the IW methodology, we estimated each country’s Inclusive Wealth-TFP Adjusted (IW-TFP Adjusted) for the year 1990-2010. We did so by using the annual average of IW per capita and estimated the percentage change of TFP on the IW as the sustainability indicator. In order to estimate the IW-TFP Adjusted, we calculated the growth rate of IW per capita. We also followed the same process as done by Arrow et al. (2004) with the compromise of the use of TFP growth from Collins and Bosworth (1996) which was based on GDP output. According to the framework of sustainable development, the IW-TFP Adjusted should be maintained at a positive and non-declining state. The calculation is as follows:
29
IW~TFP Adjusted Inclusive Wealth Adjusted with TFP
IW Inclusive Wealth growth per capita
TFP TFP growth
Based on the TFP results from 1990 to 2010, we measured not only IWI-TFP Adjusted, but also how countries’ performance affected IW after three main factors were taken into consideration. Those three factors are as follows: (1) climate change, particularly the damage suffered as the result of increased atmospheric carbon; (2) TFP’s contribution to multiple factors missing from economic growth; and (3) oil-capital gains related to the change in oil prices, which may either increase or decrease the country’s productivity value.
Based on the 2012 and 2014 Inclusive Wealth Report, we refer to this adjusted figure as the Inclusive Wealth Index Adjusted (IWI Adjusted). We measured the change in wealth for 140 countries over 21 years on a per capita basis. To estimate the change in wealth, we calculated the average annual growth rates in wealth and population. According to the framework of sustainable development, the IWI-Adjusted should remain positive and non-declining. The calculation is as follows:
𝑰𝑾𝑰~𝑨𝒅𝒋𝒖𝒔𝒕𝒆𝒅 = 𝑰𝑾 + 𝑪 + 𝑬 + 𝑻𝑭𝑷
Where:
IWI~Adjusted Inclusive Wealth Index Adjusted
IW Inclusive Wealth per capita
30
E Energy depletion, i.e., oil-capital gain
TFP Percentage of TFP growth
Based on the adjustment set forth above, the IWI-Adjusted can have either a positive or a negative effect on countries’ IW. According to Nordhaus and Boyer (2000), climate change will benefit some countries, whereas others will experience a negative impact. In terms of oil-price fluctuations, normally countries that are considered as oil producers will realize the advantages and positive changes in wealth compared to countries that depend on oil imports.
2.4 Data
For the sources of these data, we refer to the 2014 Inclusive Wealth Report published by UNU-IHDP and UNEP. This dataset provides quantitative information on data for 140 countries from 1990 to 2010. As noted above, the accounting shadow balance sheet included as inputs here consists of not only produced capital (PC) and human capital (HC), but also natural capital (NC). To measure NC wealth, fossil fuels (oil, coal, and natural gas), minerals (nickel, gold, silver, iron, lead, tin, zinc, phosphate, copper, and bauxite), forest resources (timber and non-timber) and agricultural land (cropland and pastureland) are used. For HC wealth, the calculation uses education attainment and the additional compensation over time as developed by Arrow et al. (2012). The BP Statistical Review of World Energy (BP, 2013) is used for the price of coal, natural gas, and oil. Equipment, machinery, and road data are calculated for PC. In this research, we utilized GDP as an output. All capital wealth in this calculation is in million, constant 2005 US$.
31
2.5 Empirical Results
2.5.1 Total Factor Productivity (TFP)
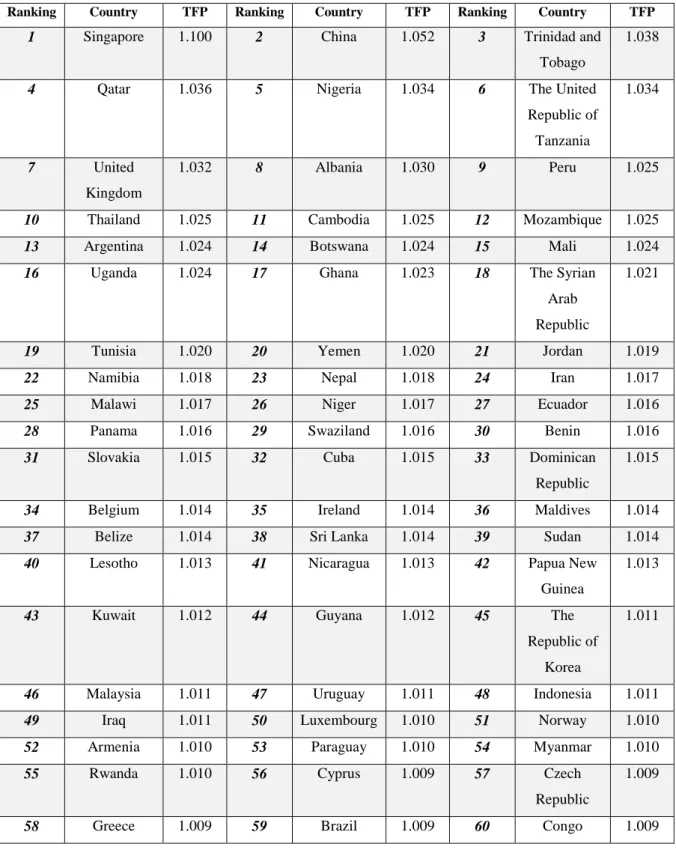
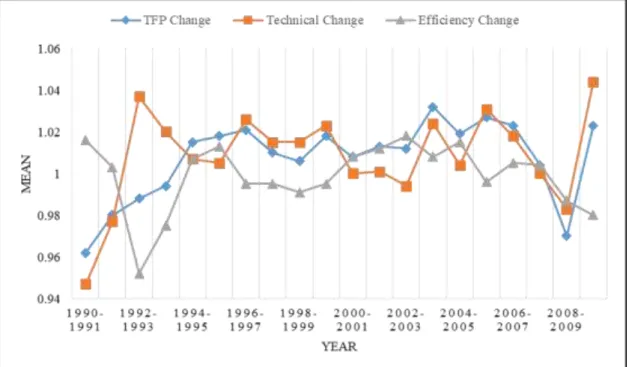
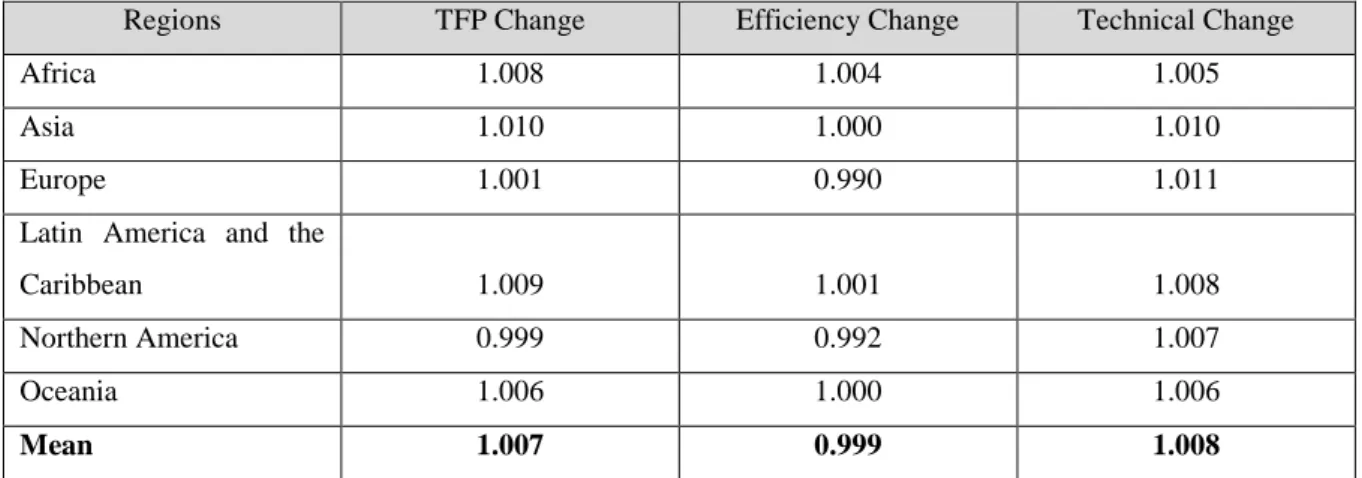
Based on the estimating procedure explained in Section 3, we estimated each country’s TFP, efficiency change and technical change for the 21 years included in the dataset. The means of each country’s TFP change, efficiency change and technical change from 1990 to 2010 are presented in Figure 2.1 and Table 2.1.
Figure 2.1 Average of TFP for 140 countries (1990-2010)
Table 2.1 and Figure 2.1 show the TFP change for the 140 countries from 1990 to 2010. The countries in the table are presented in descending order based on the magnitude of TFP changes. The table shows Singapore and China as the two countries with the highest TFP growth. Singapore indicates a 10.0 percent average growth in TFP (caused by steady growth in efficiency) and 10.0 percent growth in technical change. The highest TFP growth of Singapore contributes to its rapid economic development. According to Han (2017), the rapid economic development of Singapore was attributed to its plan-rational technocratic elite and its environmental policy which resulted in its international reputation as a model green city with a remarkable expansion of green spaces and infrastructure. Australia, the United