A Statistical Analysis of Award-Winning Speeches
SHIMIZU, Toshihiro
I.Introduction
1.1 Purpose
The primary purpose of this research is to investigate statistical characteristics in the linguistic data of the speeches delivered by Japanese female university students at the annual intramural English oratorical contests sponsored by Mukogawa Gakuin, an educational institution in Hyogo, Japan. The original speech-contest corpus, which contains 80 speeches1) in total presented in 2016-2018, consists of three groups of speakers: 62 in the entry round, 12 finalists, and six winners. The corpus was analyzed to highlight the statistical differences and similarities between these three groups, with a specific focus on the differences between the first group (entry round) and the other two groups (finalists and winners). After the technical analysis, this study drew upon the literature on English speechmaking published in Japan to verify how the ideas and tips introduced for Japanese speakers were, or were not, reflected in the facts revealed in the statistical analyses of the corpus.
1.2 Background
Holding English speech contests for students now appears to be a prevalent practice at various levels in English education (Nomura, 2009, p. 2). Since speechmaking is part of speaking practice, preparing for the contest is considered a meaningful opportunity, especially to improve studentsʼ English pronunciation (Kuwamoto, 2010, p. 106; Nishino & Nekota, 2014, p. 51). It has been stated, however, that the content of the speech has recently come to matter more than the quality of pronunciation at contests (Nomura, 2009, p. 16). As Mikuma (2003, pp. 55-82) calls speechmaking a “social interface device,” speeches with good content make people and society stay
interconnected. Hayase (1992, p. 2) also claims that one of the purposes of making speeches is to develop personality, where speakers can broaden their views about daily lives, social issues, and various problems around them. Creating stronger content that can motivate people in society plays a substantial part in English speechmaking practice.
The more people focus on the content, the more speakers need clear, specific guidelines that will help them to build compelling messages in their speeches. In order to help define and recognize good speeches, there are some studies on evaluation methods for speech contests (Terashima, 2000; Fukuda, 2018) and on analysis of individual speeches at a university-level speech contest (Underwood, 2003). However, they do not discuss the importance of exploring the technical data behind the texts. Indeed, such detailed linguistic data cannot thoroughly be evaluated at speech contests, since such data can only be uncovered through statistical analysis.
Although a statistical approach to analyzing the speech texts may supposedly provide clear, specific guidelines for making good speeches, it is unfortunate to have found few studies which conducted a technical analysis to show statistical proof of good speeches at contests. This study, therefore, analyzed the linguistic data of 80 speeches presented by students to clarify the statistical characteristics of the award-winning speeches. Furthermore, the results were compared with the existing recommended data for speechmakers. The ultimate goal of this research was to seek out new specific numerical guidelines for making award-winning speeches, which had never been explored by the statistical approach before.
1.3 Sections in the Article
This article consists of five sections. Section 2 is the outline of the Mukogawa Gakuin English Oratorical Contest, from which this study takes all the sample speeches. Detailed research procedure and the results are shared in Section 3, followed by discussions in Section 4. The final Section 5 is the conclusion and summary of the findings in the research.
II.Mukogawa Gakuin English Oratorical Contest
The annual Mukogawa Gakuin English Oratorical Contest is sponsored by the Mukogawa Gakuin Educational Institution, and the contest celebrated its 35th year in November of 2019. It consists of three categories: (1) an English recitation contest for the students at Mukogawa Junior High School, (2) an English oratorical contest for Mukogawa Senior High School, and (3) an English oratorical contest for Mukogawa Womenʼs University and the Junior College2). At the final stage of the contest, six selected finalists in each category appear on the stage to demonstrate their performance. This speech contest is open to all students in all departments at Mukogawa Womenʼs University and the Junior College. For the last few years, the past winners at the finals have also won in other national-level, intercollegiate English speech/presentation contests, including the grand champion of the Hong-Kong Cup All Japan University Student Ambassadors English Programme. Such winning records are a reflection of a quality oratorical contest at Mukogawa Gakuin.
Regarding the university and junior college category3), the original speeches are four-minute long. Contestants can talk about any topic of their choice as there is no specific annual theme for the contest. In most cases, speakers perform persuasive speeches, which highlight problems in the society and propose solutions to the audience. In this regard, speeches at this contest have been playing a successful role of a “social interface device” (Mikuma, 2003, pp. 55-82) that facilitates studentsʼ awareness of being a responsible citizen of the society.
The university and junior college category has two preliminary rounds before the final. The first entry round is audio-prescreening, where contestants submit the manuscript and the audio file to the jury. In this round, all speeches are judged anonymously, and 12 candidates are selected for the second round. In the second round, the selected speakers stand on the podium to address the audience. The second round selects six finalists for the final stage, where four judges eventually award two winners.
English/Delivery 40%.” The criteria reflect Nomuraʼs remark, which emphasized the importance of content in evaluation at speech contests (Nomura, 2009, p. 16). “Content 60%” includes structure (intro, body, and conclusion), effective opening and closing, logic (analysis and support), originality (topic and approach), solution(s), and proposal(s). “English/Delivery 40%” includes English (voice quality, volume, pronunciation, stress, intonation, and pause), delivery (attitude, sincerity, eye-contact, gestures, and posture), and memorization (fluency and understandability). There are no points allotted for the individual subcomponents in each criterion. This policy is considered permissible, as Fukuda (2013, pp. 131-133; 2018, pp. 21-22) statistically proved that a holistic evaluation without subcomponents and an analytical, detailed evaluation do not show a significant difference in the final ranking. Therefore, the same simple criteria (Content 60% & English/Delivery 40%) apply to both the university and junior college category, and the senior high school category4).
In deciding the final winning order in each round, the judges use the numbers of rankings, instead of individual raw scores, to avoid being affected by the different scoring standards of each judge. First, all judges rank all speakers. When finished, the numbers of rankings, which each speaker has received from all the judges, will be added together. The speaker, who has received the lowest total number of rankings, will be placed first.
Eighty sample speeches for this study were taken from the contest archives of the university and junior college category. The sample speeches were presented in the contests in 2016, 2017, and 2018. Table 1 shows the numbers of participants, their departments, and the university years. The numbers in brackets indicate the studentsʼ years.
Table 1. Component of 80 Speakers Analyzed (2016-2018) 2016 - 42 contestants
department English(1) English(2) English(3)
Japanese Language & Literature (4) Education (4) Phychology & Social Welfare (4) Informatics & Mediology (2) Informatics & Mediology (4) Pharmacy (1) Pharmacy (2) Junior College: English (2) 1st round 8 1 23 1 1 1 1 1 1 3 1 2nd round 1 8 1 1 1 final round 5 1 winners 2 2017 - 20 contestants 2018 - 18 contestants department English(1) English(3) English(4) Health &Sports
Sciences (3)
department English(2) English(3) English(4) Health &Sports Sciences (2)
1st round 2 13 4 1 1st round 1 15 1 1
2nd round 1 8 2 1 2nd round 10 1 1
final round 6 final round 5 1
winners 2 winners 2
III.Analysis
3.1 Research Method: Procedure
The research question was: Are there any statistical differences in the linguistic data between award-winning speeches and others? To answer this question, this study took a statistical, corpus-driven approach (Tognini-Bonelli, 2001) to investigate the quantified linguistic data hidden behind the texts for further comparisons. Each step in the procedure is described below.
3.1.1 Corpus building: Collection of sample speeches
This study collected 80 sample speeches, including 42 samples performed in 2016, 20 in 2017, and 18 in 2018. These 80 speeches comprised the original speech-contest corpus, which contained 35,349 words in total, for the analysis.
3.1.2 Grouping: Making groups for comparison
These 80 speeches were divided into three groups for comparative analysis. The first group, labeled “Entry,” consists of 62 speeches in total (36 in 2016, 14 in 2017, and 12 in 2018), which appeared only in the first entry-round for the contest. The second
group labeled “Finalists” is a collection of 12 speeches in total (four speeches each in 2016-2018), which appeared on the final stage but were not winners. The third group labeled “Winners” is a set of six award-winning speeches (two speeches each in 2016-2018), which successfully ranked first, or second, in the final round.
Practically, 18 speakers in groups Winners and Finalists are the best six speakers of each year. These 18 samples are defined as good speeches in this study, and they comprise a combined group, labeled “Good,” which will appear in the comparative analysis with group Entry.
3.1.3 Corpus analysis
The original speech-contest corpus was analyzed using the corpus analysis software, WordSmith Tools (Scott, 2008), to obtain statistical and lexical data of the corpus. It includes dispersion rates of full-stops (periods) in all sentences in each speech. This analytical process also produced the list of frequently appearing words in each group. 3.1.4 Comparative analysis
All the data were compared to discuss the characteristics and relationships between the groups. Based on the numerical linguistic data exported from WordSmith Tools, multiple statistical comparisons were conducted using IBM SPSS 20 to explore the statistical indications from the results further.
3.2 Results
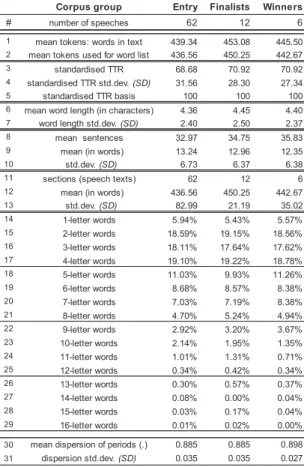
The numerical set of linguistic data, generated by the Word-List and Concordance features on WordSmith Tools, is summarized in Table 25). Word-List works only on the tokens, which have removed the numerals from the texts. This policy explains the differences in numbers of rows #1 and #2. “Mean tokens” in row #1 shows the average numbers of all words per speech in the group, while row #2 shows average numbers with numerals removed6).
Table 2. Numerical Linguistic Data of the Corpus: WordSmith Tools 5.0Table 2. Numerical Linguistic Data of the Corpus: WordSmith Tools 5.0
Corpus group Entry Finalists Winners
# number of speeches 62 12 6
1 mean tokens: words in text 439.34 453.08 445.50 2 mean tokens used for word list 436.56 450.25 442.67
3 standardised TTR 68.68 70.92 70.92
4 standardised TTR std.dev. (SD) 31.56 28.30 27.34
5 standardised TTR basis 100 100 100
6 mean word length (in characters) 4.36 4.45 4.40
7 word length std.dev. (SD) 2.40 2.50 2.37
8 mean sentences 32.97 34.75 35.83
9 mean (in words) 13.24 12.96 12.35
10 std.dev. (SD) 6.73 6.37 6.38
11 sections (speech texts) 62 12 6
12 mean (in words) 436.56 450.25 442.67
13 std.dev. (SD) 82.99 21.19 35.02 14 1-letter words 5.94% 5.43% 5.57% 15 2-letter words 18.59% 19.15% 18.56% 16 3-letter words 18.11% 17.64% 17.62% 17 4-letter words 19.10% 19.22% 18.78% 18 5-letter words 11.03% 9.93% 11.26% 19 6-letter words 8.68% 8.57% 8.38% 20 7-letter words 7.03% 7.19% 8.38% 21 8-letter words 4.70% 5.24% 4.94% 22 9-letter words 2.92% 3.20% 3.67% 23 10-letter words 2.14% 1.95% 1.35% 24 11-letter words 1.01% 1.31% 0.71% 25 12-letter words 0.34% 0.42% 0.34% 26 13-letter words 0.30% 0.57% 0.37% 27 14-letter words 0.08% 0.00% 0.04% 28 15-letter words 0.03% 0.17% 0.04% 29 16-letter words 0.01% 0.02% 0.00%
30 mean dispersion of periods (.) 0.885 0.885 0.898 31 dispersion std.dev. (SD) 0.035 0.035 0.027
“Standardized_TTR (Type/Token Ratio)” in row #3 is a percentage of unique words appearing in every 100 words. The higher STTR indicates a greater variety of vocabulary and fewer repetition of words (Cheng, 2012, p. 63). The STTR in this study can be considered an index that shows the variety and richness of expressions performed in speeches.
“Mean dispersion of periods” in row #30, which is an original addition to the traditional Word-List table for this study, shows the average dispersion rates of full-stops (periods) in each group. This data was yielded by concordancing the periods (.)
in each text7), using WordSmith Tools. This result indicates how much the end-points of sentences disperse uniformly in each speech. When the lengths of sentences stay almost the same throughout the text, the dispersion rate gets closer to 1.00. Table 3 displays a visualized sample image of the dispersion plots of group Winners, in which plot #5 (.923) indicates more uniform spread than plot #3 (.849).
Table 3. Dispersion Plots of Group “Winners”: WordSmith Tools 5.0
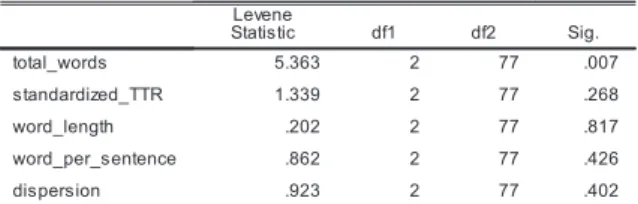
Table 4 shows the result of a homogeneity test to check the equality of variance of three groups (Entry: N = 62, Finalists: N = 12, and Winners: N = 6) in each of five factors, using IBM SPSS 20. Table 5 shows the result of the normality test of all groups in five factors. These tests were performed first to judge which statistical test should be applied for performing appropriate multiple comparisons, which is the final goal of this statistical investigation.
In Table 4, among the five factors, “total_words” shows the statistical significance (p < .05), which rejects the null hypothesis that the population variances are equal.
Table 4. Leveneʼs Test of Homogeneity of Variances in Five Factors: SPSS 20
In Table 5, among the 15 groups, group Winners in factor “word_length,” and group Table 4. Levene’s Test of Homogeneity of Variances in Five Factors: SPSS 20
Table 3. Dispersion Plots of Group “Winners”: WordSmith Tools 5.0
N Total
N File Dispersion Plot 1 W16_1.txt 0.900 2 W16_2.txt 0.890 3 W17_1.txt 0.849 4 W17_2.txt 0.916 5 W18_1.txt 0.923 6 W18_2.txt 0.911
Finalists in factor “dispersion,” show the statistical significance (p < .05), which respectively rejects the null hypothesis that the data is normally distributed.
Table 5. Test of Normality of Each Group (Shapiro-Wilk): SPSS 20
Given the results of the two pre-tests displayed in Tables 4 and 5, this study selected the Games-Howell test for multiple comparisons for the following reasons. The test is considered robust to deviations from normal distribution and homogeneity of variance (Fehrenbacher, 2013, p. 58) and can be applied to cases with independent participants. Also, the test is designed for different sample sizes, each of which is recommended to be more than five observations (Singala & Rajyaguru, 2015, p. 24). These prerequisites all met the conditions given in this study.
Table 6 is a result of the multiple comparisons between the three groups in each factor. In this table, one pair of groups between Entry and Finalists in factor “standardized_TTR” shows a significant difference (p = .027). This result statistically proves that the different STTR values in groups Entry and Finalists rarely occurred by chance, implying that this difference in STTR could be observed in other samples – in other participants at other contests.
Table 6. Multiple Comparisons Between Three Groups (Games-Howell): SPSS 20Table 6. Multiple Comparisons Between Three Groups (Games-Howell): SPSS 20
Tables 7 and 8 are results of the follow-up tests conducted to check the significant differences between groups Entry (N = 62) and the newly organized group Good (N = 18). Group Good was additionally created by merging groups Finalists (N = 12) and Winners (N = 6) for the follow-up tests.
verify the normal distribution of the data in each group, prior to the independent-samples t-test that would follow. Table 7 confirms the normal distribution (p > .05) of all data in each group.
Table 7. Test of Normality on Groups “Entry” and “Good” (Shapiro-Wilk): SPSS 20 Table 7. Test of Normality on Groups “Entry” and “Good” (Shapiro-Wilk): SPSS 20
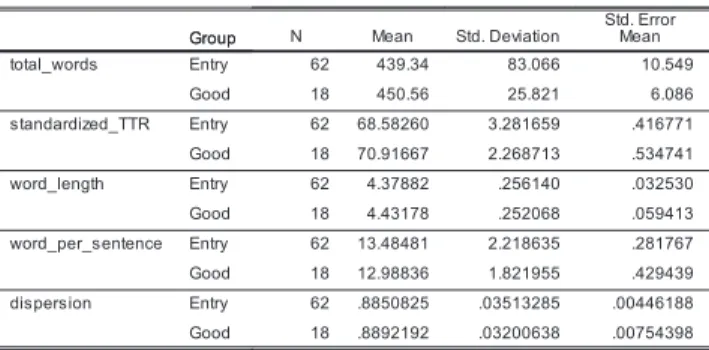
Table 8. Descriptive Statistics by Groups: SPSS 20
Table 8 provides descriptive statistics regarding the two groups in each factor, which was produced in the process of the t-test, using IBM SPSS 20.
Table 8. Descriptive Statistics by Groups: SPSS 20
Table 7. Test of Normality on Groups “Entry” and “Good” (Shapiro-Wilk): SPSS 20
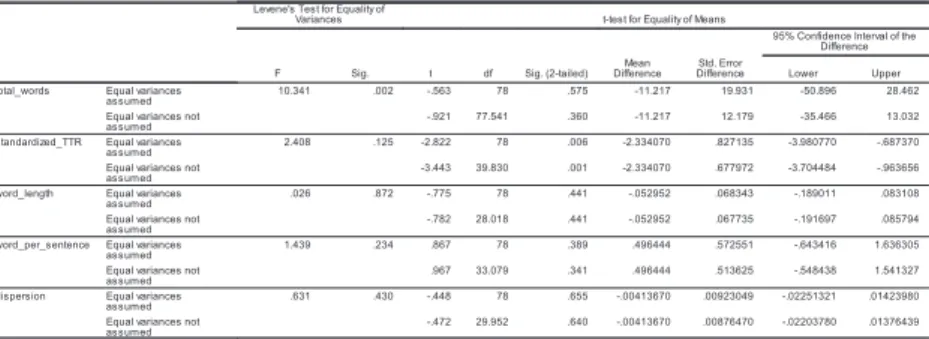
Table 9 is a complete result of the independent-samples t-test between groups Entry and Good in each factor. “Standardized_TTR” in Table 9 showed a significant difference of STTR values in groups Entry (M = 68.58, SD = 3.28 *in Table 8) and Good (M = 70.92, SD = 2.27 *in Table 8), t(78) = -2.82, p = .006. This result implies that STTR is a crucial factor in speechmaking.
Table 9. The t-test Between Groups “Entry” and “Good”: SPSS 20
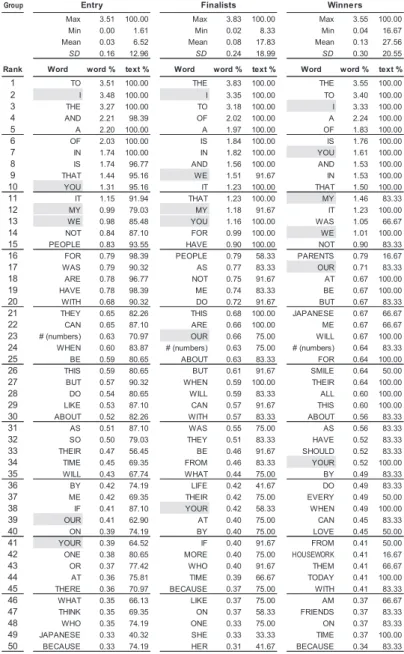
Table 10 is a list of frequently appearing words in each group. This list is sorted by the ranking of “word %,” which indicates the frequency of the word in each group. “Text %” shows the percentage of texts which contain the word. 100% in “text %” means that the word appears in all speeches in the group. Gray highlights in Table 10 are essential elements to be summarized separately in Table 11.
Table 10. Comparative List of Frequent Words in Three Groups: Rank #1-50 Table 10. Comparative List of Frequent Words in Three Groups: Rank #1-50
Group
Max 3.51 100.00 Max 3.83 100.00 Max 3.55 100.00 Min 0.00 1.61 Min 0.02 8.33 Min 0.04 16.67 Mean 0.03 6.52 Mean 0.08 17.83 Mean 0.13 27.56 SD 0.16 12.96 SD 0.24 18.99 SD 0.30 20.55
Rank Word word % text % Word word % text % Word word % text %
1 TO 3.51 100.00 THE 3.83 100.00 THE 3.55 100.00 2 I 3.48 100.00 I 3.35 100.00 TO 3.40 100.00 3 THE 3.27 100.00 TO 3.18 100.00 I 3.33 100.00 4 AND 2.21 98.39 OF 2.02 100.00 A 2.24 100.00 5 A 2.20 100.00 A 1.97 100.00 OF 1.83 100.00 6 OF 2.03 100.00 IS 1.84 100.00 IS 1.76 100.00 7 IN 1.74 100.00 IN 1.82 100.00 YOU 1.61 100.00 8 IS 1.74 96.77 AND 1.56 100.00 AND 1.53 100.00 9 THAT 1.44 95.16 WE 1.51 91.67 IN 1.53 100.00 10 YOU 1.31 95.16 IT 1.23 100.00 THAT 1.50 100.00 11 IT 1.15 91.94 THAT 1.23 100.00 MY 1.46 83.33 12 MY 0.99 79.03 MY 1.18 91.67 IT 1.23 100.00 13 WE 0.98 85.48 YOU 1.16 100.00 WAS 1.05 66.67 14 NOT 0.84 87.10 FOR 0.99 100.00 WE 1.01 100.00 15 PEOPLE 0.83 93.55 HAVE 0.90 100.00 NOT 0.90 83.33 16 FOR 0.79 98.39 PEOPLE 0.79 58.33 PARENTS 0.79 16.67 17 WAS 0.79 90.32 AS 0.77 83.33 OUR 0.71 83.33 18 ARE 0.78 96.77 NOT 0.75 91.67 AT 0.67 100.00 19 HAVE 0.78 98.39 ME 0.74 83.33 BE 0.67 100.00 20 WITH 0.68 90.32 DO 0.72 91.67 BUT 0.67 83.33 21 THEY 0.65 82.26 THIS 0.68 100.00 JAPANESE 0.67 66.67 22 CAN 0.65 87.10 ARE 0.66 100.00 ME 0.67 66.67 23 # (numbers) 0.63 70.97 OUR 0.66 75.00 WILL 0.67 100.00 24 WHEN 0.60 83.87 # (numbers) 0.63 75.00 # (numbers) 0.64 83.33 25 BE 0.59 80.65 ABOUT 0.63 83.33 FOR 0.64 100.00 26 THIS 0.59 80.65 BUT 0.61 91.67 SMILE 0.64 50.00 27 BUT 0.57 90.32 WHEN 0.59 100.00 THEIR 0.64 100.00 28 DO 0.54 80.65 WILL 0.59 83.33 ALL 0.60 100.00 29 LIKE 0.53 87.10 CAN 0.57 91.67 THIS 0.60 100.00 30 ABOUT 0.52 82.26 WITH 0.57 83.33 ABOUT 0.56 83.33 31 AS 0.51 87.10 WAS 0.55 75.00 AS 0.56 83.33 32 SO 0.50 79.03 THEY 0.51 83.33 HAVE 0.52 83.33 33 THEIR 0.47 56.45 BE 0.46 91.67 SHOULD 0.52 83.33 34 TIME 0.45 69.35 FROM 0.46 83.33 YOUR 0.52 100.00 35 WILL 0.43 67.74 WHAT 0.44 75.00 BY 0.49 83.33 36 BY 0.42 74.19 LIFE 0.42 41.67 DO 0.49 83.33 37 ME 0.42 69.35 THEIR 0.42 75.00 EVERY 0.49 50.00 38 IF 0.41 87.10 YOUR 0.42 58.33 WHEN 0.49 100.00 39 OUR 0.41 62.90 AT 0.40 75.00 CAN 0.45 83.33 40 ON 0.39 74.19 BY 0.40 75.00 LOVE 0.45 50.00 41 YOUR 0.39 64.52 IF 0.40 91.67 FROM 0.41 50.00 42 ONE 0.38 80.65 MORE 0.40 75.00 HOUSEWORK 0.41 16.67 43 OR 0.37 77.42 WHO 0.40 91.67 THEM 0.41 66.67 44 AT 0.36 75.81 TIME 0.39 66.67 TODAY 0.41 100.00 45 THERE 0.36 70.97 BECAUSE 0.37 75.00 WITH 0.41 83.33 46 WHAT 0.35 66.13 LIKE 0.37 75.00 AM 0.37 66.67 47 THINK 0.35 69.35 ON 0.37 58.33 FRIENDS 0.37 83.33 48 WHO 0.35 74.19 ONE 0.33 75.00 ON 0.37 83.33 49 JAPANESE 0.33 40.32 SHE 0.33 33.33 TIME 0.37 100.00 50 BECAUSE 0.33 74.19 HER 0.31 41.67 BECAUSE 0.34 83.33
Table 11 is a specific comparison between six keywords: I, YOU, WE, MY, YOUR, and OUR. These keywords are used to describe agents and objects in the speeches and, therefore, may reflect the speakersʼ position or attitude in addressing the audience.
Table 11. Frequency of Six Keywords: Edited From Table 10
IV.Discussion
This discussion reviews the linguistic data obtained in the previous section to reexamine the definitions of good speeches while referring to practical reference books about speechmaking.
4.1 Number of Words per Minute: WPM
The first point is about the appropriate number of words in a speech. The total number of words in a speech is defined by the speaking speed and allotted time: WPM (Words per Minute) times minute(s). Contestants are often concerned about the appropriate WPM because it considerably affects the overall impression of the speech.
Different studies show different WPM as an index for appropriate speaking speed. Fujio (2016, p. 86) states that Japanese speakers should speak a little slower than 140 WPM, which is the average WPM in lectures in English (Tauroza & Alison, 1990). A former CBS News reporter, Itoh (2017, pp. 77-78), claims that 150 WPM is the average for professional news reporters, but it is too fast for Japanese speakers. Itoh (2017), therefore, recommends keeping to 90-100 WPM when making speeches. Kameda (1994, pp. 68-69) proposes higher WPM around 110. Uematsu (1966, p. 68)
Table 11. Frequency of Six Keywords: Edited From Table 10
Group
Word rank word % text % rank word % text % rank word % text %
I 2 3.48 100.00 2 3.35 100.00 3 3.33 100.00 YOU 10 1.31 95.16 13 1.16 100.00 7 1.61 100.00 WE 13 0.98 85.48 9 1.51 91.67 14 1.01 100.00 MY 12 0.99 79.03 12 1.18 91.67 11 1.46 83.33 YOUR 41 0.39 64.52 38 0.42 58.33 34 0.52 100.00 OUR 39 0.41 62.90 23 0.66 75.00 17 0.71 83.33
recommends even higher WPM of about 120.
According to the fact displayed in row #1 of Table 2, the average numbers of words for four-minute speeches made by the contestants are 439.34 for group Entry (109.84 WPM), 453.08 for Finalists (113.3 WPM), and 445.50 for Winners (111.4 WPM). As the average WPM is around 111, the WPM value of 111 can be a dividing line between good speeches (in groups Finalists and Winners) and other entry-level speeches (in group Entry). The fact found in Table 2 showed that group Winners has the highest WPM among the three groups.
The differences in standard deviations (SD) in row #13 also highlight the distinctive characteristics of good speeches. The SD of group Entry is 82.99, which is a great deal higher than those of the other groups: 21.19 for Finalists and 35.02 for Winners. This difference can be interpreted to mean that the lengths and WPM of entry-level speeches are likely to vary widely, while those of good speeches remain relatively stable. Technically speaking, this finding implies that speeches, which are too long, or too short, may not eventually be evaluated favorably at speech contests.
4.2 Number of Words per Sentence: WPS
Just like WPM, the number of words per sentence (WPS) is a common concern of speakers, since it affects the understandability of the message. In speechmaking, it is highly recommended to avoid being verbose in a sentence. In short, each sentence should not be long (Uematsu, 1966, p. 18). Sentences must be as short and easy as possible (Kameda 1994, p. 51; Adachi & Sweat, 2012, p. 100), and they should always be concise (Kameda & Shimizu, 2014, p. 4). While discussing the importance of simplicity, Kameda and Shimizu (2014) advise saying, “Iʼm punctual,” instead of saying, “I am not the type of person who is often late for appointments” (pp. 4-5).
More specifically, Aiba (2017, p. 31) recommends keeping WPS at 15 or lower. Similarly, Itoh (2017, p. 57) states that the maximum number of words that professional announcers of English read aloud without breathing is around 15. Itoh, therefore, recommends that WPS be kept at 10 or lower (2017, p. 58). From a practical perspective, Shimizu (2014; 2015; 2016; 2017) analyzed 110 business speeches and 20 presidential political speeches, which contained approximately 326,000 words in
total (about 2,500 words per speech). Through this research, Shimizu has demonstrated that the average WPS values are 17.21 for business speeches and 18.81 for political speeches8), which are relatively higher than expected.
According to Table 2, the reality for university studentsʼ speeches appears to be much different. As found in row #9 in Table 2, the average WPS values are 13.24 for group Entry, 12.96 for Finalists, and 12.35 for Winners. The WPS value of 13 can be a dividing line between good speeches and others. Though it is a slight difference, WPS for group Entry was found to be higher than those of the other groups. This result parallels the guidelines advised in the literature for making good speeches; WPS values must be kept lower.
Nevertheless, one issue to be noted in Table 2 relates the average LPW (Letters per Word) values shown in row #6. Given the hypothesis that lower LPW values will promote smoother understanding, the LPW values for groups Finalists and Winners would have ideally been lower than that of Entry. However, the opposite was true in this study. One explanation for this conflict is that the entry-level speakers could not but use shorter words due to the limitation of their ability to use complicated, longer words in speeches.
4.3 Standardized Type/Token Ratio: STTR
As explained in Section 3.2, STTR is an index that shows richness in vocabulary. In row #3 of Table 2, the average STTR values are 68.68 for group Entry and 70.92 for both groups Finalists and Winners. This result implies that good speakers in groups Finalists and Winners utilize richer vocabulary in developing their messages. The STTR of 70 with the STTR basis of 100 words, as displayed in row #5, can be a dividing line that defines good speeches.
If speakers repeatedly use the same words in a short speech, it will possibly sound less impressive. As Uematsu (1966, p. 18) advises that speakers should avoid using the same words repeatedly, having lower STTR may run a risk of making speeches boring. At the same time, however, speakers should be concerned about the importance of simple language (Itoh, 2017, pp. 46-49). In other words, the efforts to use a variety of words and phrases in the message should not spoil the simplicity in the speech.
Section 4.2 hypothesized that the lowest LPW observed in group Entry was because of their limitation in vocabulary. The lowest STTR of 68.68 of group Entry in row #3 appears to support, though not entirely, this assumption. It is ironic to find it evident that the lower values in LPW and STTR could work together to make a speech easier to understand, though it might sound monotonous. This fact, in turn, warns speechmakers not to focus only on the numerical facts of LPW and STTR for the best results.
4.4 Dispersion Rates: Variations in Sentence Lengths
Besides STTR, which affects the vivid impression in speeches, the variation in sentence lengths on the timeline of speech is also essential. Dispersion rates of periods (full-stops) shown in row #30 of Table 2 can indicate the average level of variations in sentence lengths on the timelines. Mean dispersion rates are .885 for both groups Entry and Finalists, and .898 for Winners. This spread shows little indication of the apparent difference between the groups.
Instead, group Winners has the highest dispersion and the lowest SD, which together prove the uniform spread of the periods throughout the samples in the group. This result contradicts the common understanding that maintaining some fluctuation in sentence lengths within a speech plays a favorable role in creating a comfortable sentence rhythm in the speech. On the contrary, however, as far as these 80 speeches in this study are concerned, higher dispersion of full-stops may lead to an excellent speech instead.
4.5 Deductive Approach: Statistical Perspective
Sections 4.1 through 4.4 have discussed the samples collected in the Mukogawa Gakuin English Oratorical Contest. In order to investigate the possibility of deductive application of this research, this section conducts statistical analyses over the linguistic data obtained.
Table 6 is the result of statistical, multiple comparisons between three groups in five factors: total_words, STTR, word_length, WPS, and dispersion. The STTR values show a statistically significant difference (p = .027) between groups Entry and
Finalists9). According to Table 9, the STTR values also demonstrate a statistically significant difference (p = .006) between groups Entry and Good. These results propose a statistical implication that a similar difference regarding STTR may also be observed in other contests with other contestants – not limited in the test samples at Mukogawa Gakuin. In other words, STTR is a notable technical factor in making a difference.
As discussed in Section 4.3, STTR can be an index that shows the variety of vocabulary in a speech. Given this statistical result, as Hayase (1992, p. 2) also stated, speakers must consider appropriate words and phrases when building a message for the audience. Making good use of vocabulary, as well as carefully selecting words and phrases, reflects higher values in STTR, which may eventually help demonstrate a substantial effect, especially in speech contests.
4.6 Implications From Frequency of Keywords
Concerning the importance of word choice in speechmaking, the final investigation dealt with the frequency of I, YOU, WE, MY, YOUR, and OUR, used in speeches. This approach is based on the hypothesis that speakers in the three groups take different positions in creating and maintaining the mental distance between the audience and the speaker. Such differences may be reflected in the usage of these six keywords.
It is self-evident that one of the prime purposes of making speeches is to create rapport with the audience. In that regard, frequent repetition of “I” should be avoided, as it may create a self-centered impression in the message. Shimizu (2006, p. 12), for example, discusses the rhetorical effect of using WE (and OUR), instead of I, to promote stronger rapport.
Table 11 summarizes the frequency (word %) of these six keywords. The lowest frequency of “I” (3.33%) is found in group Winners; the highest is found in group Entry (3.48%). At the same time, the highest frequency of WE (1.51%) in group Finalists,
and OUR (0.71%) in group Winners, is conspicuous. These results can be interpreted to mean that good speeches appear to create a sense of unity by using WE and OUR effectively.
Hayase (1992, p. 20), Uematsu (1966, p. 17), Adachi and Sweat (2012, p. 6), and Kameda and Shimizu (2014, pp. 14-15) all advise, speakers have to prove and justify the points they are making by stating the reasons with appropriate citations. That is why, in Table 10, the word “because” appears in most of the texts (text %) in all groups – Entry: 74.19%, Finalists: 75.00%, and Winners: 83.33%, which is the highest.
Similarly, the phrase “according to” is a typical discourse marker that indicates the beginning of the citation. The keyword “according” is not listed in the top 50 list in Table 10, but the word appears in 75.00% of group Finalists and 66.67% of Winners, while it is found in only 37.10% of group Entry. This result can be summarized to mean that good speeches are likely to make precise citations, using the distinctive discourse marker of “according to” in the speeches.
The investigation about the wording of these keywords, including some implications from “because” and “according,” has indicated a crucial role in selecting adequate words for the best results in speeches. In addition to the statistical aspects of speech structures, the notion of appropriate wording should never be neglected, as it is believed to create stronger rapport with the audience.
V.Conclusion
All the analyses and discussions have been completed, and this section answers the research question posed in Section 3.1: Are there any statistical differences in the linguistic data between award-winning speeches and others? The answer is yes, and sometimes differences are more evident when the comparison focuses on the combined group Good, into which groups Finalists and Winners are merged. Detailed characteristic differences are summarized below.
1)WPM: Words per minute
The dividing line was at 111 (group Winners: 111.4 WPM *highest); the good speeches had an average WPM value higher than 111.
2)WPS: Words per sentence
The dividing line was at 13 (group Winners: 12.35 WPS *lowest); the good speeches had an average WPS value lower than 13.
3)STTR: Standardized type/token ratio
The dividing line was at 70 (group Winners: 70.92 *highest); the good speeches had an average STTR higher than 70 with the STTR basis of 100 words.
4)Statistical multiple comparisons: Significant difference in STTR
Statistically significant differences were found between groups Entry & Finalists, and Entry & Good. Therefore, good speeches are likely to have a variety of vocabulary in wording and phrasing.
5)Frequency in keywords
The good speeches demonstrated the higher frequency of WE and OUR, which supposedly helps create rapport with the audience. In many cases, the good speeches contained the word “according” as a clear discourse marker for sufficient citations.
In practicing and teaching speechmaking, having clear, conclusive guidelines may facilitate the progress. These concrete and specific technical values, newly uncovered in this study, could become an additional practical guide not only for performers but also for instructors of speechmaking. In other words, it is important to technically, and statistically, explore the fact-based data to discover new, possible directions for speechmakers.
Based on the findings in the statistical analyses, this study has pointed out that the careful selection of words is worthwhile to help make a difference in speech contests. Though this is an important, statistically significant clue to become a better speaker, such technical analysis does not always answer all questions about making profound speeches. As partly explored in Section 4.6, paying more profound attention to some specific keywords will also be very valuable and practical as a further study, which will employ more samples to be accumulated over the coming years.
can indicate how well the speech is structured from a technical point of view. Now that the method to reveal a specific set of linguistic data about good speeches has been made available, hypothesizing a new index, such as Speech Structure Index, may become possible by utilizing the obtained numerical data for calculation. For example, similar to the well-known body mass index (BMI = weight (kg) / [height (m)]2) that shows the balance of correct weight and height, a mathematical integration of WPS, WPM, and STTR could establish a new index for making good speeches, which will instantly examine the current balance of such statistical elements provided. If true, the new index may become a helpful guideline familiar to many learners and instructors of speechmaking.
In general, good speeches are realized by the combination of persuasive contents, stronger delivery, and, above all, the burning passion of the speakers. Especially in speech contests at schools, the quality of instructions given by teachers also affects the results. All the more, clear, fact-based numerical guidelines are essential. This study has demonstrated a method to show scientific, numerical guidelines. These technical implications will partly enhance studentsʼ infinite potential to become more persuasive performers on the stage.
Notes
1)All speeches were sampled and studied under the prior written consent of all contestants.
2)Mukogawa Womenʼs University and the Junior College together hold the enrollment of more than 9,500 students, which ranks the highest of all womenʼs universities in Japan.
3)In the university and junior college category of this contest, the first entry round (audio-prescreening) and the second round (stage performance) are assessed by the committee organized by the department of English. The author of this article has been the chair of the committee, and the head judge of the final, for the three years from 2016 to 2018.
4)The criteria do not apply to the junior high school category (a recitation contest), where original contents are not to be evaluated.
5)Some units in Table 2 are partly modified for analytical reference of this study. In rows #1, #2, and #8, the average numbers of words and sentences per speech are shown, instead of total sums that are supposed to appear in the original WordSmith output.
6)Only in the comparative analysis regarding the total numbers of words in each speech, this study uses “mean tokens: words in text” in row #1, since a total number of words generally refers to the sum of all words including numerals. 7)In the concordancing process, all the annotated periods were manually checked to
confirm they are all full-stops. If not, they were manually removed from the concordancing list (e.g., when periods appear as dots in decimal points or abbreviations).
8)WPS was manually calculated based on the total numbers of words and sentences shown in the corpus lists of these 130 speeches studied by Shimizu (2014; 2015; 2016; 2017).
9)Regarding “standardized_TTR” in Table 6, the significant difference was found between groups Entry and Finalists, but not between Entry and Winners. This behavior may be explained by the statistical nature of the Games-Howell test that tends to show severer results when the numbers of samples widely diverse, such as the case in this study: N = 62 for group Entry, and N = 6 for Winners.
References
Adachi, N., & Sweat, R.D. (2012). Tsutawaru! kokusaiha hissuno eigo speech [Smart tactics for public speaking]. Osaka: Osaka Kyouiku Tosho.
Aiba, Y. (2017). Eigo de purezen speech 15 no housoku [15 principles in English presentations and speeches]. Tokyo: Sanshu-Sha.
Cheng, W. (2012). Exploring corpus linguistics: Language in action. New York: Routledge.
Fehrenbacher, D. D. (2013). Design of incentive systems: Experimental approach to
incentive and sorting effects. Berlin: Springer Science & Business Media.
Fujio, M. (2016). Nihonjin dakarakoso dekiru eigo presentation [English presentation that Japanese people can make]. Tokyo: DHC.
Fukuda, N. (2013). Speech contest ni okeru hyouka houhou [Evaluation methods for speech contests]. Eiken Bulletin, vol. 25, 127-143.
Fukuda, N. (2018). Eigo speech contest no tameno bunsekiteki hyouka ni kawaru zentaiteki hyouka no jitsuyou no kanousei [The possibility of implementing a holistic evaluation instead of an analytic evaluation for the English speech contest]. Nagaoka Kougyou Koutou Semmon Gakkou Kenkyu Kiyou [Research Reports of National Institute of Technology, Nagaoka College], vol. 54, 18-24. doi: 10.24806/rrnitnc.54.0_18
Hayase, M. (1992). Eigo speech nyuumon [Introduction to English speech]. Tokyo: Gaku-Shobou.
Itoh, K. (2017). Eigo speech clinic [Speech clinic for English learners]. Tokyo: Kenkyu-Sha.
Kameda, N. (1994). Speech eigo no tehodoki [Instructions for English speeches]. Tokyo: Nihon Keizai Shimbun-Sha.
Kameda, N., & Shimizu, T. (2014). Suguni tsukaeru business eigo speech 100 [100 ready-to-use business English speeches]. Tokyo: Kenkyu-Sha.
Kuwamoto, Y. (2010). Eigo speech contest sanka wo tsuujita eigo no hatsuon shidou [A case study of teaching English pronunciation targeting kousen English speech contest]. Akita Kougyou Koutou Semmon Gakkou Kenkyuu Kiyou [Research Reports of Akita National College of Technology], vol. 45, 99-106.
Mikuma, Y. (2003). Eigo speaking gakushuu-ron [English speaking study theory]. Tokyo: Sanshu-Sha.
Nishino, Y., & Nekota, H. (2014). Speech contest ni muketa hatsuon shidou no kaihatsu jissen [Developing effective pronunciation instructions for a speech contest]. Chugoku-chiku Eigo Kyoiku Gakkai Kenkyu Kiyou [CASELE Research Bulletin], vol. 44, 51-60. doi: 10.18983/casele.44.0_51
for increased educational potential]. The Kobe Gaidai Ronso [The Journal of Kobe City University of Foreign Studies], vol. 60 (5), 1-26.
Scott, M. (2008). WordSmith Tools version 5. Liverpool: Lexical Analysis Software. Shimizu, T. (2006). Watashi to watashitachi no shiten: Speech karano saikou
[Viewpoints of I and WE: Reconsideration from speeches]. Gakkou Management [School Management], vol. 48 (6), 10-11.
Shimizu, T. (2014). Examining the dominance of conceptual metaphors in business speeches: The third factor. Kokusai Joho Kenkyu [The Journal of the Japanese Society for Global Social and Cultural Studies], vol.11, 56-67. doi: 10.11424/ gscs.11.1_56
Shimizu, T. (2015). An extensive study on characteristics of business speeches: A corpus-based approach to metaphors in business. Kokusai Joho Kenkyu [The Journal of the Japanese Society for Global Social and Cultural Studies], vol.12, 104-115. doi: 10.11424/gscs.12.1_104
Shimizu, T. (2016). A comparative analysis of conceptual metaphors in business and political speeches: A chronological approach. Kokusai Joho Kenkyu [The Journal of the Japanese Society for Global Social and Cultural Studies], vol.13, 3-14. doi: 10.11424/gscs.13.1_3
Shimizu, T. (2017). Metaphorical structures of business speeches reexamined: Insights from metaphorgrams of 110 business executive speeches. Kokusai Joho Kenkyu [The Journal of the Japanese Society for Global Social and Cultural Studies],
vol.14, 3-14. doi: 10.11424/gscs.14.1_3
Shingala, M. C., & Rajyaguru, A. (2015). Comparison of post hoc tests for unequal variance. International Journal of New Technologies in Science and Engineering,
vol. 2 (5), 22-33.
Tauroza, S., & Allison, D. (1990). Speech rates in British English. Applied Linguistics,
vol. 11 (1), 90-105.
Terashima, T. (2000). A study on speech evaluation in an English speech contest: Judgesʼ scoring tendencies and factors affecting evaluation. Kanto-Koshin-Etsu
Eigo Kyouiku Gakkai Kenkyu Kiyou [The Bulletin of the Kanto-Koshin-Etsu
katejo.14.0_123
Tognini-Bonelli, T. (2001). Corpus linguistics at work. Amsterdam: John Benjamins. Uematsu, T. (1966). Eigo no speech [English speech]. Tokyo: Sougen-Sha.
Underwood, W. (2003). Content analysis of speeches at university English speech contests. Fukuoka Jogakuin Daigaku Kiyou: Jinbun-Gakubu Hen [Fukuoka Jogakuin University Bulletin, Faculty of Humanities], vol. 13, 1-28.