Japan Advanced Institute of Science and Technology
JAIST Repository
https://dspace.jaist.ac.jp/Title
An Analysis of R&D Project Performance from Research to Commercialization ∼ Evidence from a Japanese Electric Company
Author(s) Osawa, Yoshitaka; Miyazaki, Kumiko Citation
Issue Date 2005-11
Type Conference Paper
Text version publisher
URL http://hdl.handle.net/10119/3858
Rights ⓒ2005 JAIST Press
Description
The original publication is available at JAIST Press http://www.jaist.ac.jp/library/jaist-press/index.html, IFSR 2005 : Proceedings of the First World Congress of the International
Federation for Systems Research : The New Roles of Systems Sciences For a Knowledge-based Society : Nov. 14-17, 2068, Kobe, Japan, Symposium 1, Session 5 : Technology Creation Based on Knowledge Science Knowledge/Technology Management(2)
An Analysis of R&D Project Performance from Research to Commercialization
~ Evidence from a Japanese Electric Company
(1)Yoshitaka Osawa, and (2)Kumiko Miyazaki
(1)Sumitomo Electric Industries, Ltd., 1-3-12 Motoakasaka, Minatoku, Tokyo 107-8468, Japan [email protected]
(2)Graduate School of Innovation Management,Tokyo Institute of Technology, 2-12-1 O-okayama, Meguroku, Tokyo 152-8550, Japan
ABSTRACT
For a business enterprise, research and development projects provide a crucial engine for growth and the management of research and development projects has a tremendous impact on the future of the enterprise. The key in R&D management is how to select projects and allocate finite management resources. It is extremely important to thoroughly discuss ways to make such selection and allocation. In this study, we analyzed a group of R&D projects that had been carried out at Sumitomo Electric Industries, Ltd., with emphasis on processes that led to the commercialization of researchin the hope that the results could help individual companies choose R&D projects and distribute management resources. The analysis, from the viewpoint of market sector, product type, and research stage was carried out to see whether individual processes, such as technology transfer, commercialization, were successful or not at each of these stages and, if unsuccessful, reasons for the failure. The results show that, 56% of the targeted projects were successful in technology transfer, 41% in commercialization, and 24% in commercial success of a new product. Reasons for failure can be roughly classified into market factors and technical problems. For instance, main obstacles are market related factors for information and communications, and technical problems for materials. The study thus produced interesting findings classified by market sectors and product types.
Keywords: R&D management, resource allocation,
research project selection
1. BACKGROUND AND PURPOSE
For a business enterprise, research and development projects provide a crucial engine for growth and the management of research and development projects has a tremendous impact on the future of the enterprise. To what extent should management resources be allocated to which research project? How should these research projects be evaluated? How should time frames, such as short term, medium term, or long term, be determined in order to attain expected research results? How should an
organization or methodology be established to press ahead with a given topic in order to carry out research and development projects more effectively?
Furthermore, the research and development division of many enterprises frequently receives questions from upper management or the accounting division concerning its efficiency: considerable investments are made in R&D; do they commensurate with results? What results can be expected from an ongoing R&D project? Investor relations meetings, which Japanese companies have recently begun to actively organize, encounter severe comments and sharp questions about research and development project selection and integration, expected results, efficiency and the like. These are few of the questions that must be answered in the management of R&D projects.
Among these questions, the focus is on how to select a research project and how to allocate limited resources. Selecting an R&D project and examining ways to allocate resources are two of the important tasks that should be performed in the management of R&D projects.
Choosing research projects and distributing resources in accordance with a R&D strategy based on an overall business strategy is a critical requirement [1], but it is impossible to successfully commercialize all of the research projects even if they are chosen through the due procedures. An R&D project may, despite all efforts made, end in failure for countless reasons, such as unattained technical goals or the miscalculation of market needs [2]. The results of this study demonstrate that there is a certain probability—herein referred to as the probability of success—that a given project will be successfully commercialized. Accordingly, looking into a company’s previous research projects and analyzing the R&D results, such as the probability of success, is useful in choosing future research and development topics and examining ways to allocate resources in the future. The purpose of this study is to provide useful insights for individual enterprises in selecting R&D topics and identifying methods for the allocation of resources. To
attain this purpose, a longitudinal analysis of R&D projects that Sumitomo Electric Industries, Ltd. has addressed to date in order to commercialize them has been carried out.
Some researchers have examined how multiple research projects have gone through the processes of identification, research, development, and commercialization over a given time scale and what percentages of the projects have been successfully commercialized. Such studies, however, concern the average data for two or more industries as a whole and are not examples of analyses of an individual industry or enterprise [3]. With this in mind, this study has focused its survey and analyses on a group of research projects for an individual business enterprise.
Examples of expected insights of the analysis are: which market sector would have a high probability of success? and why? What type of products would have a low probability of success and why? To which market sector or product type did the research projects belong that failed to thrive to the commercialization?
Recently, “Valley of Death”, which was proposed in the US [4], is a popular concept in Japan. Assuming that the concept of the Valley of Death expresses a gap between development stage and launch or commercialization, this study would survey and analyze the Valley of Death phenomenon. Some insights might be expected for overcoming the Valley of Death.
2. FRAMEWORK OF ANALYSIS
Sumitomo Electric Industries, LTD. is a diversified enterprise, having various market sectors, types of products and core technologies. It is an essential and challenging task for R&D top management to determine the means of selecting a research project and allocating limited management resources among complicated R&D portfolios while considering the balance between existing business, new business and timeframe. Responding to the following questions will give a concrete example of this task; which market sector should be selected or abandoned? Which type of products from materials to systems should be prioritized? Which core technology should be concentrated on, or which technology should be obtained and developed to become a new core technology?
To find these answers, an analysis of Sumitomo Electric Industries’ research and development projects has been made in respect of market sector, product type, research stage, and project duration for example. As with many Sumitomo Electric Industries’ research and development projects, since plural technologies had been developed
within a project, there is ample room to discuss the relationship between research projects and the technologies. Therefore, further analysis from the aspect of technology will be done after the end of the discussion.
If a project turns out to be unsuccessful, reasons for it will be investigated and then classified by market sector and product type.
Some failure cases of new product development have been reported in the past. For instance, SPRU analyzed 58 projects to discriminate between the respective characteristics of success and failure, and pointed out underestimation of user needs and lack of understanding of the market by the project SAPPHO [5]. Hopkins et al. in their “Causes of New Product Failure” pointed out inadequate market analysis, product problems or defects and showed their ratios [6]. Cooper in “Deficiencies in the New Product Process” evaluated failures by market and technical factors, citing a few items in each of them and showing their ratios [7]. These studies, however, did not try to analyze failure causes for individual projects, by technology transfer, commercialization, and commercial success of a new product, as this study has attempted. Neither have there been any attempts at analyzing causes by market sector or product type. The present study was designed to provide answers to questions such as: Which market is more successful than others and why? Which product type is more successful and why? What projects often fail to progress from research to development stages, by product type and market sector? The study aimed to find answers to these questions. It is surmised that projects in more successful market sectors and product types go through successful processes in the R&D stage and that they are at least technically competitive. The study, in other words, sheds light on from what market sector or product type a corporation draws its competitive edge.
3. METHODOLOGY
The database used for this study contains the record of research projects during the five-year period from 1997 to 2002 at Sumitomo Electric Industries, LTD. excluding those projects in the exploration stage evaluated by “New Score method”, which was originally developed in 1996 [8], [9]. The research projects have been classified according to market sector, product type, and project duration. The market sectors include information and communications, electronics, automobiles, energy, industrial materials and others, while the product types include materials, parts, equipment, and systems. The research stages are divided into research and development. The project durations are counted from
1997 or project starting year to stopping.
In regard to how research projects are evaluated, progress is measured by whether the topic has shifted from the research to the development stage, and by the final status of the given project—that is to say, whether it has been abandoned or whether it has been successfully technology transferred, and, if it has produced a new technology, whether this technology has been successfully commercialized or not.
To track research projects, surveys were conducted among project leaders on the degree of progress from research to development stages and where the project finished, i.e., whether the project was abandoned or successfully transferred. If technology transfer was successful, has it been commercially applied? The survey has studied, as an index of R&D success, the sales for 5 years after release of the product and whether the marginal profit was achieved. To collect data on how new products fare, another questionnaire survey is being carried out each year [10].
4. RESULTS AND DISCUSSION 4.1. Definitions
Technology transfer means that a certain technology in an R&D project, after having reached a commercialization level, has been transferred to the existing business unit of the company or the new development unit.
Commercialization means that, based on the transferred technology, the existing business unit or the new development unit is able to market a product and achieve certain sales (relatively small for the company, excluding sample sales).
Commercial success of a new product means that a commercialized new product has generated, within 5 years of its release, sales above the target level (over X billion yen) and has achieved the marginal profit (over Y billion yen).
4.2. Overall results
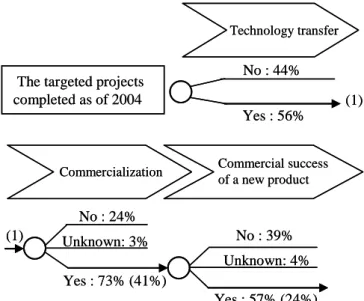
The overall results of the study are shown in Figure 1 and as follows:
- 44% of the targeted projects completed as of 2004 were ultimately abandoned and 56% of them had been successfully technology transferred.
- 16% of the above targeted projects came to an end in the research stage and 84% of them moved on to the
development stage.
- 24% of the projects that had been transferred, failed in the commercialization of those technologies and 73% of them resulted successful. 3% of the projects were “Unknown”, which means that although the current sales are small, it is still too early to judge whether the project is successful or not as it has been only 2 to 3 years since its commercialization. 41% of the targeted projects were successful in commercialization.
- 39% of the projects that had been commercialized, failed in commercial success of a new product and 57% of them resulted successful. 4% of the projects were “Unknown”, which means that it is still too early to judge whether the project is successful or not as it has been less than 5 years since its commercialization. 24% of the targeted projects were successful in commercial success of a new product.
Technology transfer
Commercialization Commercial success of a new product
Yes : 56% No : 44% The targeted projects
completed as of 2004
Yes : 73% (41%) No : 24%
Yes : 57% (24%) No : 39%
Figure 1. Overall results
(1)
(1)
( ) : Percent of the targeted projects completed as of 2004
Unknown: 3%
Unknown: 4%
4.2.1. Analysis by market sector
As the results in Figure 2 show, the automobiles sector accounted for a relatively small proportion of technology transfer. The causes will be analyzed in detail later. As for technology transfer and commercialization, industrial materials and electronics played a major role, while industrial materials continue to be an important factor for the commercial success of new products. This is because Sumitomo Electric operates mostly in the fields of industrial materials and electronics, meaning that they have ample know-how and knowledge of related technologies and market conditions.
4.2.2. Analysis by product type
As the results in Figure 3 show, the systems sector accounted for a relatively small proportion of the technology transfer. The causes will be analyzed in detail later. As for technology transfer, there were no significant differences outside the systems, while equipment played a major role in commercialization and the commercial success of a new product. The reasons for this will be analyzed in detail later.
4.3. Analysis of failed projects in technology transfer
0 % 2 0 % 4 0 % 6 0 % 8 0 % 1 2 3 4 5 6 7
Commercial success Commercialization
Technology transfer
0% 20% 40% 60% 80%
All
Figure 2. Analysis results by market sector
4.3.1. Overall results
There were failed projects in which technology transfer was unsuccessful and each had its own reasons.
In this study, the reasons that were common to these projects were first roughly classified into two groups, technical problems and market factors, and were then further classified and organized in greater detail.
The results are shown in Figure 4. Of all failed projects in technology transfer, 49% of them failed because of technical problems, 42% because of market factors, and the remaining 9% due to other reasons. These other reasons included absorption by other projects. Technical problems were slightly more numerous than market factors, but the overall difference was small.
The technical problems were analyzed further. For technology transfer to be successful, two hurdles need to be cleared. One of them is whether the company can develop a product with the required performance. The second is whether such a project is commercially cost-competitive.
The projects that failed because of technical problems were further classified from this perspective. The result shows that 67% of them, failed to clear the first hurdle, and 33% of them, failed to clear the second hurdle,
Information and mmunications co Electronics Automobile Energy Industrial materials Others Probability of success 0% 10% 20% 30% 40% 50% 60% Ot hers Market fact ors T echnical problem s (1): 26% (2): 43% (3): 31%
P erform ance: 67% Cost : 33%
(1) Market dem and does not em erge, despit e init ial expect at ions when t he project st art ed.
(2) T he current market is sm all, and clearly will not expand m uch in t he fut ure.
(3) An expect ed m arket segment is not creat ed t o accom modat e a new product which, despit e highcost , t he company expect s t o be a com mercial success due t o it s high perform ance.
P ercent age of t he failed reason
Figure 4. A nalys is res ults of failed projects in technology trans fer
49% 42% 9% 0% 20% 40% 60% 80% 1 2 3 4 5
Commercial s ucces s Commercialization
Technology trans fer A ll
Sys tems Materials Parts Equipment
Figure 3. A nalys is res ults by product type Probability of s ucces s
indicating that the first hurdle was more formidable than the second one. The reason for this is that the first hurdle, which requires the development of new technology for each project, is naturally more difficult as it poses formidable technical challenges.
Market related factors were also analyzed further, and it was learned that project failures occur in the following three patterns:
(1) Market demand does not emerge, despite initial expectations when the project started.
(2) The current market is small, and clearly will not expand much in the future.
(3) An expected market segment is not created to accommodate a new product which, despite high cost, the company expects to be a commercial success due to its high performance.
Needless to say, each project, backed by ample research and data analysis, began on the assumption that these scenarios would not eventuate.
The projects were further analyzed by these market factors, with the result that 26% of them were because of (1), 43% because of (2), and 31% because of (3). As there was not much difference among them, they were analyzed in greater detail, as shown later in this paper.
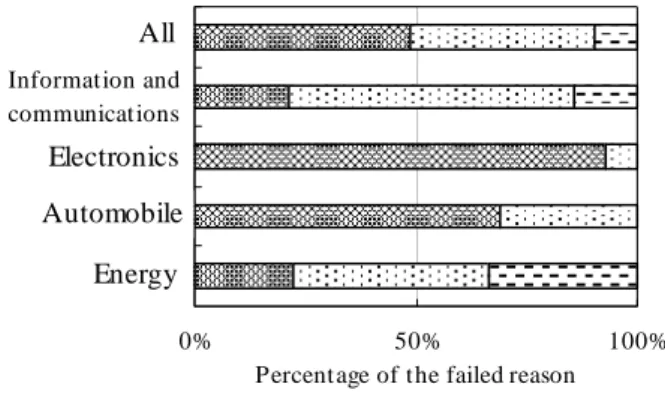
4.3.2. Analysis by market sector
The results are shown in Figure 5. Although there were not so many projects to analyze, the results in industrial materials and others, indicate that market factors mainly affect the field of information and communications, whereas technical problems are the main challenges for electronics. This is because there are not many technological choices in the field of information and communications; researchers are able to select less risky technologies before starting the project. Electronics, on the other hand, involves many more technological choices, which increases technical uncertainty. If technologically successful, however, this area benefits from greater market certainties.
The further analysis results, as shown in Figure 6, indicate that technological problems can be viewed in terms of performance and cost. Performance mattered more for electronics, while cost was a greater factor in the field of automobiles. This is because many projects in electronics were unable to clear the aforementioned first hurdle that concerns technical uncertainties. The first hurdle is lower for the automobile field as it often uses established technologies, but the second hurdle, cost efficiency, proved more difficult to clear.
Of the market factors, (1) and (2) hindered the
information and communications projects more than (3), because market projections made before the IT bubble were often wrong. As for automobiles, although there were not many projects in this area, all the projects experienced (1), as the market is not very tolerant to cost increases just because the car has slightly higher performance. 0% 50% 100% 1 2 3 4 5
T echnical problems Market factors Others
Percentage of the failed reason
All Information and communications Electronics Automobile Energy
Figure 5. Analysis results of failed projects in technology transfer by market sector
0% 50% 100% 1 2 3 4 Performance Cost (1) (2) (3)
Percentage of the further failed reason
Figure 6. Further analysis results of failed projects in technology transfer by market sector
T echnical problems in electronics T echnical problems in automobiles Market factors in information and communications
(1), (2), and (3) are same as in Figure 4 Market factors in
automobiles
4.3.3. Analysis by product type
The results, as shown in Figure 7, indicate that technical problems loomed large in materials, while equipment and systems were susceptible to market factors. Parts, on the other hand, exhibited little difference between technical problems and market factors. Like electronics, the materials area experiences technical uncertainties due to the wide range of selections, but, once a project attains
technological success, the market uncertainty diminishes. As for equipment and systems, like information and communications, there are few technical selections, allowing the research staff to choose less risky technologies. The market uncertainty, however, is greater for them. The parts area is situated somewhere between materials and equipment, meaning that it shares problems with both these areas.
Further analysis results, as shown in Figure 8, indicate that technical problems can be viewed in terms of performance and cost. It is considered that for materials and parts, a project’s success is largely dependent on its ability to clear the first hurdle. Individual technologies each have the potential to clear their targets, meaning that they have to be implemented first to see how well (or badly) they fare.
As for the market factors, the parts area suffered (1) and systems often experienced (2). This is because parts were often used in information and communications projects, which made them susceptible to the bursting of the IT bubble. The systems were unsuccessful because the market expansion was slower than expected due to the user situation and other factors.
4.3.4. Analysis of project duration
0% 20% 40% 60% 80% 100% Systems Equipment Parts Materials All
T echnical problems Market factors Others
Percentage of the failed reason
Figure 7. Analysis results of failed projects in technology transfer by product type
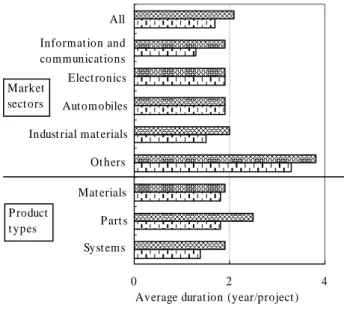
The average duration of the projects that failed in technology transfer were analyzed by market sector and product type. As the results in Figure 9 show, the average duration of “Others” in market sectors was longer than those of the other market sectors such as information and communications and of all product types. This means that it took longer time to decide to stop the projects since this sector was unfamiliar to Sumitomo Electric and less information or know-how had been obtained.
The average duration of the total failed projects because of market factors or technical problems were shorter than that of the failed projects because of technical problems except electronics and automobiles.
This suggests that the speed of market change is equal to the development speed in electronics or automobiles sector, whereas the speed of market change is often faster than the development speed in information and communications or industrial materials sector.
0 2 1 2 3 4 5 6 7 8 9 4
T echnical problems / Market fact ors T echnical problem s
All Informat ion and com municat ions Elect ronics Aut om obiles Indust rial mat erials Ot hers Mat erials
Average durat ion (year/project ) P art s Syst em s Market sect ors P roduct t ypes
Figure 9. A verage duration of failed projects in technology trans fer
0% 50% 100% 1 2 3 4 Performance Cost (1) (2) (3)
Figure 8. Further analysis results of failed projects in technology transfer by product type
Percentage of the further failed reason T echnical problems in materials T echnical problems in parts Market factors in parts Market factors in systems
(1), (2), and (3) are same as in Figure 4
As shown in Figure 1, 24% of the technology transferred projects were unsuccessful in commercialization. Needless to say, the operating division as well as the R&D section was responsible for their failures. Here, the focus was on the responsibility of the R&D section. Figure 10 shows the results of the analysis; a similar analysis was carried out for the scrapped projects. Of these projects, 71% failed due to technical problems, 29% due to market factors. Clearly, commercialization failures due to technical problems are more numerous than due to market factors. Of these projects that suffered technical problems, 67% failed to achieve a technology breakthrough, which confined them to a limited market segment (they were unable to enter the larger market initially envisioned); 27% failed because the transferred technologies did not become new products as they were merely improvements of existing technologies (which only contributed to cost reduction); and the remaining 6% failed as the overall technology including the target one was not competitive enough against its rivals. As for the market factors, there was an error in reading the level of market demand—no market needs arose to generate the initially anticipated sales.
Technical problems affected commercialization largely in the fields of materials and parts by product type, rather than by market sector. This means that researchers pushing the materials and parts projects knew the market needs, but failed to make necessary technological breakthroughs. The level of technology transfer was lower than the initial projection. If the project starts on the assumption that several project leaders’ opinions, which reflect the results of the best efforts to achieve the technology target including time factors, are correct, then the success of the product is defined by the limits of the selected technology. The problem here, with hindsight,
appears to have been failure to choose the right technology.
4.5. Analysis of failed projects in new product’s commercial success
As shown in Figure 1, 39% of the projects that had been commercialized, failed to achieve commercial success for a new product. These failures apparently put more blame on the operating division than the commercialization failures, but some problems can be attributable to the R&D section. These problems were analyzed in the same manner as for the scrapped projects, with the results shown in Figure 11.
The results show that technical problems affected 33% of all the projects, market factors were obstacles to 67% of them. Unlike the commercialization failures, market factors, rather than technical problems, loomed larger in this area. The main technical problems were as follows: 56% of them failed as their cost-performance was not very competitive on the market and 33% of them failed to achieve a technology breakthrough, which confined them to a limited market segment (they were unable to enter the larger market initially envisioned). As for the market factors, all the projects failed as the market growth was less than expected.
0% 20% 40% 60% 80% 100%
1 2 3 4
T echnical problems Market fact ors
Figure 10. A nalys is res ults of failed projects in commercialization A ll Information and communications Materials Parts
P ercent age of t he failed reason
0% 20% 40% 60% 80% 100% 1 2 3 4 5
T echnical problems Market fact ors
A ll Information and communications Electronics Materials Parts
P ercent age of t he failed reason
Figure 11. A nalys is res ults of failed projects in commercial s ucces s of a new product
These technical problems were often found in materials by product type, and electronics by market sector. Like commercialization, if the project starts on the assumption that several project leaders’ opinions are correct, then the commercial success of the new product is defined by the limits of the selected technology. With hindsight, the failures here can be attributed to imprecise technology selection, like in the case of commercialization.
These market factors were more often found in the field of information and communications by market sector, rather than by product type. This is probably because the market uncertainty following the bursting of the IT bubble had an adverse effect. The unanswerable question is whether the operating division, which is closest to the market, could perhaps have detected such uncertainty a little earlier.
5. DISCUSSION AND INSIGHTS FOR R&D MANAGERS
In the field of electronics or materials, the key is technology, especially performance requirements. It is therefore important to be able to choose the right technologies. As project leaders are often not in a position to terminate a project by themselves, for research efficiency the managers must do so as soon as it is clear that future prospects for it are bleak, and switch to a new project. In the field of automobiles, the key is to pay extra attention to the likelihood of achieving production cost targets during the R&D stage, and the development of technology that might incur a cost increase.
In the field of information and communications or parts, the market uncertainty remains as a result of the bursting of the IT bubble and other factors. Because of this, risks should be hedged by diverting management efforts to other areas and product types. As for systems, it appears wise to avoid projects for which target markets will likely remain small for some time. Like technology selection, it is essential to end any project without delay once its market prospects are found to be bleak based on an analysis of gathered information.
If the process from technology transfer to product development is likened to “Valley of Death,” then the commercial success of a new product might be referred to as “overcoming the Valley of Death.” This study found that only 24% of the projects successfully overcame the valley. Assuming that each project leader performs the best management of individual projects, then the manager who oversees these leaders is responsible for increasing the number of projects that overcome this valley from a macro viewpoint. One way to increase the success rate is to increase the number of R&D projects with good prospects. It appears effective to launch as many such promising projects as possible within the limited amount of time.
The framework, methodology, and knowledge obtained through this work will be useful not only for Sumitomo Electric, but for many diversified corporations with complex research portfolios. To improve the usefulness of the results, further studies will be needed to analyze
more projects, the size of injected resources, and efficiency of research.
REFERENCES
[1] Roussel, P. A., Saad, K. N., and Erickson, T. J. (1991) Third Generation R&D, Chapter 3, HBS Press
[2] Cooper, R. G. (1993) Winning at New Products, Chapter 2, Addison-Wesley Publishing Company [3] ibid, Chapter 1
[4] Branscomb, L. M., et al. (2002) Between Invention and Innovation, NIST, GCR 02-841
[5] Freeman, C. (1989) The Economics of Industrial Innovation, Chapter 8, Mit Press
[6] Hopkins, D. S., et al. (1971) New product pressures, Conference Board Record 8, 16-24
[7] Cooper, R. G., et al. (1975) Why Industrial New Products Fail, Industrial Marketing Management, 4, 315-26
[8] Osawa, Y., Murakami, M. (2002) Development and application of a new methodology of evaluating industrial R&D projects, R&D Management, 32, 1, 79-85
[9] Osawa, Y (2003) How well did the new Sumitomo Electric project ranking method predict performance?, R&D Management, 33, 3, 343-350
[10] Osawa, Y., Yamasaki, Y. (2005) Proposal of industrial research and development performance indices, R&D Management, 35, 4, 455-461