INTRODUCTION
Ethanol (Alcohol) consumption is known to cause a substantial neuronal loss in several brain regions of the brain1-3 and to exert adverse effects on the different systems in the central nervous system (CNS).4,5 It has been reported that ethanol induces death in a variety of cells including astroglia1 and neuroblastoma cells3 in vitro, which it triggers apoptotic neurodegeneration in the developing rat brain2 in vivo. In addition, ethanol intake during development stage is associated with deficits in learning and memory,6-8 and ethanol abuse has been shown to induce major depression and behavioral disorders during adolescence.9,10 The hippocampal in the brain is a critical region for learning and memory. The hippocampal damage impairs explicit memory in human. Further, the damage of this region suppresses spatial and contextual and learning that requires the formation of relational representations among multiple cues in the rodent.11-13 It has been shown
that ethanol disrupts hippocampus-dependent learning by preferentially impairing stimulus processing at the level of the hippocampus.14 c-Fos, an immediate early gene, is sometimes used as a marker for stimulus-induced metabolic changes of the neuron activity, which is induced in the CNS under various conditions.15-17 Especially, the c-Fos expression in the hippocampus has been suggested to be essential for encoding spatial memory.18,19 Recently, there are a couple of reports about ethanol induced blocking of the hippocampal c-fos mRNA14 and memory impairment7. Although previous studies have demonstrated that ethanol suppresses the c-Fos expression in the hippocampus, both dose- and duration- effects of the ethanol administration has not been established. In the present study, therefore, dose- and duration-dependent effects of ethanol on the c-Fos expression in the rat hippocampus were investi-gated with immune-histochemical way.
[原著]
Dose- and duration-dependent effects by ethanol on c-Fos expression
in rat hippocampus
Min-Chul Shin
1,* AbstractThe purpose of this study was to examine both dose- and duration-dependent effects of ethanol on c-Fos expression in the rat hippocampal region. Ethanol treatment decreased the expression of the c-Fos positive cells in the hippocampal region. Further, the suppression of the c-Fos positive cells depended on both ethanol concentration and duration. Therefore, we suggested that ethanol-induced inhibition of the c-Fos expression in the rat hippocampal region may be an underlying of ethanol-induced disruption mechanisms during adolescence.
Keywords: ethanol; c-Fos; hippocampus; adolescence; immunohistochemistry
1Laboratory of NeuroScience, Kumamoto Health Science University *Corresponding author:karosu94@ kumamoto-hsu.ac.jp
64 Min-Chul Shin
MATERIALS AND METHODS
Animals and Treatments
Male Sprague-Dawley rats weighing 90±10g (30 days postpartum) were used in the present study and the experimental procedures were performed in accordance with the animal care guidelines of the National Institute of Health (NIH). Each animal was housed at a controlled temperature (20±2 ℃) and maintained under light-dark cycles, each cycle consisting of 12 h of light and 12 h of darkness (lights on from 07:00 to 19:00 ), with food and water
made available ad libitum.
The first part of the experiment was aimed at determining the dose-dependent effect of ethanol on c-Fos expression. Animals were divided into 5 groups: the control group, the 0.5 g/kg ethanol-treated group, the 1 g/kg ethanol-ethanol-treated group, the 2 g/kg ethanol-treated group, and the 4 g/kg ethanol-treated group (n=5 for each group). Rats of the control group were injected intraperitoneally with saline once a day for 3 consecutive days, while animals of the ethanol-treated groups were injected with ethanol at the respective dose once a day over the same duration of time.
In the second part of the experiment, the duration-dependent effect of ethanol on c-Fos expression was investigated. Animals were divided into 4 groups: the control group, the ethanol-treated group for 1 day, the 3-day-ethanol-treated group, and the 6-day-ethanol-3-day-ethanol-treated group (n=5 in each group). Ethanol at a dose of 2 g/kg was given to each animal of the ethanol-treated groups once a day over the respective duration. Each animal was sacrificed 1 h after the last ethanol injection.
Blood Ethanol Concentration Measurement
For analysis of serum ethanol concentration, blood was collected from animals via cardiac puncture 2 h after the last ethanol injection, and the blood ethanol concentration was measured using a Sigma Diagnostics kit (Sigma Chemical Co., St. Louis, MO, USA) as per the manufacturer’
s protocol.
Histochemical Procedure
T h e e x p e r i m e n t a l a n i m a l s w e r e f u l l y anesthetized with Zoletil 50Ⓡ (10 mg/kg, i.p.; Vibac Laboratories, Carros, France), transcardially perfused with 50 mM phosphate-buffered saline (PBS), and fixed with a freshly prepared solution consisting of 4% paraformaldehyde in 100 mM phosphate buffer (PB, pH 7.4). The brains were removed, postfixed in the same fixative overnight, and transferred into a 30% sucrose solution for cryoprotection. Coronal sections of 40μm thickness were made with a freezing microtome (Leica, Nussloch, Germany).
c-Fos expression in the hippocampus was visualized
via a previously described immunohistochemical method.19 For immunolabeling of the c-Fos in the hippocampus of each brain, free-floating tissue sections were incubated overnight with rabbit anti c-Fos antibody (Santa Cruz Biotechnology, Santa Cruz, CA, USA) at a dilution of 1:1000, and the sections were then incubated for 1 h with biotinylated anti-rabbit secondary antibody (Vector Laboratories, Burlingame, CA, USA). The sections were subsequently incubated with avidin-biotin-peroxidase complex (Vector Laboratories, Burlingame, CA, USA) for 1 h at room temperature. Immunoreactivity was visualized by incubating the sections in a solution consisting of 0.05% 3,3-diaminobenzidine and 0.01% H2O2 in 50 mM Tris-buffer (pH 7.6) for approximately 3 min. The sections were then washed three times with PBS and mounted onto gelatine-coated slides. The slides were air-dried overnight at room temperature, and coverslips were mounted using PermountⓇ.
Data Analysis
To score the number of c-Fos positive cells in each area of the hippocampus, cell counting was performed using Image-ProⓇ Plus computer-assisted image analysis system (Media Cyberbetics Inc., Silver Spring, MD, USA) attached to a light microscope (Olympus, Tokyo, Japan). The number of c-Fos positive
65 Dose- and duration-dependent effects by ethanol on c-Fos expression in rat hippocampus
was counted hemilaterally and was expressed as number of cells per square millimeters (mm2) of cross- sectional area in each of the selected hippocampal regions.
Statistical Analysis
Statistical significance of differences was determined by one-way analysis of variance (ANOVA) followed by Scheffé’s Post-hoc analysis, and results were expressed as mean ± standard error mean (S.E.M.) of the number of c-Fos positive cells. Differences were considered significant for P<0.05.
RESULTS
Blood Ethanol Concentration
The serum ethanol concentration was 7.3 ± 1.4 mg/dl in the 0.5 g/kg ethanol-treated group, 58.3 ± 1.7 mg/dl in the 1 g/kg ethanol-treated group, 99.5 ± 2.1 mg/dl in the 2 g/kg ethanol-treated group, 268.2 ± 1.6 mg/dl in the 4 g/kg ethanol-treated group, and 0 or negligible in the control group.
Dose-dependent Effects of the Ethanol on c-Fos expression in Each Regions of Hippocampus
Photomicrographs of c-Fos positive cells are presented in Figure 1. As shown in Figures 1-4, ethanol dose-dependently decreased the c-Fos expression in the rat hippocampus. The number of c-Fos positive cells in the hippocampal CA1 region was 583.1±12.1/mm2 in the control group, 564.0±11.8/mm2 in the 0.5 g/kg ethanol-treated
Figure 1. Photomicrographs of c-Fos positive cells in each regions of hippocampus. Sections
were stained for c-Fos positive cells (reddish brown).
Scale bar represents 100 µm. Each black
allow indicates the c-Fos positive cells.
Figure 2. Dose-dependent effects by ethanol on c-Fos expression in the hippocampal CA1
region. A: Typical photographs of c-Fos positive cells in the hippocampal CA1 region. a,
Control group. b, 4 g/kg ethanol treated group. Scale bar represents 50 µm. Each black allow
indicates the c-Fos positive cells. B: Mean number of c-Fos positive cells in the hippocampal
CA1 region. Values are presented as mean ± S.E.M.
#represents P < 0.05 compared to the
control group.
$represents P < 0.05 compared to the 0.5 g/kg ethanol-treated group.
%represents
P < 0.05 compared to the 1 g/kg ethanol-treated group.
&represents P < 0.05 compared to the 2
g/kg ethanol-treated group.
16
Figure 1. Photomicrographs of c-Fos positive cells in each regions of hippocampus. Sections were stained for c-Fos positive cells (reddish brown). Scale bar represents 100μm. Each black allow indicates the c-Fos positive cells.
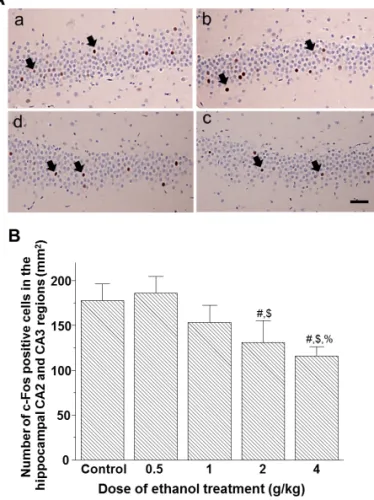
Figure 3. Dose-dependent effects by ethanol on c-Fos expression in the hippocampal CA2 and CA3 regions. A: Typical photographs of c-Fos positive cells in the hippocampal CA2 and
17
Figure 2. Dose-dependent effects by ethanol on c-Fos expression in the hippocampal CA1 region. A: Typical photographs of c-Fos positive cells in the hippocampal CA1 region. a, Control group. b, 4 g/kg ethanol treated group. Scale bar represents 50μm. Each black allow indicates the c-Fos positive cells. B: Mean number of c-Fos positive cells in the hippocampal CA1 region. Values are presented as mean ± S.E.M. # represents P<0.05 compared to the control group. $ represents P<0.05 compared to the 0.5 g/kg ethanol-treated group. % represents P<0.05 compared to the 1 g/kg ethanol-treated group. & represents
P<0.05 compared to the 2 g/kg ethanol-treated group.
66 Min-Chul Shin
group, 484.8±12.5/mm2 in the 1 g/kg ethanol-treated group, 339.7±9.2/mm2 in the 2 g/kg ethanol-treated group, and 272.9±8.1/mm2 in the 4 g/kg ethanol-treated group (Figure 2).
The number of c-Fos positive cells in both the hippocampal CA2 and CA3 regions was 177.5± 18.8/mm2 in the control group, 185.8±18.6/mm2 in
the 0.5 g/kg ethanol-treated group, 153.1±19.3/ mm2 in the 1 g/kg ethanol-treated group, 130.8± 24.4/mm2 in the 2 g/kg ethanol-treated group, and 116.1±10.3/mm2 in the 4 g/kg ethanol-treated group (Figure 3).
The number of c-Fos positive cells in the dentate gyrus of the hippocampus was 285.4± 27.1/mm2 in the control group, 317.4±11.0/mm2 in the 0.5 g/kg ethanol-treated group, 229.1± 17.4/ mm2 in the 1 g/kg ethanol-treated group, 163.0± 30.0/mm2 in the 2 g/kg ethanol-treated group, and 137.3±15.6/mm2 in the 4 g/kg ethanol-treated group (Figure 4). In the present results, the ethanol significantly suppressed the c-Fos expression
Figure 4. Dose-dependent effects by ethanol on c-Fos expression in the dentate gyrus. A: Typical photographs of c-Fos positive cells in the dentate gyrus. a, Control group. b, 4 g/kg
19
Figure 3. Dose-dependent effects by ethanol on c-Fos expression in the hippocampal CA2 and CA3 regions. A: Typical photographs of c-Fos positive cells in the hippocampal CA2 and CA3 regions. a, Control group (CA2 region). b, 4 g/kg ethanol treated group (CA2 region). c, Control group (CA3 region). d, 4 g/ kg ethanol treated group (CA3 region). Scale bar represents 50μm. Each black allow indicates the c-Fos positive cells. B: Mean number of c-Fos positive cells in the hippocampal CA2 and CA3 regions. Values are presented as mean ± S.E.M. # represents P<0.05 compared to the control group. $ represents P<0.05 compared to the 0.5 g/kg ethanol-treated group. % represents P<0.05 compared to the 1 g/kg ethanol-treated group.
Figure 5. Duration-dependent effects by ethanol on c-Fos expression in the hippocampal CA1 region. A: Typical photographs of c-Fos positive cells in the hippocampal CA1 region. a,
Figure 4. Dose-dependent effects by ethanol on c-Fos expression in the dentate gyrus. A: Typical photographs of c-Fos positive cells in the dentate gyrus. a, Control group. b, 4 g/kg ethanol treated group. Scale bar represents 50μm. Each black allow indicates the c-Fos positive cells. B: Mean number of c-Fos positive cells in the dentate gyrus. Values are presented as mean ± S.E.M. # represents P < 0.05 compared to the control group. $ represents
P<0.05 compared to the 0.5 g/kg
ethanol-treated group. % represents P<0.05 compared to the 1 g/kg ethanol-treated group.
dose-dependently in the rat hippocampus.
Duration-dependent Effects of the Ethanol on the c-Fos expression in the Rat Hippocampus
Duration-dependent effects of the ethanol on the c-Fos expression were next examined using 2 g/kg ethanol-treated group. The number of c-Fos positive cells in the hippocampal CA1 region was 599.1±12.4/mm2 in the control group, 600.5±10.5/ mm2 in the ethanol-treated group for 1 day, 366.9 ±11.0/mm2 in the 3-day-ethanol-treated group, and 269.3±9.8/mm2 in the 6-day-ethanol-treated
group (Figure 5).
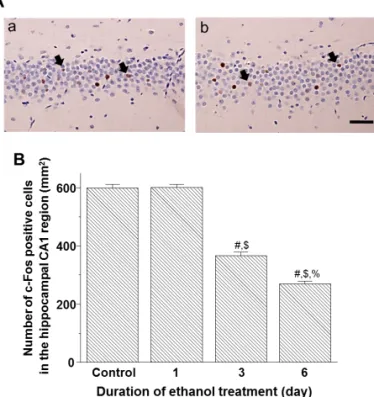
Also, the number of c-Fos positive cells on the CA2 and CA3 regions of the hippocampus was 180.7 ±4.5/mm2 in the control group, 173.0±6.2/mm2 in the ethanol-treated group for 1 day, 148.0±3.4/ mm2 in the 3-day-ethanol-treated group, and 110.2 ±5.1/mm2 in the 6-day-ethanol-treated group indicates the c-Fos positive cells. B: Mean number of c-Fos positive cells in the hippocampal
CA1 region. Values are presented as mean ± S.E.M. # represents P < 0.05 compared to the control group. $ represents P < 0.05 compared to the ethanol-treated group for 1 day. % represents P < 0.05 compared to the 3-day-ethanol-treated group.
22
Figure 5. Duration-dependent effects by ethanol on c-Fos expression in the hippocampal CA1 region. A: Typical photographs of c-Fos positive cells in the hippocampal CA1 region. a, Control group. b, 6 days ethanol treated group. Scale bar represents 50μm. Each black allow indicates the c-Fos positive cells. B: Mean number of c-Fos positive cells in the hippocampal CA1 region. Values are
presented as mean ± S.E.M. # represents
P<0.05 compared to the control group. $ represents P <0.05 compared to the ethanol-treated group for 1 day. % represents P<0.05 compared to the 3-day-ethanol-treated group.
Figure 6. Duration-dependent effects by ethanol on c-Fos expression in the dentate gyrus. A: Typical photographs of c-Fos positive cells in the dentate gyrus. a, Control group. b, 6 days ethanol treated group. Scale bar represents 50 µm. B: Mean number of c-Fos positive cells in
24
Figure 6. Duration-dependent effects by ethanol on c-Fos expression in the hippocampal CA2 and CA3 regions. A: Typical photographs of c-Fos positive cells in the hippocampal CA2 and CA3 regions. a, Control group(CA2 region). b, 6 days ethanol treated group (CA2 region). c, Control group (CA3 region). d, 6 days ethanol treated group (CA3 region). Scale bar represents 50μm. Each black allow indicates the c-Fos positive cells. B: Mean number of c-Fos positive cells in the hippocampal CA2 and CA3 regions. Values are presented as mean ± S.E.M. # represents P < 0.05 compared to the control group. $ represents
P<0.05 compared to the ethanol-treated
group for 1 day. % represents P<0.05 compared to the 3-day-ethanol-treated group.
68 Min-Chul Shin
(Figure 6).
The number of c-Fos positive cells on the dentate gyrus was 300.2±6.1/mm2 in the control group, 286.7±6.6/mm2 in the ethanol-treated group for 1 day, 177.4±7.4/mm2 in the 3-day-ethanol-treated group, and 145.8±8.0/mm2 in the 6-day-ethanol-treated group (Figure 7). In the present results, ethanol significantly decreased the c-Fos expression in a duration dependent manner.
DISCUSSION
In the present study, we demonstrated that the c-Fos expression in various hippocampal regions of acutely ethanol-intoxicated rats was reduced both dose- and duration-dependently. Ethanol consumption is known to have adverse effects on the hippocampus, a region of the brain that plays an important role in learning and memory.14,20,21 Evidences indicate that ethanol-induced learning and memory impairments are due to impaired cognitive processing of new information,22 caused by disruption of hippocampal functions.23 In addition, acute ethanol exposure impairs the induction of long-term potentiation.24-26
Ethanol impairs the acquisition of hippocampus-driven spatial memory in adolescence as well as adults.27 However, numerous studies have pointed out at the marked difference in the neurobeha-vioral potency of ethanol between juvenile and adult animals. The ethanol dose-response studies have shown that ethanol more potently inhibits the synaptic activity in hippocampal slices from juvenile rats than in those taken from adults.27,28 The c-Fos is induced by a variety of stimuli, and expression of the c-fos mRNA in the hippocampus has been used as a marker for neuronal activity.14,17 The c-Fos is an essential factor in encoding spatial memory, and the c-Fos expression in the hippocampal CA3 region has been shown to increase during spatial learning.19 The c-Fos expression was shown in this study to be suppressed by ethanol administration, and it was also reported that experience-dependent activation of the hippocampus is preferentially disrupted by ethanol.7,14 As put forth in these studies, substantial evidence indicates that acutely administrated ethanol disrupts cellular activity in the hippocampus and that this effect on hippocampal cellular activity is likely to contribute to ethanol’s deleterious effect on learning and memory.
In the present study, the number of the c-Fos positive cells in the hippocampus of young rats
Figure 7. Duration-dependent effects by ethanol on c-Fos expression in the dentate gyrus. A: Typical photographs of c-Fos positive cells in the dentate gyrus. a, Control group. b, 6 days ethanol treated group. Scale bar represents 50μm. B: Mean number of c-Fos positive cells in the dentate gyrus. Each black allow indicates the c-Fos positive cells. Values are presented as mean ± S.E.M. # represents P < 0.05 compared to the control group. $ represents
P<0.05 compared to the 0.5 g/kg
ethanol-treated group. % represents P<0.05 compared to the 1 g/kg ethanol-treated group.
the dentate gyrus. Each black allow indicates the c-Fos positive cells. Values are presented as mean ± S.E.M. # represents P < 0.05 compared to the control group. $ represents P < 0.05 compared to the 0.5 g/kg ethanol-treated group. % represents P < 0.05 compared to the 1 g/kg ethanol-treated group.
was decreased by ethanol administration in a dose- and duration-dependent manner. These results suggest that ethanol-induced suppression of the c-Fos expression in the various regions of the hippocampus may be an underlying of ethanol-induced disruption mechanism of hippocampal information processing, particularly in young rats.
REFERENCES
1 Holownia A, Ledig M, Menez JF. Ethanol-induced cell death in cultured rat astroglia.
Neurotoxicol Teratol 1997; 19: 141-146.
2 Ikonomidou C, Bittigau P, Ishimaru MJ, Wozniak DF, Koch C, Genz K et al. Ethanol-induced apoptotic neurodegeneration and fetal alcohol syndrome. Science 2000; 287: 1056-1060.
3 McAlhany RE Jr, West JR, Miranda RC. Glial-derived neurotrophic factor (GDNF) prevents ethanol-induced apoptosis and JUN kinase phosphorylation. Brain Res Dev Brain Res 2000; 119: 209-216.
4 Samson HH, Harris RA. Neurobiology of alcohol abuse. Trends Pharmacol Sci 1992; 13: 206-211.
5 Tapia-Arancibia L, Rage F, Givalois L, Dingeon P, Arancibia S, Beaugé F. Effects of alcohol on brain-derived neurotrophic factor mRNA expression in discrete regions of the rat hippocampus and hypothalamus. J
Neurosci Res 2001; 63: 200-208.
6 Beracochea D, Jaffard R. Memory deficits subsequent to chronic consumption of alcohol in mice: an analysis based on spontaneous alteration behavior. Behav Brain Res 1985; 15: 15-25.
7 Ryabinin AE. Role of hippocampus in alcohol-induced memory impairment: implications from behavioral and immediate early gene studies. Psychopharmacology 1998; 139: 34-43. 8 White AM, Matthews DB, Best PJ. Ethanol,
memory, and hippocampal function: a review of
recent findings. Hippocampus 2000; 10: 88-93. 9 Kuperman S, Schlosser SS, Kramer JR, Bucholz
K, Hesselbrock V, Reich T et al. Developmental sequence from disruptive behavior diagnosis to adolescent alcohol dependence. Am J
Psychiatry 2001; 158: 2022-2026.
10 Wang J, Patten SB. Alcohol consumption and major depression: findings from a follow up study. Can J Psychiatry 2001; 46: 632-638. 11 Eichenbaum H, Otto T, Cohen NJ. The
hippocampus: what does it do?. Behav Neural
Biol 1992; 57: 2-36.
12 Jarrard LE. On the role of the hippocampus in learning and memory in the rat. Behav Neural
Biol 1993; 60: 9-26.
13 Squire LR, Knowlton B, Musen G. The structure and organization of memory. Annu
Rev Psychol 1993; 44: 453-495.
14 Melia KR, Ryabinin AE, Schroeder R, Bloom FE, Wilson MC. Induction and habituation of immediate early gene expression in rat brain by acute and repeated restraint stress. J
Neurosci 1994; 14: 5929-5938.
15 Dragunow M, Faull R. The use of c-fos as a metabolic marker in neuronal pathway tracing. J Neurosci Methods 1989; 29: 261-265. 16 Morgan JI, Curran T. Proto-oncogene
transcription factors and epilepsy. Trends
Pharmacol Sci 1991; 12: 343-349.
1 7 D u n c a n G E , K n a p p D J , B r e e s e G R . Neuroanatomical characterization of Fos induction in rat behavioral models of anxiety.
Brain Res 1996; 713: 79-91.
18 Vann SD, Brown MW, Erichsen JT, Aggleton JP. Fos imaging reveals differential patterns of hippocampal and parahippocampal subfield activation in rats in response to different spatial memory tests. J Neurosci 2000; 20: 2711-2718.
19 He J, Yamada K, Nabeshima T. A role of Fos expression in the CA3 region of the hippocampus in spatial memory formation in rats. Neuropsychopharmacology 2002; 26: 259-268.
70 Min-Chul Shin
20 Parker ES, Birnbaum IM, Weingartner H, H a r t l e y J T , S t i l l m a n R C , W y a t t R J . Retrograde enhancement of human memory with alcohol. Psychopharmacology 1980; 69: 219-222.
21 Ryabinin AE, Miller MN, Durrant S. Effects of acute alcohol administration on object recognition learning in C57BL/6J mice.
Pharmacol Biochem Behav 2002; 71: 315-320. 22 Maylor EA, Rabbitt PM, James GH, Kerr SA.
Comparing the effects of alcohol and intelligence on text recall and recognition. Br
J Psychol 1990; 81: 299-313.
23 Squire LR, Zola-Morgan S. The medial temporal lobe memory system. Science 1991;
253: 1380-1386.
24 Wayner MJ, Armstrong DL, Polan-Curtain JL, Denny JB. Ethanol and diazepam inhibition of hippocampal LTP is mediated by angiotensin Ⅱ and AT1 receptors. Peptides 1993; 14: 441-444.
25 Randall RD, Lee SY, Meyer JH, Wittenberg G F , G r u o l D L . A c u t e a l c o h o l b l o c k s neurosteroid modulation of synaptic transmission and long-term potentiation in the hippocampal slice. Brain Res 1995; 701: 238-248.
26 Morrisett RA, Swartzwelder HS. Attenuation of hippocampal long-term potentiation by e t h a n o l : a p a t c h - c a l m p a n a l y s i s o f glutamatergic and GABAergic mechanisms. J
Neurosci 1993; 13: 2264-2272.
27 Markwiese BJ, Acheson SK, Levin ED, Wilson WA, Swartzwelder HS. Differential effects of ethanol on memory in adolescent and adult rats. Alcohol Clin Exp Res 1998; 22: 416-421. 2 8 L i t t l e P J , K u h n C M , W i l s o n W A ,
Swartzwelder HS. Differential effects of ethanol in adolescent and adult rats. Alcohol
Clin Exp Res 1996; 20: 1346-1351.