Political crisis and suspension of duty-free
access in Madagascar : assessment of impacts
on the garment industry
著者
Fukunishi Takahiro
権利
Copyrights 日本貿易振興機構(ジェトロ)アジア
経済研究所 / Institute of Developing
Economies, Japan External Trade Organization
(IDE-JETRO) http://www.ide.go.jp
journal or
publication title
IDE Discussion Paper
volume
422
year
2013-07-01
INSTITUTE OF DEVELOPING ECONOMIES
IDE Discussion Papers are preliminary materials circulated to stimulate discussions and critical comments
Keywords: Manufacturing Exports, Garment Industry, Political Crisis, Duty-free Access, Employment, Madagascar
JEL classification: D21, F14, F16, J63, L67, O55
§: This is the second version revised in August 2013.
†: Africa Study Group, Area Studies Center, IDE ([email protected])
IDE DISCUSSION PAPER No. 422
Political Crisis and Suspension of Duty-free
Access in Madagascar: Assessment of Impacts
on the Garment Industry
§Takahiro Fukunishi †
July 2013
revised in August 2013
Abstract
The export-oriented garment industry in Madagascar has displayed robust growth, thus both contributing to the economy and creating formal employment opportunities. However, it experienced a critical situation after the political turmoil that occurred in 2009. Our investigation using the trade data demonstrates that suspension of duty-free access to the US market (AGOA) resulting from the turmoil had a greater impact on exports, 64%–78% reduction, than the turmoil itself. Our original factory-level data demonstrates that AGOA suspension increased the probability of closure by 57.8% for the factories supplying exclusively to US market, and reduced 6405 jobs for low-skilled positions during the post turmoil period. The factory-level adverse impacts are much less than those on export value at the industry level because of the maintained duty-free access to EU, which has provided an alternative market. It suggests that if EU also had cancelled duty-free access, adverse impacts would have been enormous. Given the general pattern of comparative advantage in low-income countries, unplanned cancellation of duty-free access for them hurts labor-intensive industries and low-skilled workers.
The Institute of Developing Economies (IDE) is a semigovernmental, nonpartisan, nonprofit research institute, founded in 1958. The Institute merged with the Japan External Trade Organization (JETRO) on July 1, 1998.
The Institute conducts basic and comprehensive studies on economic and related affairs in all developing countries and regions, including Asia, the Middle East, Africa, Latin America, Oceania, and Eastern Europe.
The views expressed in this publication are those of the author(s). Publication does not imply endorsement by the Institute of Developing Economies of any of the views expressed within.
INSTITUTE OF DEVELOPING ECONOMIES (IDE), JETRO
3-2-2, WAKABA,MIHAMA-KU,CHIBA-SHI
CHIBA 261-8545, JAPAN
©2013 by Institute of Developing Economies, JETRO
No part of this publication may be reproduced without the prior permission of the IDE-JETRO.
Political Crisis and Suspension of Duty-free Access in Madagascar:
Assessment of Impacts on the Garment Industry
§Takahiro Fukunishi†
Abstract
The export-oriented garment industry in Madagascar has displayed robust growth, thus both contributing to the economy and creating formal employment opportunities. However, it experienced a critical situation after the political turmoil that occurred in 2009. Our investigation using the trade data demonstrates that suspension of duty-free access to the US market (AGOA) resulting from the turmoil had a greater impact on exports, 64%–78% reduction, than the turmoil itself. Our original factory-level data demonstrates that AGOA suspension increased the probability of closure by 57.8% for the factories supplying exclusively to US market, and reduced 6405 jobs for low-skilled positions, which accounted for 27.8% of the total job losses during the post turmoil period. The factory-level adverse impacts are much less than those on export value at the industry level because of the maintained duty-free access to EU, which has provided an alternative market. It suggests that if EU also had cancelled duty-free access, adverse impacts would have been enormous. Given the general pattern of comparative advantage in low-income countries, unplanned cancellation of duty-free access for them hurts labor-intensive industries and low-skilled workers.
Keywords: Manufacturing Exports, Garment Industry, Political Crisis, Duty-free Access, Unemployment, Madagascar
§ This is the second version revised in August 2013.
† Institute of Developing Economies (IDE), [email protected]. The author thanks Kenta
Goto, Toshihiro Kudo, Momoe Makino, Owen Ozier, Herinjatovo Aimé Ramiarison, John Thoburn, Tatsufumi Yamagata, participants of the CSAE Conference at Oxford University, series of workshops in Antananarivo, and the internal seminar at IDE for their helpful comments. This work is supported by JSPS KAKENHI (Grand-in-Aid for Scientific Research C, 21530289).
1 Introduction
1.1. MotivationThe garment industry in Madagascar is one of the few manufacturing industries in sub-Saharan Africa that have successfully penetrated the export market. Triggered by foreign direct investment from Mauritius, garment exports started to grow in the early 1990s under duty-free access to the EU and US markets. Although the industry experienced adverse shocks in the 2000s, namely, the political turmoil in 2002 and the liberalization of the apparel market in 2005, garment exports’ growth did not collapse. On the contrary, Madagascar’s garment industry overcame the trade liberalization that eliminated quotas on main garment exporters and resulted in the reduction of exports from other African and Latin American countries. Reaching its highest export value in 2007, Madagascar’s prospective growth seemed promising.
The garment industry provides a large number of jobs, particularly for female and low-skilled workers in developing countries. Employment in this industry is open to workers who have not completed primary education, and the wage is substantially higher than that offered by the informal jobs that are an alternative for unskilled garment workers (Lopez-Acevedo and Robertson, 2012). The same trend is observed in Madagascar (Glick and Roubaud, 2006; Nicita, 2006; Fukunishi and Ramiarion, 2011). In 2008, the garment industry was estimated to employ more than 100,000 workers (Ministère de l’Economie et de l’Industrie 2009), majority of whom (over 80% according to our survey) occupied positions accessible to unskilled workers. Assuming continued improvement of working conditions, the industry’s growth was expected to reduce poverty (Glick and Roubaud, 2006).
However, this growth trend was disrupted by the financial crisis in 2008, and recovery was suffocated by further political turmoil occurring in 2009. A collision between the president and former mayor of the capital city caused a series of riots that ended with the president being replaced following the incursion of the army into the presidential palace. This upheaval not only degraded the business environment but also led, in January 2010, the US government to revoke Madagascar’s duty-free access (African Growth and Opportunity Act: AGOA). In contrast to the recovery of the export markets following the financial crisis, garment exports from Madagascar continued to decrease throughout 2010, and exports to the US recorded a reduction of 74.0% (UN Comtrade). Although such a reduction in the largest export-oriented industry must have adversely impacted the economy and poverty levels, changes in the industry have so far
not been examined to the author’s knowledge. In particular, demand shocks caused by the financial crisis complicate identification of adverse effect resulting from the political crisis and AGOA suspension. For instance, ILO and UNDP (2011) reported that 336,000 jobs were destroyed by the political and financial crisis, of which the industry sector had the largest share, 37.7%.1 However, it remains unclear as to how many of these losses can be attributed solely to the political crisis.
Using the original firm dataset containing information from 2008 to 2010 as well as trade data, this paper explores changes in Madagascar’s garment industry after the political crisis. In particular, we investigate the impact of the political crisis and suspension of AGOA in order to understand the effect of domestic and international politics on industrial performance. We focus on the impact this political instability had upon export volumes, factory closures, and employment levels. Identification of the impact of AGOA suspension is made through comparison of exports to the US market and those to the EU market because the EU maintained duty-free access after the political crisis as well as shared major market shocks unconnected to Madagascar’s political crisis, such as the financial crisis, with the US market. For a factory-level analysis, we compare factories exporting to the US with those exporting to other markets, mostly the EU. On the other hand, identification of the impact of the political turmoil rests on comparison with other exporting countries because all garment firms in Madagascar were more or less affected by it, and we do not have the data on the direct factory-level impact of the political turmoil. Therefore, investigation of the political crisis’s impact is restricted to examining changes in export volumes using the trade data.
This paper is structured as follows. In the next section, our methodology of identification and data collection is described. The third section presents our data on changes in export volumes and analyzes the impact of the political turmoil and AGOA suspension. Firm closures, firm-level production, and employment levels are investigated in the fourth section. The final section concludes our discussion.
2. Methodology and Data
Methodology of IdentificationIn 2008, Madagascar erupted in political turmoil following a conflict between President
1 Their definition of job destruction includes reduction of wages and working hours. The number of
Marc Ravalomanana and Mayor Andry Rajoelina of Antananarivo. Rajoelina criticized Ravalomanana for his abuse of power at political meetings in Antananarivo that reportedly attracted tens of thousands of citizens. Amidst increasing tension as evidenced by violent attacks on public buildings, the army, which supported Rajoelina, attacked and occupied the Presidential Palace in March 2009. This attack led to the resignation of Ravalomanana and to the emergence of Rajoelina as president in a transitional government. The US and many other countries, as well as the African Union, did not recognize this change in presidency as it occurred without a democratic election. Thus, the US government suggested the suspension of Madagascar’s eligibility in AGOA, which imposes several conditions on participating states, including democratic rule. Although eligibility was maintained through 2009, the US suspended AGOA for imports from Madagascar in 2010 because of the insignificant progress that the country had made toward holding elections. In contrast, market access to the EU market did not change after the crisis. Duty-free access was granted to Madagascar under the Cotonou Convention until 2007 and under the interim Economic Partnership Agreement (EPA) with EU after 2008. Market access under the interim EPA is similar to that enjoyed under AGOA, which applies a single transformation to the rule of origin; i.e., for typical apparel products, only the sewing process needs to be undertaken in an exporting country using imported fabrics.
We attempt to identify the effect of the political turmoil on industry performance. Because all garment firms suffered from the confusion caused by the political turmoil, and the financial crisis coincided with it, identifying its effect requires information from outside Madagascar. For estimation of impacts on export, international trade data allows us to isolate the effect of the political turmoil from various other factors common to Madagascar and other garment exporting countries by using the difference-in-differences (DID) technique. However, because we do not have comparable garment firm data from other countries, the impact of the political crisis on factory-level changes, e.g., factory closures and employment, cannot be estimated.
As a comparator of Madagascar, five low-income countries that export apparel products both the US and EU markets are chosen. Type and quality of exported apparel products is roughly correlated with income level of exporting country. Given low quality in infrastructure and business environment and lack of worker’s (and possibly manager’s) skill, low-income countries exports mainly basic apparel products that does not require
quick delivery but low costs.2 Since change of market demand is likely to differ by type
of products, appropriate comparator countries that shares same market changes with Madagascar are low-income countries. To avoid extraordinary fluctuation in export, exporting countries that take share in both US and EU markets with more than 0.1% respectively are selected. Following the definition of low-income country by the World Bank, Bangladesh, Cambodia and Vietnam remain. To increase the number of comparators, we included those which income level is just above the low-income threshold, namely India and Pakistan.3
The methodology requires the assumption that nothing systematically and differently affected changes of exports from Madagascar compared with other countries, except Madagascar’s domestic political turmoil. Because the suspension of AGOA is the most likely factor to generate differential changes in exports between Madagascar and other countries, analysis is restricted to the period before 2009 or export to the EU market.
The identification of the effect of AGOA suspension is more feasible by comparing exports or exporters to the US market with those to other markets because access to non-US markets, particularly the EU, did not change after 2009.4 Because some
firms export to both US and other markets, we made the following two comparisons: factories whose supply markets include the US with those not supplying to US and factories exclusively supplying to the US with those not supplying to US. The former captures the impact on all affected factories, although it may not identify significant impacts if factories supplying both US and other markets are affected substantially less. In contrast, the latter can detect the impact more clearly but only captures part of the
2 Lall and Wignaraja (1994) argues that requirement for skill of workers and managers varies by
quality of products. Thoburn (2009, p8-9) briefly explains buyer’s selection of a sourcing country based on delivery time. Other than type and quality of products, change of the market demand for an individual exporting country may differ by range of processes undertaken in the country. In most factories in low-income country undertake only assembling process (cut, make and trim: CMT), while other services such as purchasing fabrics, arranging logistics and designing are occasionally provided by factories in India and Bangladesh (Gereffie and Frederick 2010). Working conditions is another increasingly important issue in selection of suppliers (Barrientos et al. 2011). Nevertheless, their effects on import demand in the US and EU markets are not clear yet.
3 Selection is based on situation in 2008. Per capita GNI of India and Pakistan are $1050 and $940
respectively, while the threshold of low-income group is $975 (World Bank 2013). Madagascar’s GNI per capita is $400.
4 Access to the EU market applied to least developed countries (LDC) changed in 2011 with the
relaxing of the rule of origin from double to single transformation, which is equivalent to the one applied to Madagascar. While it affects performance of Madagascar’s exporters to the EU market, it does not affect our analysis until 2010.
impact.5
Our underlying assumption is that nothing systematically and differently affects changes of exports or exporters to the US market compared with those to the EU market, except the suspension of duty-free access. If there were differential demand shocks between the two markets, e.g., heterogeneous shocks stemming from the financial crisis, the assumption does not hold. To avoid this possible bias, we apply the difference-in-differences-in-differences (DIDID) method, which takes the difference in changes of export volume in the US market along with that in the EU markets arising from Madagascar and same difference arising from other exporting countries. Considering only two periods, namely 2009 and 2010, and two countries for simplicity, it is expressed as follows:
(
) (
)
[
]
(
) (
)
[
OtherUS OtherUS OtherEU OtherEU]
EU MDG EU MDG US MDG US MDG V V V V V V V V DIDID , 2009 , 2010 , 2009 , 2010 , 2009 , 2010 , 2009 , 2010 ln ln ln ln ln ln ln ln − − − − − − − = where VMDG,US 2010
ln is the log of the value of imports from Madagascar to the US in 2010 and VOther,US
2010
ln is the log of the value of imports from another country. This setup allows for changes in demand in markets irrelevant to AGOA suspension to be excluded from our estimation. For factory-level changes, DIDID cannot be applied, and its estimation, based on DID, is susceptible to possible violation of the assumption mentioned earlier. Possible bias is tested later.
Systemic differences in characteristics between control and treatment groups, namely exporters to the US and those to other markets are controlled. By incorporating factory-level fixed or random effects, any time-invariant heterogeneity that may correlated with choice of supply market is controlled.6 Considering the possible problems
in our underlying assumptions, the applied methodology provides an approximation of its effects.
Data
We used two types of data: trade statistics and original firm-level data. The export values
5 Factory-level information on supply markets composition is not available for many firms. In the
latter comparison, factories supplying both US and other markets are excluded from the control groups, as they are partially affected by AGOA suspension.
6 For analysis of factory closures, related covariates are controlled instead of fixed effects in the
and quantities were investigated using the import data for the US and EU in the World Trade Atlas, which contains EUROSTAT and US International Trade Commission data.
The author conducted a series of firm surveys from 2009 to 2011 jointly with the Observatoire pour le Développement national des Ressources humaines du niveau de l’Enseignement Supérieur at the University of Antananarivo. Although the survey covered both exporting and non-exporting firms, this paper utilizes only the former. Each survey collected information concerning the immediately preceding fiscal year, i.e., FY2008, FY2009, and FY2010 (hereafter referred to as survey 2008, 2009, and 2010). The firm data for 2008 included 98 factories of export-oriented garment firms, regardless of the export processing zone (EPZ) status, randomly sampled from the two different firm lists of EPZ and non-EPZ firms. Our EPZ samples contain 64.9% of the EPZ population. The EPZ list contained 131 firms in 2008, whereas the exact size of the non-EPZ population is unknown because the list includes firms closed at the time of the survey. The factories visited in the 2008 survey were followed up in subsequent surveys.7 Given the non-negligible number of factories that closed between the surveys, we carefully confirmed closure both by telephone and a personal visit. Moreover, if a firm changed its name without substantial alteration of ownership, we regarded it as the same firm.
3. Changes in Export Volume
Exports to the US and EU markets from Madagascar decreased in 2008 by 4.9%, and this reduction grew substantially to reach 18.0% in 2009 and 38.5% in 2010. The reduction was much greater for exports to the US, with a 74.0% reduction subsequent to the suspension of AGOA in 2010 (Figure 1). In contrast, exports to the EU recorded substantial growth of 28.0% in 2011, with volume hitting a record high. However, the trend until 2009 is not unique to Madagascar but somewhat common to all major garment exporters. Given the financial crisis that hit developed countries, many garment exporters experienced slowing growth in 2008, and by 2009, most of them recorded negative growth. While the reduction in Madagascar’s trade was relatively large among the major exporters, it was nevertheless comparable with Cambodia’s, which recorded a reduction of 18.7% in 2009.
To separate the effect of the domestic political turmoil from overall changes in
exports, we use the world export trend as a control. The estimation model is follows: m c i t t c t m c
i turmoil year product country market
V,, , 0 1 , * * ,,
ln =a +a +τ + ,
where lnV represents the log of the value of imports in the US or EU market at the six-digit product level in the Harmonized System (HS). turmoil is a dummy variable and takes one for imports from Madagascar after 2009, year is a dummy for a set of years, product*country*market represents the fixed effect, and i, c, m, and t indicate a product at the six-digit level, country, market, and time, respectively.8 The DID estimate is α
1, and a
triple interaction term is incorporated to control the possible effect of AGOA cancellation. We also estimated the above model using import value only in the EU market, dropping the triple interaction term.
The observations with zero import value are included so that both extensive and intensive margins are estimated. For these observations, 1 (dollar) is inserted to get the logarithm. To see sensitivity of including these censored observation, Tobit model with random effect are applied in addition to OLS with fixed effect. Table 1 reports the results of these estimations. Columns 1 and 2 show the effects of the political turmoil on exports to US and EU markets in 2009, which are negative and significant only in the Tobit model. Estimated effects in the EU market in 2009 and 2010 are negative and significant (columns 3 and 4). For those with statistical significance, estimated impact ranges from 31.1% to 45.3% with larger effect in Tobit model as expected. Point estimates are larger in the models covering only the EU market, but no significant difference in impacts between US and EU markets in 2009 is observed when they are estimated separately (Table A3). Rather, it is due to the larger estimated impact in 2010 (Table A4).
For measurement of the impact of AGOA suspension, DIDID using imports in the US and EU markets from six low-income countries is applied in the following form:
(
)
(
)
(
)
m c i t t c t m c t m t m c i market country product year y MDG y US MDG y US V , , 3 2 1 0 , , , * * 2010 2010 2010 ln + + × + × + × × + =γ γ γ γ . where US is a market dummy (equal to 1 if observations represent import values in the US), y2010 is a dummy for year 2010 when AGOA becomes suspended, and MDG represents a dummy for a country from which a product is exported (it equals 1 if an observation represents exports from Madagascar and 0 if it represents exports from the8 Compared with the standard DID model, we added year dummies and applied the product-country-
market fixed effect rather than the product fixed effect and market and country dummies to allow for flexibility in the base level.
other countries). The triple DID estimate is γ1.
Table 2 shows the results (column 1 and 2). The effect of AGOA suspension is shown in the coefficients on the triple interaction term (US*y2010*MDG). In both models, the coefficients are negative and very large. The DIDID estimate by OLS with fixed effects indicate that the AGOA suspension decreased the value of imports by 63.6% on an average at the six-digit product level, and the Tobit estimate shows a 78.1% reduction. Suspension of the duty-free access made larger impact than the political turmoil. Note that the DIDID results indicate that if impact is estimated by DID of US import from Madagascar and EU import, estimate entails downward bias. DID estimation does not isolate common changes of import in the market from changes specific to import from Madagascar, and the former changes is negative and significant as indicated by the coefficient of y2010xUS in the DIDID model. Therefore, DID estimate of effect of AGOA suspension will be smaller than estimate by DIDID, and thus, adverse effect will be overestimated. We run DID model and found that estimated impact is larger by 4.5%– 12.7% than those in the DIDID model (column 3 and 4). This result has significant implication on the estimation of factory-level impact of AGOA suspension described in the next section.
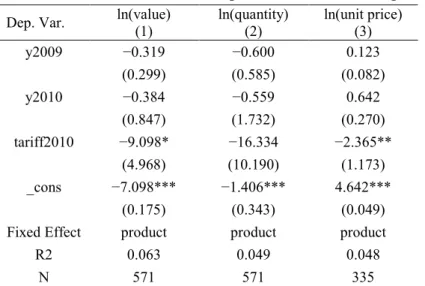
The suspension of AGOA brought Madagascar’s products under an MFN tariff, which is defined at the HS eight-digit level. We investigated whether tariff rate was related to the degree of reduction in exports. In particular, we set the tariff rate at zero for all observations in the US before 2009, whereas the MFN rates were set for 2010 observations in the US.10 The effect of tariff rate on import value and quantity is relatively large and negative but significant only for import values (columns 1 and 2 in Table 3). This result implies that the imposition of a tariff has a clearer impact on price than on the quantity of exports. In fact, the tariff rate is negatively correlated with unit price (column 3 in Table 3). The estimated coefficients indicate that a 1% increase in tariffs leads to price declines of 2.3% and to an 8.7% (= exp[−9.098/100] − 1) reduction in exports’ value. Note that after controlling the tariff rate, the 2010 year dummy was no more significant; i.e., the reduction from 2008 to 2010 was largely correlated with an increase in tariffs.
10 The tariff rate is obtained from the U.S. International Trade Commission website. For a few
products, tariff is not ad valorem. We converted in the ad valorem form by dividing tariff per weight by average unit value per weight; i.e.,
unit value tariff unit value weight weight tariff ∗ = .
4. Changes at Factory Level
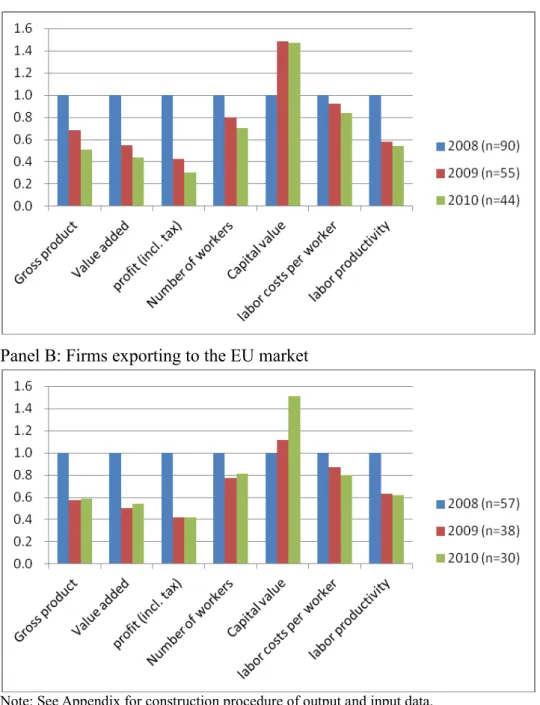
4.1 Production and SurvivalReflecting the decline in exports, the subsequent reduction in production was substantial among our samples. Using the 2008 figures as a base, the average gross product declined by 30.7% in 2009 and 47.1% in 2010 (Figure 2). Both value added and profit recorded even greater reductions. However, the changes in employment were more moderate than output, with average employment levels declining by 12.5% in 2009 and 28.1% in 2010. Consequently, labor productivity, or output per worker, declined after 2009. A slightly different trend emerges when we focus on changes in exporters to the EU market. For them, following a substantial reduction in 2009, this decreasing trend halted in 2010 for gross product, value added, profit, and employment.
The adverse effects stemming from the crises accelerated the closure of exporting factories. Approximately one-quarter of exporting factories in our sample closed between August 2009 and November 2011, occurring with a far higher frequency among exporters to the US market.11 Note that we checked for closure when we visited a
factory for the survey to verify a factory’s operation status in 2009, 2010, and 2011. Table 4 shows the frequency of factory closures on the basis of supply market as of 2008. While 68.4% of the factories that exported exclusively to the US market closed, only 16.4% of the factories that exported to other markets closed and 14.3% of factories that exported to both the US and other markets closed. In addition, note that closures were far more frequent in 2009–10 than in 2010–11; i.e., as soon as AGOA suspension was applied, exporters to the US market decided to close.12 This response indicates that switching
markets is not easy and requires substantial costs; hence, majority of exporters that supplied only to the US market opted to close rather than search for buyers in other markets. Surviving factories switched supply market from US to the other countries. Share of factories exclusively exporting to US market fell from 19.4% in 2008 to 5.3% in 2011, and share of the factories exporting both US and other market also decreased from 16.3% to 10.5% (Table 5).
We again investigate the impact of AGOA suspension on factory closure rates by
11 We confirmed closure by contacts over the telephone and by visiting a factory. If a firm changed its
name without substantial alteration of ownership, we regarded it as the same firm.
12 Note that since our survey captures factory closure occurred from August 2009 to November 2010,
comparing exporters to the US and other markets. Our estimates are based on the duration model, which analyzes the length of time until the state of observations changes (in this case, a factory’s closure). In particular, the probability of closure given the length of the operation is compared between exporters to the US and other markets, and the DID of operation status is estimated.13 It should be noted that the DID estimate is likely to be biased downward, and thus impact is overestimated, as the estimates in the previous section suggest that demand in the US market decreased relative to the EU market in 2010.
As many closed factories are observed only once in our dataset, fixed effects cannot be included. Therefore, variables relevant to factory closures are included as control variables in the duration model. Following the literature, these include productivity, type of ownership (local or foreign, and independent or subsidiary), factory size (employment), and age of factory, while a subcontract dummy (it is 1 if a factory mainly works for subcontract) is added to pick up possible differences in demand. Subcontract orders, called CMT in the garment industry, tend to be more susceptible to fluctuations of demand as garment firms ask for CMT when they have excessive orders beyond capacity. For productivity, we used two different measures: one is total factor productivity as measured by the index number method and the other is labor productivity.14 For identification of the AGOA effect, two dummy variables representing
the supply market in 2008 are incorporated; one is to identify a factory supplying to the US market and the other is to discern one exclusively supplying to the US. All regressors except the market dummies are lagged by one year, and the dependent variable is a dummy that takes one if a factory has closed, or zero otherwise.
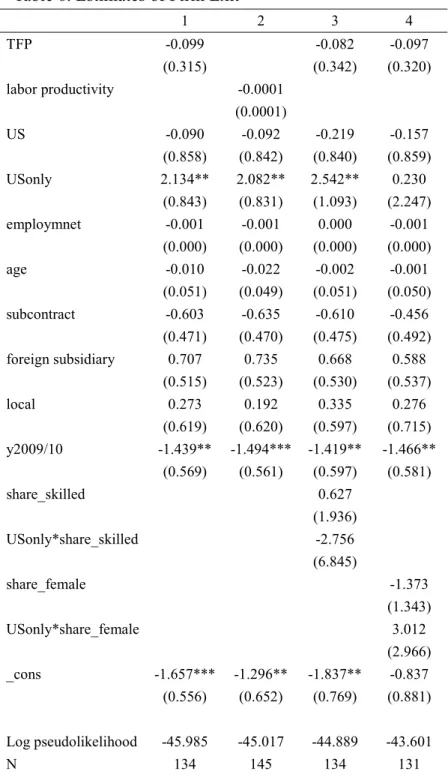
The results show that the coefficient of the US-market dummy (US) was not significant, whereas that for a dummy indicating supply exclusive to the US market (USonly) is both positive and significant (Table 6). This finding indicates that factories exporting to other markets as well as to the US were not affected, whereas those that supplied the US exclusively were more likely to close. Holding all other variables at mean value, the exit rate of factories relying solely on the US market is higher by 57.8% than others. While we should be cautious with possible overestimation of the impact, AGOA suspension still caused factory closure given extent of overestimation for the
13 A duration model differs from a binary response model (i.e., probit and logit) in consideration of the
length that observations were in an initial state. It estimates the likelihood that an initial stage ends in the next period on the condition that it has been in an initial state (Jenkins [2004]). The details of the estimation model are described in Appendix 2.
impact on export value identified in the previous section. Note that the negative significant coefficient on the year dummy for 2009/10 indicates that closure was more frequent between late 2009 and early 2010, immediately before and after the suspension. We checked the robustness of the result by controlling unobserved heterogeneity, which may have yielded an underestimation of coefficients (Jenkins 2004). However, the main results remained unaltered (Appendix 2).
Note that the coefficients of the two measures of productivity are negative, which means that higher productivity reduced the probability of closure but not to a statistically significant degree. Even when the interaction terms of productivity and market dummy was added to control differential impact between the US and other markets, it did not yield a significant effect (not reported). This result contrasts with empirical literature on firm turnover, which mostly reports negative, significant correlation between productivity and closure15. Given uncertainty regarding the length of the suspension, there can be substantial heterogeneity in managers’ expectations toward continuation of the AGOA suspension, which may obscure relationship between productivity and closure. In any case, the irrelevance of productivity with factory closure inflated adverse effects because not only less-productive exporters but also productive ones disappeared.
4.2. Employment
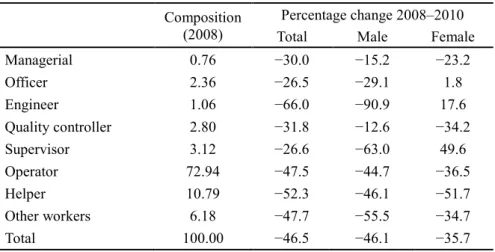
Given the substantial contribution of the garment industry toward poverty reduction, changes in employment levels—and subsequent income levels—count as one critical outcome of the political turmoil and resultant cancellation of the preferential market access. In our sample, 26,611 jobs, distributed across all positions and accounting for 46.5% of total jobs, were lost between 2008 and 2010 (Table 7). Among them, job losses in low-skilled positions, namely helper and operator, totaled 23,053. Reduction rate was higher in male workers than female workers. As expected, exporters to the US market accounted for majority of job losses, and in particular, 90.2% of job losses for female workers occurred in exporters to the US. Job losses in low-skilled positions were not only greater in number but also more intensive than high-skilled position losses (Table 8). Employment changes after 2009 were clearly anti-poor.
Next, we attempt to identify the impact of AGOA suspension on the employment
15 However, some empirical studies in Africa provided somewhat weak relationship. Söderbom et al.
(2006) finds significant positive relationship between productivity and firm survival only for large firms, and Shiferaw (2007) reported a quarter of firms in the most productive quintile also exited.
rate of low-skilled and female workers, who are the poorest in the garment industry. As seen above, employment decreased both through a reduction of workers in the factories that did continue operations (intensive margin) and through outright factory closures (extensive margin). The impact of the two margins is estimated separately.
Employment of Low-skilled Workers
The result shown in the previous subsection suggests that AGOA suspension had a significant impact on the employment through factory closure. Before the political crisis, the firms exporting exclusively to the US market employed 11,081 low-skilled workers. If all those exporters suffered the same probability of closure, our estimation result indicates that 57.8% (which is the probability of closure attributed to AGOA suspension) of low-skilled employment losses were due to the suspension. While the previous section’s result shows that no firm characteristics, except supply market, affected factory closure, we further investigate the relationship between skill intensity (ratio of high-skilled to low-skilled workers) and the probability of closure because it has direct impact on reduction of low-skilled employment. In particular, the share of low-skilled workers and its interaction term with a US-market dummy were included in the duration model. They are not significantly associated with the probability of firm closure (Column 3 in Table 6), and thus, there is no evidence that AGOA suspension led to closure of factories with high (or low) intensity of low-skilled workers.
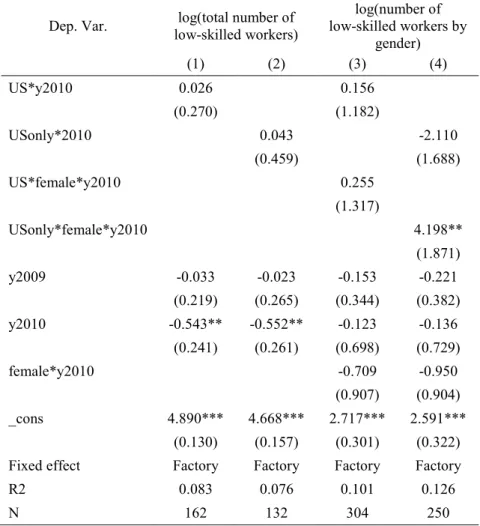
The impact of AGOA suspension on factories continuing their operation is investigated with respect to number of low-skilled employees and changes in skill intensity. The latter examines if the higher reduction rate in low-skilled employees can be accounted for by AGOA suspension. We again apply the DID method to our sample factories. For the number of low-skilled employees, the following simple estimation model is applied:
(
)
t i l t i US y year factory L ,, = 0 + 1 × 2010 i.g.t + + ln δ δ ,where lnLli,t is the log of the number of low-skilled employees (helper and operator) in
factory i at time t, and US is the dummy for the export market (it is 1 if a factory exported to the US in 2008), y2010 is the dummy for year 2010, which is the period of AGOA suspension, year is the year dummy (2008 is a base), and factory is the factory fixed effects. The impact of AGOA suspension is captured by δ1. As before, two types of
market dummy are used; one concerns the factories exporting to the US (including those exporting to both the US and other markets), and the other captures those exporting
exclusively to the US market.
As for the effect on skill intensity, we estimated changes of skill composition (skill intensity) among surviving factories. This skill effect is based on the following model:
(
)
(
)
i t i t i t p t p i t p t p i factory year US position y US US position US y position y position L + + + + + + + + = 5 4 3 φ φ φ φ φ 2 , 1 , , , 2 , 1 0 , , 2010 * * ) * 2010 * ( ) 2010 * ( ln η η η , where lnLi,p,t is the log of the number of employees in factory i in position p at time t, andposition is the set of dummies for eight positions, in which helper, the least skilled job, is the base category.16 The overall change in skill intensity among the entire sample of
factories regardless of supply market is represented in φ1. A positive result indicates that
the reduction in employment in position p is smaller than that in the helper (the base category); hence, it means skill intensity has increased. The impact specific to exporters to the US are captured by 𝜂1 and φ2; the former presents an employment change for a
helper and the latter picks up changes in other positions relative to helper. If φ2 is
positive, skill intensity increases specifically among exporters to the US market, and therefore, AGOA suspension raised skill intensity.
The results of the first estimation model are presented in Table 9. In column 1, negative significant coefficients on y2010 show that the number of low-skilled employees reduced significantly in 2010 over the entire sample of factories by 41.9% (= exp(−0.543) − 1), whereas no additional reduction was found for exporters to the US market as shown in the coefficient of US*y2010. The same pattern can be observed for the comparison of exporters exclusively to the US and those exporting to other markets (column 2). It indicates that AGOA suspension had no adverse effect on the employment of low-skilled workers in continuing factories. Our estimation with the Tobit model incorporating random effects produced similar results (not reported).
The estimation of the second model is presented in Table 10, in which the first column indicates changes applying to the entire sample of factories (φ1) and the second
column shows additional changes relevant only to exporters to the US market (𝜂1, φ2). In
the first column, the estimated coefficient for helper is negative and significant, whereas those for other positions are positive, with statistical significance observed for both officer and quality controller. This means that reductions tended to be milder in high-skilled positions, which is consistent with the findings shown in Table 8. In the
second column, the coefficient for helper is positive and significant, which cancels out the negative change in the first column. This indicates that the amount of helpers did not decrease in exporters to the US market but rather increased on average. On the other hand, the negative coefficients for other positions, which are significant for engineer, quality controller, and supervisor, indicate that the number of high-skilled jobs decreased. This trend is clearer in the Tobit estimation (column 3 and 4). Therefore, AGOA suspension tended to reduce skill intensity; i.e., it raised the share of low-skilled workers in the workforce.
In sum, AGOA suspension caused a reduction in low-skilled employment of 57.8% through factory closures, 6405 jobs at most, whereas it made no impact on employment levels in the factories that continued operation. Moreover, impact on the lowest-skill position, helper, were smaller than those affecting more skilled positions. Despite possibility of overestimation, estimated impact of AGOA suspension on employment is relatively small in comparison with that on export: estimated loss of employment accounts for only 27.8% of total loss of low-skilled jobs. This is mainly because AGOA suspension did not affect closure of the factories that exported to non-US market as well as US market before the turmoil, and it also did not affect employment of the surviving factories. Those surviving factories shifted to non-US markets, mostly the EU market, after 2009. These results indicate that duty-free access to the EU market that is maintained after the political turmoil has substantially mitigated the adverse impact of AGOA suspension on the industry.
Employment of Female Workers
Table 7 shows that exporters to the US accounted for more than 90% of the reduction in female low-skilled employees. This implies that exporters to the US that closed after 2009 employed more female workers than other factories and/or that exporters to the US who continued operation reduced female workers in greater numbers than exporters to other markets. Table 11 indicates that both are possible scenarios. The share of female workers was 72.4% in exporters to the US market that closed, whereas it was 50.8% in all exporters, suggesting closing factories employed female workers at a higher rate. Among continuing exporters, female employment reduced by 35.1% for those supplying the US market and by 17.4% for those supplying other markets.
The effect of AGOA cancellation on female employment through factory closures is estimated by incorporating the share of female workers and its interaction with the US dummy in the duration model. In Table 6 (column 4), the interaction term has a
very large and positive effect, which means that it increases the probability of closure substantially, but it is not significant because of large standard errors. The result suggests that exporters to the US having a high ratio of female employees were not more likely to close. Although this appears inconsistent with Table 11, these two contrasting results indicate that high female employment share was not common among the closing factories but rather only present in a few large factories.
The impact on employment in factories continuing to operate is explored by the following estimation model:
(
)
(
)
(
)
i t l t g i factory year y US y female y female US L + + × + × + × × + = 2010 2010 2010 ln , , l0 l1 i.g.t l2 g,t l3 , where lnLli,g,t is the log of the number of low-skilled employees (helper and operator) in
factory i of gender g at time t, and female is the gender dummy (it is 1 if observation represents employment of a female worker). The changes in female employment relative to male employment are indicated in λ2, and the effect of AGOA suspension is captured
by λ1, where a negative coefficient suggests that the reduction rate of female employment
is higher for exporters to the US market. The result in Table 9 (column 3) shows that an estimated coefficient of the triple interaction term (λ1) is not significant. When exporters
exclusively to the US market are compared, the coefficient is positive and significant (column 4), although it is not significant in the Tobit estimate (not reported). There is no robust evidence that AGOA suspension caused substantial reduction of female workers compared with male workers. Again, this result indicates that the high rate of reduction in female employment is not common among exporters to the US.
5. Conclusion
The export-oriented garment industry has contributed to the economy and created formal employment opportunities for the relatively poor people in Madagascar, where agriculture has long been the dominant economic sector. Though the garment industry displayed robust growth, overcoming liberalization in apparel markets, it experienced a critical situation after the domestic political turmoil that occurred in 2009. Our investigation demonstrates that the political turmoil itself led to reduction of garment exports by 31–45%, though the subsequent suspension of duty-free access to the US market resulting from the turmoil had a greater impact. The estimates indicate that AGOA
suspension caused exports to the US market to fall by 64%–78%. It also increased the probability of a factory’s closure by 57.8%, and reduced employment of low-skilled positions through such factory closures, which accounted for 27.8% of job losses after 2009, or 6405 jobs. We found evidence that the AGOA suspension did not specifically affect low-skilled employment or female employment at greater rates, but rather the impact upon these workers was mitigated as exporters that continued in operation tended to increase their proportion of low-skilled workers over higher-skilled workers.
It is noted that factory-level impacts on factory closure and employment are likely to be overestimated due to the lower demand in the US market in 2010 than the EU market to which our control factories supply. Despite that, estimated impacts are relatively small given the large impact on export value. This is mainly because the EU market where duty-free access is maintained for Madagascar’s products has buffered adverse impact of AGOA suspension by providing an alternative market. The factories that supplied to the EU market as well as the US market before the political crisis have increased supply to the former and maintained operation without significant reduction of employment. It indicates that if EU also had cancelled the duty-free access applied to Madagascar, much more factory closures would have been occurred and employment loss would have been huge.17
Our results demonstrate that unplanned termination of duty-free access granted to low-income countries can collapse the export-oriented industries, and leads to large loss of employment for uneducated and female workers, as low-income countries generally have comparative advantage in low-skilled labor-intensive industry. Currently, duty-free access is granted based on bilateral agreement or unilateral arrangement such as AGOA in absence of the multilateral scheme under the WTO regime. In this trend, risk of abrupt termination of duty-free access is not negligible, and such uncertainty discourages investment in low-income countries.
17 One may question whether cancellation of the duty-free access to the EU market would lead to
reduction of export as much as AGOA suspension. Although we cannot make rigorous investigation, note that duty-free access to the EU market has been granted to all LDCs including Bangladesh and Cambodia under the single-stage transformation since 2011. Therefore, cancellation may cause greater adverse effect in exports to the EU market than US market, where the market access of Madagascar’s apparel product is equal to the low-income competitors.
References
Barrientos, Stephanie; Gary Gereffi; and Arianna Rossi (2011) “Economic and Social Upgrading in Global Production Networks: A New Paradigm for a Changing World.” International
Labor Review, Vol.150, No. 3-4: pp. 319-340.
Gereffi, Gary and Stacey Frederick (2010) “The Global Apparel Value Chain, Trade, and the Crisis: Challenges and Opportunities for Developing Countries,” in Olivier Cattaneo; Gary Gereffi; and Cornelia Startitz (eds.) Global Value Chains in a Postcrisis World: A
Development Perspective, Washington, D.C.: World Bank.
Fukunishi, Takahiro and Ramiarison, Herinjatovo Aimé (forthcoming) “Export-Oriented Garment Industry in Madagascar: Implication of FDI to the Local Economy,” in Takahiro Fukunishi ed., Delivering Sustainable Growth in Africa: African Farmers and Firms in a
Changing World, Basingstoke: Palgrave MacMillan.
Glick, Peter and François Roubaud (2006) "Export Processing Zone Expansion in Madagascar: What are the Labor Market and Gender Impact?" Journal of African Economies, Vol.15, No.4, pp.722-756.
Heckman, J. and B. Singer (1984] “A Method for Minimizing the Impact of Distributional Assumptions in Econometric Models for Duration Data,” Econometrica, Vol. 52, No.2, pp. 271-320.
ILO (Bureau International Travail) and UNDP (United Nations Development Program) (2011)
MADAGASCAR Evaluation des Impacts de la Double Crise sur l’Emploi.
Jenkins, Stephen P. (2004) Survival Analysis, Unpublished Manuscripts, Institute for Social and Economic Research, University of Essex.
Jenkins, Stephen P. (1995) “Easy Estimation Methods for Discrete-Time Duration Models,”
Oxford Bulletin of Economics and Statistics, Vol.57, No.1, pp.129-138.
Lall, Sanjaya, and Ganeshan Wignaraja (1994) “Foreign Involvement and Garment Exports by Developing Countries,” Asia-Pacific Development Journal, Vol.1, No.2, pp.21-48.
Lopez-Acevedo, Gladys, and Raymond Robertson eds. (2012) Sewing Success?: Employment
and Wages Following the End of the Multi-fibre Arrangement, Washington D.C.; World
Bank.
Meyer, Bruce D. (1990) “Unemployment Insurance and Unemployment Spells,” Econometrica, Vo. 58, No.4, pp.757-782.
Ministère de l’Economie et de l’Industrie (2009) Situation Economique et Financière au cours
des Trois premiers mois de 2009, Antananarivo; Ministère de l’Economie et de l’Industrie.
Textile and Apparel Industry,” World Bank Policy Research Working Paper 3841, Washington D.C.; World Bank.
Shiferaw, Admasu (2007) “Firm Heterogeneity and Market Selection in Sub-Saharan Africa: Does It Spur Industrial Progress?” Economic Development and Cultural Change, Vol.55, No.2, pp.393-423.
Söderbom, Måns, Francis Teal and Alan Harding (2006) “The Determinants of Survival among African Manufacturing Firms,” Economic Development and Cultural Change, Vol. 54, No.3, pp.533-555.
Thoburn, John (2009) The Impact of World Recession on the Textile and Garment Industries of
Asia, Research and Statistics Branch Working Paper, 17/2009, Vienna: United Nations
Industrial Organization.
Wooldridge, Jeffrey M. (2010] Econometric Analysis of Cross Section and Panel Data, Cambridge: MIT Press.
Table 1. Impact of Political Turmoil
US and EU market
(2007-2009) (2007-2010) EU market
OLS FE Tobit RE OLS FE Tobit RE
1 2 3 4 MDG*post2009 -0.138 -0.463** -0.373* -0.645** (0.187) (0.235) (0.219) (0.291) y2007 -0.106** -0.132** -0.156** -0.188** (0.054) (0.066) (0.069) (0.083) y2009 -0.012 0.024 0.142 0.191*** (0.056) (0.064) (0.062) (0.070) y2010 0.276*** 0.349*** (0.070) (0.082) _cons -3.638*** -4.411*** -3.287*** -3.834*** (0.031) (0.162) (0.043) (0.182)
Fixed/Random effect product*country *market product*country *market product* country product*country *market Marginal effect of
turmoil -12.9% -33.8% -31.1% -45.3%
R2 0.0009 0.009
Log likelihood -20164.57 -13215.27
N 8283 8283 5732 5732
Note: Figures in parentheses represent bootstrap standard errors for the Tobit model and clustered standard errors for OLS. The marginal effect of turmoil is obtained by [exp(coefficient) − 1]*100, where the coefficient of Tobit models is transformed to indicate marginal effect on observed (censored) dependent variable. ***, **, and * indicate p < 0.01, 0.05, and 0.1, respectively.
Table 2. Impact of AGOA Suspension on Import Value
DIDID DID
OLS FE Tobit RE OLS FE Tobit RE
2 1 4 3 US*MDG*y2010 -1.012*** -1.773*** (0.367) (0.546) US*y2010 -0.249*** -0.335** -1.261*** -2.521*** (0.095) (0.112) (0.355) (0.602) y2007 -0.106** -0.133** -0.145 -0.243 (0.054) (0.064) (0.202) (0.333) y2009 -0.032 -0.040 -0.169 -0.311 (0.055) (0.064) (0.198) (0.315) y2010 0.247*** 0.332*** -0.140 -0.080 (0.063) (0.070) (0.277) (0.415) MDG*y2010 -0.328 -0.531 (0.245) (0.331) _cons -3.638*** -4.423*** -6.552*** -8.507*** (0.035) (0.146) (0.127) (0.531)
Fixed/Random effect product*country *market product*country *market product*market product*market Marginal effect of
AGOA suspension -63.6% -78.1% -71.7% -81.6%
R2 0.009 0.021
Log likelihood -25997.48 -3592.8
N 11044 11044 1592 1592
Note: Figures in parentheses represent bootstrap standard errors for the Tobit model and clustered standard errors for OLS. The marginal effect of turmoil is obtained by [exp(coefficient) − 1]*100, where the coefficient of Tobit models is transformed to indicate marginal effect on observed (censored) dependent variable. ***, **, and * indicate p < 0.01, 0.05, and 0.1, respectively.
Table 3. Effect of Tariff on Import to US from Madagascar
Dep. Var. ln(value) (1) ln(quantity) (2) ln(unit price) (3)
y2009 −0.319 −0.600 0.123 (0.299) (0.585) (0.082) y2010 −0.384 −0.559 0.642 (0.847) (1.732) (0.270) tariff2010 −9.098* −16.334 −2.365** (4.968) (10.190) (1.173) _cons −7.098*** −1.406*** 4.642*** (0.175) (0.343) (0.049)
Fixed Effect product product product
R2 0.063 0.049 0.048
N 571 571 335
Note: The variable “tariff2010” is expressed in percentage. Clustered standard errors are reported in parentheses. ***, **, and * indicate p < 0.01, 0.05, and 0.1, respectively.
Table 4. Exit and survival between 2009 and 2011 by supply market
Supply market as of 2008 Number Total
in 2009 Exited Between 09–10 Exited Between 10–11 Survived Until 2011 Missing
Obs. Exit Rate
US market only 19 12 1 6 0 68.4%
Other markets 61 8 1 46 6 16.4%
Both US and other markets 16 1 1 12 2 14.3%
No market info. 2 2 0 0 0 100.0%
Total 98 23 3 64 8 28.9%
Note: Market information was not available for two exporting firms Source: Firm surveys 2008–10.
Table 5. Change of Supply Markets
2008 2009 2010
US market only (19.4%) 19 (10.4%) 7 (5.3%) 3
Other markets (62.2%) 61 (77.6%) 52 (77.2%) 44
Both US and other markets (16.3%) 16 (11.9%) 8 (10.5%) 6
No market info (2.0%) 2 (0.0%) 0 (7.0%) 4
Total 98 67 57
Note: This table covers the factories that exported in 2008 and were traced by the 2009 and 2010 surveys. Source: Firm surveys 2008–10.
Table 6. Estimates of Firm Exit 1 2 3 4 TFP -0.099 -0.082 -0.097 (0.315) (0.342) (0.320) labor productivity -0.0001 (0.0001) US -0.090 -0.092 -0.219 -0.157 (0.858) (0.842) (0.840) (0.859) USonly 2.134** 2.082** 2.542** 0.230 (0.843) (0.831) (1.093) (2.247) employmnet -0.001 -0.001 0.000 -0.001 (0.000) (0.000) (0.000) (0.000) age -0.010 -0.022 -0.002 -0.001 (0.051) (0.049) (0.051) (0.050) subcontract -0.603 -0.635 -0.610 -0.456 (0.471) (0.470) (0.475) (0.492) foreign subsidiary 0.707 0.735 0.668 0.588 (0.515) (0.523) (0.530) (0.537) local 0.273 0.192 0.335 0.276 (0.619) (0.620) (0.597) (0.715) y2009/10 -1.439** -1.494*** -1.419** -1.466** (0.569) (0.561) (0.597) (0.581) share_skilled 0.627 (1.936) USonly*share_skilled -2.756 (6.845) share_female -1.373 (1.343) USonly*share_female 3.012 (2.966) _cons -1.657*** -1.296** -1.837** -0.837 (0.556) (0.652) (0.769) (0.881) Log pseudolikelihood -45.985 -45.017 -44.889 -43.601 N 134 145 134 131
Note: Robust standard errors are reported in parentheses. ***, **, and * indicate p < 0.01, 0.05, and 0.1, respectively.
Table 7. Changes in Employment from 2008 to 2010
Employment in
2008 Total Reduction 2008–10 Exporters to US Reduction in Exporters to US Contribution of
Total 57,250 (−46.5%) −26,611 −17,537 65.9%
Male 21,714 (−46.1%) −10,008 −2,698 27.0%
Female 29,094 (−35.7%) −10,379 −9,367 90.2%
Note: The figures in “Total” include jobs occupied by a foreigner, whereas those in “Male” and “Female” do not include foreign workers.
Source: Firm surveys 2008–10
Table 8. Changes in Employment by Position
Composition (2008) Percentage change 2008–2010
Total Male Female
Managerial 0.76 −30.0 −15.2 −23.2 Officer 2.36 −26.5 −29.1 1.8 Engineer 1.06 −66.0 −90.9 17.6 Quality controller 2.80 −31.8 −12.6 −34.2 Supervisor 3.12 −26.6 −63.0 49.6 Operator 72.94 −47.5 −44.7 −36.5 Helper 10.79 −52.3 −46.1 −51.7 Other workers 6.18 −47.7 −55.5 −34.7 Total 100.00 −46.5 −46.1 −35.7
Table 9. Estimates of Changes in Low-skilled Employment
Dep. Var. low-skilled workers) log(total number of low-skilled workers by log(number of gender) (1) (2) (3) (4) US*y2010 0.026 0.156 (0.270) (1.182) USonly*2010 0.043 -2.110 (0.459) (1.688) US*female*y2010 0.255 (1.317) USonly*female*y2010 4.198** (1.871) y2009 -0.033 -0.023 -0.153 -0.221 (0.219) (0.265) (0.344) (0.382) y2010 -0.543** -0.552** -0.123 -0.136 (0.241) (0.261) (0.698) (0.729) female*y2010 -0.709 -0.950 (0.907) (0.904) _cons 4.890*** 4.668*** 2.717*** 2.591*** (0.130) (0.157) (0.301) (0.322)
Fixed effect Factory Factory Factory Factory
R2 0.083 0.076 0.101 0.126
N 162 132 304 250
Note: Clustered standard errors are reported in parentheses. ***, **, and * indicate p < 0.01, 0.05, and 0.1, respectively.
Table 10. Estimates of Employment Changes by Positions OLS-FE Tobit-RE Change in 2010 (φ1) Change specific to exporters to US (η1,φ2) Change in 2010 (φ1) Change specific to exporters to US (η1,φ2) 1 2 3 4 Base (helper) -1.395** 2.300** -1.052** 1.974*** (0.611) (0.901) (0.499) (0.746) manager 0.429 -2.357 0.989 -1.976* (0.826) (1.433) (0.801) (1.152) officer 1.777** -2.321 2.070** -2.033* (0.689) (1.476) (0.738) (1.152) engineer 0.768 -3.674*** 0.915* -2.988*** (0.745) (1.339) (0.863) (1.010) quality controller 1.904** -3.378* 2.132** -2.989* (0.812) (1.703) (0.988) (1.557) supervisor 1.241 -2.751** 1.586 -2.347** (0.754) (1.249) (0.814) (0.997) operator 0.175 -2.304 0.668 -1.920* (0.805) (1.391) (0.738) (1.129) other 1.287 -1.208 2.023** -1.137 (0.830) (1.627) (0.852) (1.349) Fixed/Random
effect Factory Factory
R2 0.297
Log likelihood -2864.115
N 1296 1296
Note: Coefficients of Tobit-RE model are transformed to indicate marginal effect on observed (censored) dependent variable. Clustered standard errors are reported in parentheses for OLS-FE model, and bootstrap standard errors for Tobi-RE model. ***, **, and * indicate p < 0.01, 0.05, and 0.1, respectively.
Table 11. Female Employment by Type of Firms
Female Employment in Exiting Firms (2008)
Share Employment Number of Employees in Exiting US
Exporters 72.4% 6,372
Employees in All Exporters 50.8% 15,792
Female Employment in Continuing Firms (2008–11) Change Employment Number of
(2008) Employees in Continuing US
Exporters -35.1% 7,897
Employees in Continuing
non-US Exporters -17.4% 8,584
Note: Figures of female share and change of female employment are based on the total number of employees in specified firms rather than average across firms.
Figure 1. Garment Exports from Madagascar (million US$)
Figure 2. Change of the Average Output and Input from 2008 to 2010 Panel A: All firms
Panel B: Firms exporting to the EU market
Note: See Appendix for construction procedure of output and input data. Source: Firm surveys 2008–2010
Appendix 1. Sample Structure and Data Construction
1.1. Sample Structure
The firm survey collected information regarding exporting and non-exporting factories in Antananarivo, including its suburb and Ansirabe, where almost all exporting factories were located. The firm data for 2008 included 98 factories of export-oriented garment firms, regardless of the export processing zone (EPZ) status, and 19 non-exporting factories. The samples were randomly selected from the two different firm lists of EPZ and non-EPZ firms, although factories located out of Antananarivo and Ansirabe were excluded. As almost all exporting factories are located within our geographical coverage, randomness is maintained for samples of exporting factories that are investigated in this paper. The EPZ list contained 131 firms in 2008 and our sample represents 64.9% of those firms. However, the exact size of the non-EPZ population is unknown because the list includes firms with fewer than 10 employees, on which we do not focus, and firms that were closed at the time of the survey.
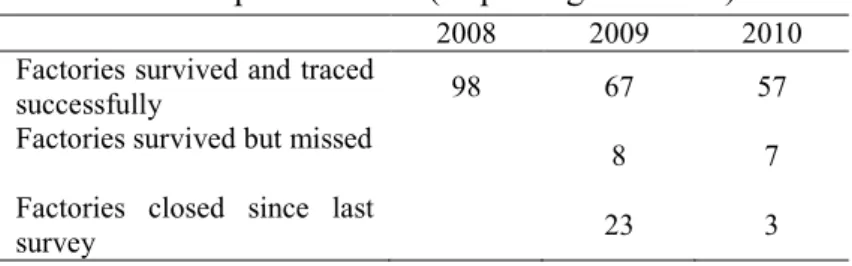
The factories visited in the 2008 survey were followed in subsequent surveys. The 2009 survey found that 23 factories were closed and 67 factories were successfully traced, with the remaining 8 factories not participating in the second round. In the 2010 survey, 57 factories were successfully traced, whereas 3 factories were found to have closed, and 7 factories did not participate in the third round (Table A1). The third round added 15 exporting factories into the sample, though they are not used in this paper because of lack of information before the political crisis.
1.2. Construction of Input and Output Data
The values for value added, our measure of output, are obtained by subtracting input costs from gross production. The input and output value information were deflated at 2008 prices. For the productivity calculation, item-specific deflators were used wherever possible; the data used include the apparel wholesale price index in the United States (Bureau of Economic Analysis) for gross product and material costs, the fuel and electricity price index in Madagascar for energy costs, the utility price index for utility costs, and the GDP deflator in Madagascar for the remaining items. The input and output figures for descriptive statistics were deflated by the GDP deflator.
The capital value was calculated by the perpetual inventory method. On the basis of the information regarding purchase year and equipment price, the capital value was constructed by applying a 10% depreciation. Deflation was based on the price index of
“Special Industry Machinery” calculated by the Bureau of Economic Analysis in the United States because most equipment were imported. For observations without purchase price or year, the capital value was estimated from the resale value given by a respondent. The capital value does not include the value of land and buildings. Assuming perfect complementarities between equipment and land (building), only the value of equipment was used.
Despite such assumptions, rent is required in order to make profit, which is remainder of revenue after subtracting all costs. Information on rents and interest was collected and depreciation was estimated from capital value. However, in cases where a firm owner did not record dividends for his or her contribution in an accounting book, the information was not captured and was included in profits as a residual. Our attempt to regress rent on firm size and location did not yield successful results.
The observations showing negative value added, or an extremely low share of labor cost in value-added (less than 10%), or an average wage lower than 80% of the minimum wage were excluded. On the assumption that the number of workers was the most reliable information available, firms with unnatural labor costs and value added per worker were excluded through the second and third conditions explained above. After following this procedure, 90 firms in 2008, 55 firms in 2009, and 44 firms in 2010 were left for analysis related to production.
Table A1 Sample Structure (Exporting Factories)
2008 2009 2010
Factories survived and traced
successfully 98 67 57
Factories survived but missed 8 7
Factories closed since last
Appendix 2. Duration Analysis
2.1. Hazard Function
Let T be the length of time a firm survives. The cumulative probability function of T is defined as 0 ), ( ) (t =P T ≤t t ≥ F .
The survivor function is defined as
) ( ) ( 1 ) (t F t P T t S ≡ − = > .
The probabilities of leaving the initial state in an interval Δt given survival until t is
) |
(t T t t T t
P ≤ < +∆ ≥ , and hazard function, θ(t), is defined as the marginal rate of leaving the initial state
) ( ) ( ) | ( lim ) ( 0 t S t f t t T t t T t P t t ∆ = ≥ ∆ + < ≤ = → ∆ θ ,
where f(t) is the probability density function. The analysis is centered on the hazard function, conditional on a set of covariates. Suppose that it takes proportional hazard model ) exp( ) ( ) | ( ) | ( ) , ( 0 x x x x θ β θ = = t ′ t S t f t ,
where θ0(t) is the baseline hazard.
As our duration data is grouped from 2003 to 2005 and from 2005 to 2009, these modifications are required. The survivor function at time am, which is the end of the
interval (am−1, am), is
[
m]
a a m m m du u du u a S Θ ′ − = − ′ = − =∫
∫
) exp( exp ) ( ) exp( exp ) , ( exp ) , ( 0 0 0 x x x x β θ β θ , where Θ =∫
amm 0 θ0(u)du. The discrete hazard function, h(am,x), is defined as