IRUCAA@TDC : Estimation of optimal amount of fluoride dentifrice for adults to prevent caries by comparison between fluoride uptake into enamel in vitro and fluoride concentration in oral fluid in vivo
11
0
0
全文
(2) 119. Bull Tokyo Dent Coll (2007) 48(3): 119–128. Original Article. Estimation of Optimal Amount of Fluoride Dentifrice for Adults to Prevent Caries by Comparison between Fluoride Uptake into Enamel In Vitro and Fluoride Concentration in Oral Fluid In Vivo Hiroshi Koga, Atsushi Yamagishi*, Atsushi Takayanagi*, Kohji Maeda* and Takashi Matsukubo Department of Epidemiology and Public Health, Tokyo Dental College, 1-2-2 Masago, Mihama-ku, Chiba 261-8502, Japan * Global R&D—Personal Health Care, Kao Corporation, 2-1-3 Bunka, Sumida-ku, Tokyo 131-8501, Japan. Received 2 April, 2007/Accepted for publication 27 July, 2007. Abstract Fluoride dentifrice has been accepted widely for use in caries prevention and its effectiveness has been confirmed. In order to enable the use of fluoride dentifrice effectively in daily brushing, the present study was performed to examine the relationship between fluoride uptake and the amount of fluoride dentifrice used and brushing time for adults. We examined the relationship between fluoride uptake into the surface layer (4–6 m)of enamel and the active fluoride concentration in vitro and the relationship between the amount of fluoride dentifrice (1,000ppmF) used and the fluoride concentration in oral fluid in vivo. It became clear that fluoride uptake into the enamel was increased at the concentrations of 300ppmF or more. Fluoride uptake at 300ppmF was increased for 2min and became saturated thereafter. The results of the relationship between the fluoride concentration in the oral fluid and the amount of fluoride dentifrice used indicated that the amount of dentifrice that could maintain the mean fluoride concentration at 300ppm or more for 2min was 1.0g or more. From these results, the recommended amount of fluoride dentifrice (1,000ppmF) is 1.0g or more for adults. Key words:. Fluoride dentifrice—Fluoride uptake— Amount of fluoride dentifrice— Fluoride concentration in oral fluid. Introduction Recently, according to the Report on the Survey of Dental Diseases (1999) by the Health. Policy Bureau, Ministry of Health and Welfare, Japan, DMFT, an indicator of caries prevalence, in children aged 12 years, was not more than 3 in Japan, which was also the case in. This study presented in part at the 54th meeting of Japanese Society for Dental Health, 18th September 2004 at Morioka. ( J Dent Hlth 54(4): 413, 2004). 119.
(3) 120. Koga H et al.. Europe7). It has been reported that the caries incidence might be decreasing, because the number of DMFT reached to the target of WHO, “DMFT should be decreased to 3.0 or less before a child becomes 12 years old.” Thus, successful decrease of caries prevalence in elementary school-age children has been achieved. However, the caries prevalence rate in junior high and high school students increases markedly with increasing age1). The market share of fluoride dentifrice in Japan in 2003 is about 88%8), indicating that the usage of fluoride dentifrice as home care (self-care) has become popular. At least judging from the questionnaire about the frequency of tooth brushing, once-a-day tooth brushing habit is popular. Nevertheless, in people aged 13 to 18 years at puberty with the high caries prevalence rate the trend has kept1). In Japan, water fluoridation for systematic application of fluoride, one of the means of fluoride applications for caries prevention, has not been conducted. The use of fluoride mouthrinse has been carried out in only 3.1% or less of the population even in schools10) and market development of fluoride mouthrinses has not been done. This means that access to fluoride mouthrinse is poor and that in the present social circumstances, fluoride mouthrinse is not widely accepted for caries prevention, even if there is knowledge about the caries prevention through health education. Based on the present status of widely of fluoride application, it can be considered that the effective application of fluoride dentifrice that is used daily for topical application of fluoride contributes most importantly to prevent caries. To achieve effective application of fluoride dentifrice for caries prevention at puberty, it may be necessary to reexamine the content and method of the existing information about such dentifrices. In other words, the present scientific understanding of the action of fluoride dentifrice is insufficient. For example, optimal method for usage of such dentifrice has not been determined. Therefore, it remains necessary being scientifically based information concerning preventing caries to. people engaged in dental medicine and to users of health information, and such information must be understandable and practically useful. In Japan, however, there is almost no research on the effective daily amount of fluoride dentifrice. In the present study, in order to make it possible use fluoride dentifrice effectively, we examined the effective amount of fluoride dentifrice and the appropriate application time by studying the relationship between fluoride uptake into enamel and the active fluoride concentration and the time-course of changes of the amount of dentifrice used and of the fluoride concentration in oral fluid.. Materials and Methods 1. Study design This study consisted of two different experiments (Fig. 1). In experiment 1, fluoride uptake into bovine enamel, active concentration of fluoride and optimal treatment time of fluoride dentifrice were examined in vitro. In experiment 2, the relationship between the amount of fluoride dentifrice used and fluoride concentration in oral fluid was examined with the actual application of fluoride dentifrice. From these two experiments, the effective amount of fluoride dentifrice and the optimal application time were obtained by clarifying the fluoride action to prevent caries. 2. Experiment 1. Fluoride uptake into bovine enamel with fluoride solutions in vitro 1) Preparation of specimens Gum and root membrane etc. of bovine anterior teeth (Black Cattle in Japan, aged 2 years) were carefully removed from teeth. The enamel specimen surface was polished using an aluminum wrapping film with 40-m particle size (Aluminum oxide: Imperial wrapping film sheet, 3M) to smooth the enamel surface, and a final polishing was done with the same film with 3-m particle size. The teeth.
(4) Optimal Amount of Fluoride Dentifrice. In vitro experiment Fluoride uptake into bovine enamel with fluoride solutions. Matrix of fluoride concentration and reaction time. 121. In vivo experiment Actual fluoride concentration of fluoride dentifrice with brushing Matrix of amount of fluoride dentifrice and brushing time. Optimal amount of 1,000 ppm fluoride dentifrice daily use with brushing teeth Fig. 1 Flow diagram of experiments. were divided in coronal and root sites using a diamond cutter. A coronal site of enamel was cut into 6 specimens using the cutter. The enamel specimen was attached to the tip of an acrylic bar (diameter: 8 mm, height: 11 cm) with epoxy putty (GSI Ceros Hobby Department). After the putty hardened, a window (5 mm⳯5 mm) was made with nail varnish. 2) Preparation of fluoride solution and the treatment method Fluoride solutions were prepared by dissolving NaF (special grade sodium fluoride, Wako Pure Chemical Industries, Osaka, Japan) in ion exchange-purified water to make concentrations of 100, 300, 500 and 1,000 ppmF. Taking into consideration typical daily tooth brushing times, 30 sec, and 2 and 5 min were employed as treatment times. The experiment was performed using undertaken in matrix of the above 4 fluoride concentrations and 3 treatment times with 5 samples for each combination. The fluoride treatment was carried out by gently shaking the samples in the solutions and the samples were washed for 30 sec with ion exchange-purified water. In the control group, 5 untreared samples were employed. 3) Acid etching of bovine enamel after reaction The treated samples were decalcified for. 10 sec in 0.4 ml of 0.5M perchloric acid (analytical grade, Wako Pure Chemical Industries) and the decalcification reaction was terminated by adding 1.6 ml of 0.5M sodium citrate solution. Immediately after the completion of decalcification, the reaction was stopped by adding 1.6 ml of 0.5M sodium citrate solution, which adjusted the pH of the solution to 5.6. 4) Determination of fluoride (F) and calcium (Ca) in decalcification solutions The concentrations of F in decalcification solutions were determined by the fluoride ion selective electrode method. A combinationtype F ion electrode (9606 BN, Thermo) and an ion meter (940 A, Orion) were employed. The F concentrations of standard fluoride solutions were 10, 1.0 and 0.1 ppm, which were prepared by dissolving NaF in the mixture of 0.5M perchloric acid and 0.5M sodium citrate at the ratio of 1 to 4. Solutions with extremely low concentrations, 0.05, 0.02 and 0.01 ppm, were prepared by diluting 0.1 ppm standard solution at each determination. A portion of decalcification solution was diluted appropriately in 1N-HCl/0.5% La solution to determine Ca by an atomic absorption method (Hitachi Model 508). 5) Measurement of enamel surface area The specimens were photographed using a.
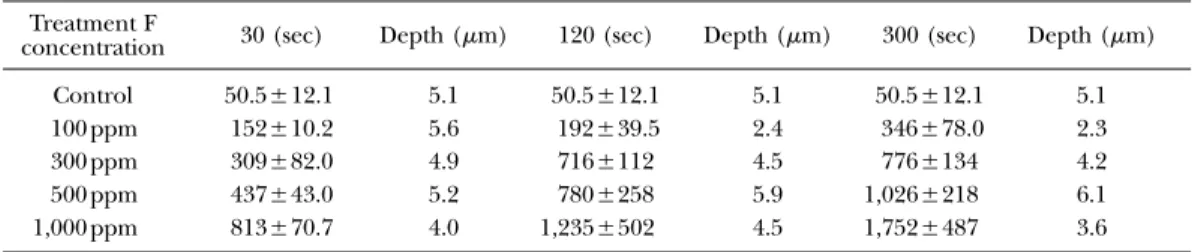
(5) 122. Koga H et al.. digital camera and the surface areas were obtained from the image by using image analysis software (WinROOF ver5, Mitani Co.). 6) Calculation of fluoride concentrations in bovine enamel The amount of enamel and fluoride concentrations in each layer were measured based on the assumption that the calcium content in bovine enamel and the enamel specific gravity were 37%2) and 2.955), respectively. The used for equations calculation were as follows: Amount of F in enamel (g) ⳱F ion concentration (g/ml)⳯2 ml Amount of enamel (g) ⳱Amount of decalcified Ca (g)⳯100/37 F concentration in enamel (ppm) ⳱Amount of F (g)/amount of enamel (g)⳯2.95 Depth of enamel (m) ⳱Amount of F (g)/(2.95 g/cm3)⳯Area of enamel surface tested (mm3) 7) Statistical analysis The statistical analysis among the test groups and between each test group and the control group was performed by PLSD of Fishers’ test and ANOVA, or the multi-comparison test method (Tukey Kramer test). A p value of not more than 5% was considered statistically significant (Statview Ver. 5.0).. (0.1, 0.3, 0.5, 0.7, 1.0 and 1.5 g) and four different brushing times (30, 60, 120 and 180 sec). 3) Determination of fluoride concentration in oral fluid after brushing with fluoride dentifrice After brushing, dentifrice in oral fluid was poured out into a cup. One gram of the fluid was taken from the cup and mixed with 10 ml of 1N HCl. The specimen solution was filtered through a Millipore filter (0.45m), and 2 ml of 1M sodium citrate solution and 3 ml of TISAB II were mixed with 1 ml of the specimen solution. The F ion concentration in this solution was determined by a combination F ion electrode method (9606 BN, Thermo) and the fluoride concentration in oral fluid was calculated. 4) Statistical analysis The statistical comparison of fluoride concentrations in oral fluid after treating with the various amounts of fluoride dentifrice for various brushing times was performed by a multiple-comparison method (Tukey Kramer test) after applying two-way ANOVA. A p value of not more than 5% was considered statistically significant (Statview Ver. 5.0).. 3. Experiment 2. Relationship between amount of fluoride dentifrice (1,000 ppmF) and fluoride concentration in oral fluid in vivo 1) Subjects and preparation of fluoride solution The subjects enrolled in this study were 8 adults (male and female aged 24 to 45 years). Liquid fluoride dentifrice was prepared by using NaF to make the final concentration 1,000 ppmF. 2) Brushing with fluoride dentifrice (establishment of amount of fluoride dentifrice and brushing time) Before brushing, the mouth was washed for 10 sec with 10 ml of ion exchange-purified water. Then brushing was done in combination of six different amounts of dentifrice. 1. Fluoride uptake into first layer of enamel 1) Treatment time and fluoride uptake The fluoride concentration in the surface layer of control bovine enamel used in the present study was about 50 ppm. Fluoride uptake into enamel tended to be increased with longer treatment time (Table 1). The results of PSTD of Fishers’ test (Table 2) showed that there was no significant difference in fluoride uptake between the control and 100 ppmF groups at any treatment time. Therefore, it can be concluded that fluoride uptake in the 100 ppmF group was very low. On the other hand, in the 300 ppmF and 500 ppmF groups, significant differences in fluoride uptake were observed between the 300 ppmF/30 sec group and the 500 ppmF/ 120 sec or 300 sec group, and between the. Results.
(6) 123. Optimal Amount of Fluoride Dentifrice. Table 1 Fluoride concentration in the surface layer in bovine enamel (ppm) Treatment F concentration Control 100 ppm 300 ppm 500 ppm 1,000 ppm. 30 (sec). Depth (m). 120 (sec). Depth (m). 300 (sec). Depth (m). 50.5Ⳳ12.1 152Ⳳ10.2 309Ⳳ82.0 437Ⳳ43.0 813Ⳳ70.7. 5.1 5.6 4.9 5.2 4.0. 50.5Ⳳ12.1 192Ⳳ39.5 716Ⳳ112 780Ⳳ258 1,235Ⳳ502. 5.1 2.4 4.5 5.9 4.5. 50.5Ⳳ12.1 346Ⳳ78.0 776Ⳳ134 1,026Ⳳ218 1,752Ⳳ487. 5.1 2.3 4.2 6.1 3.6. Trial, n⳱5.. Table 2 Statistical analysis of fluoride uptake into the surface layer of enamel between treatment time and exposure fluoride concentrations Fluoride Exposure concentration time (ppm) (sec) 100 ppm. 300 ppm. 500 ppm. 1,000 ppm. 100 ppmF. Control. 300 ppmF. —. 30. 120. 300. 30 120 300. NS NS NS. — NS NS. — NS. —. 30 120 300. NS * *. NS * *. NS * *. 30 120 300. NS * *. NS * *. 30 120 300. * * *. * * *. 500 ppmF. 30. 120. 300. 30. 120. NS * *. — * *. — NS. —. NS * *. NS * *. NS * *. NS NS NS. * * *. * * *. * * *. NS * *. 300. * NS NS. — * *. — NS. —. NS * *. * * *. NS * *. NS NS *. *p⬍0.05 (PLSD of Fishers’ test). NS: non significance.. 500 ppmF/30 sec group and 300 ppm/300 sec group. With the longer treatment times, 120 sec and 300 sec, there was no difference in fluoride uptake between the 300 ppmF group and the 500 ppmF group. These results indicate that there was not so much difference in fluoride uptake between the 300 ppmF and the 500 ppmF group. Concerning the 100 ppmF and 300 ppmF groups, the 300 ppmF group statistically significantly higher fluoride uptake values at 120-sec and 300-sec treatment times. 2) Comparison of fluoride uptake into enamel among fluoride dentifrices with different active fluoride concentrations at 120-sec treatment time The results of the multiple-comparison test. of fluoride uptake among fluoride dentifrices with different active fluoride concentrations at 120-sec treatment time, a typical brushing time used by ordinary people, are shown in Table 3. The control group showed significantly lower fluoride uptake compared with all the other groups. Fluoride uptake in the 100 ppmF group was significantly lower compared with that in the 300 ppmF, 500 ppmF and 1,000 ppmF groups. On the other hand, there was no difference in fluoride uptake between the 300 ppmF group and the 500 ppmF group. Comparing the 1,000 ppmF group and 500 ppmF group, the 1,000 ppmF group showed significantly higher fluoride uptake..
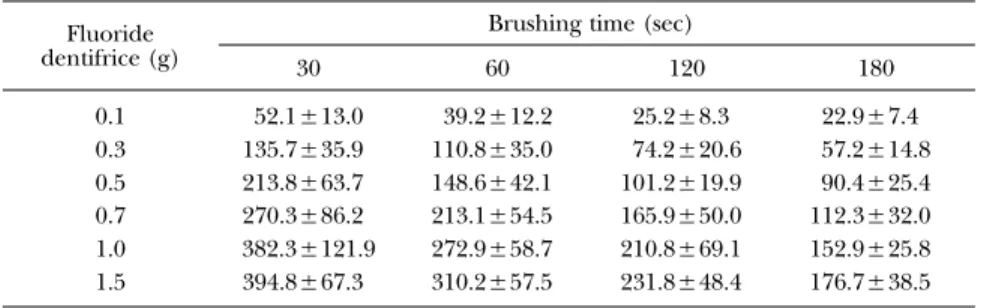
(7) 124. Koga H et al.. Table 3. Multi-comparison test of fluoride uptake into enamel (first layer) on 120-sec exposure time. F treatment. Control. 100 ppm. 300 ppm. 500 ppm. Control 100 ppm 300 ppm 500 ppm 1,000 ppm. — NS * * *. — * * *. — NS *. *. Tukey Kramer test, *p⬍0.05. NS: non significance.. Table 4 Fluoride concentration in oral cavity brushing with fluoride dentifrice (1,000 ppmF) Brushing time (sec). Fluoride dentifrice (g). 30. 60. 120. 180. 0.1 0.3 0.5 0.7 1.0 1.5. 52.1Ⳳ13.0 135.7Ⳳ35.9 213.8Ⳳ63.7 270.3Ⳳ86.2 382.3Ⳳ121.9 394.8Ⳳ67.3. 39.2Ⳳ12.2 110.8Ⳳ35.0 148.6Ⳳ42.1 213.1Ⳳ54.5 272.9Ⳳ58.7 310.2Ⳳ57.5. 25.2Ⳳ8.3 74.2Ⳳ20.6 101.2Ⳳ19.9 165.9Ⳳ50.0 210.8Ⳳ69.1 231.8Ⳳ48.4. 22.9Ⳳ7.4 57.2Ⳳ14.8 90.4Ⳳ25.4 112.3Ⳳ32.0 152.9Ⳳ25.8 176.7Ⳳ38.5. n⳱8 (aged 24–45 years).. Table 5 Multi-variation comparison test to fluoride concentration in oral cavity with 1,000 ppm fluoride dentifrice Significant test, *p⬍0.05. Fluoride dentifrice (g). 0.1. 0.3. 0.5. 0.7. 1.0. 0.1 0.3 0.5 0.7 1.0 1.5. — * * * * *. — NS * * *. — NS * *. — * *. — NS. * Tukey Kramer test, n⳱8. Reject value: ⳮ55.197. NS: non significance.. 2. Fluoride concentration in oral fluid after brushing with liquid fluoride dentifrice The amount of liquid fluoride dentifrice (1,000 ppmF), and the mean and standard deviation of the fluoride concentrations in oral fluid of eight subjects are shown in Table 4. The mean fluoride concentration in oral fluid after brushing with liquid fluoride dentifrice decreased exponentially with the increase of time of after brushing. At 30-sec brushing,. the fluoride concentration was minimum, 52.1Ⳳ13.0 ppm with 0.1 g of fluoride dentifrice and maximum, 394.8Ⳳ67.3 ppm with 1.5 g of fluoride dentifrice. When the amount of fluoride dentifrice was increased, the fluoride concentration in the oral fluid was not increased proportionally. The multiplecomparison test among fluoride dentifrice brushing groups (Table 5) showed that a significant difference in the fluoride concentration in the oral fluid was observed between.
(8) Optimal Amount of Fluoride Dentifrice. the 0.1 g group and 0.3 g group and between the 0.7 g group and 1.0 g group. There was no statistically significant difference in the fluoride concentration in the oral fluid between the 1.0 g group and 1.5 g group.. Discussion 1. Fluoride concentration in control enamel The fluoride concentration in the layer of control bovine enamel was 50.5 ppm, which was one tenth that in humans11). The reason why the fluoride concentration in bovine enamel was so low compared with that in human enamel was considered to be due to the abrasion that occurred during polishing of the sample of bovine enamel surface. This polishing of bovine enamel surface has been usually conducted in cariology study with this enamel. We confirmed no difference between fluoride uptakes into enamel reacted fluoride solution (1,000 ppmF) to different baselines. 2. Concentration of fluoride for enhancing the reaction of enamel with fluoride The results of analysis of fluoride uptake into the enamel suggested that the reaction of fluoride with the enamel surface and with the layer, and fluoride uptake into enamel were enhanced at 300 ppmF or higher of active fluoride concentration and 30 sec or more brushing time. Fluoride uptake into enamel at 120-sec brushing time, what is very close to actual typical brushing times, was almost equal between the 300 ppmF group and the 500 ppmF group, but was different between the 500 ppmF group and the 1,000 ppmF group. Their findings suggest that the reaction to enamel between using the 500 ppmF and the 1,000 ppmF is different. 3. CaF2 formation by enamel pulus fluoride solution, and fluoride penetration In studies of the reaction of fluoride ion with enamel, it has been confirmed that CaF2 -like globular crystals are formed on the enamel surface at 300 ppm fluoride concentration under the neutral pH condition and. 125. at 100 ppm under the weak acidic condition (pH 5.0)3,9,12,13). Based on this fact, it is considered that CaF2 is hardly formed in the 100 ppmF group under the neutral pH conditions and that CaF2 formation may be possible in the 300 to 500 ppm groups under such conditions. At 1,000 ppmF or more, the amount of CaF2 formed is considered to be increased compared with that at the lower fluoride concentrations4,14). In the 100 ppmF and 300 ppmF groups, fluoride uptake at 300-sec treatment time was about 3 times that at 30-sec treatment time, and in the 1,000 ppmF and 1,500 ppmF groups, fluoride uptake at 300-sec treatment time was about 2 times that at 30-sec treatment time. Assuming that the volume capacity for fluoride uptake in the first layer of enamel is constant, it is considered that at 1,000 ppmF of active concentration, fluoride penetrates into the vacant space of the crystal structure for a short time due to the steep concentration slope so that CaF2 formation dominates compared to that in the lower fluoride concentration groups and that in the lower fluoride concentration groups, 100 ppmF and 300 ppmF groups, penetration is slower because of the gentle concentration slope. 4. Simulation of mean fluoride concentration in oral fluid An approximate expression for the mean fluoride concentration in oral fluid was obtained using the actual values of the fluoride concentrations in oral fluid in 8 subjects. The approximate expression deduced from data in Table 4 showed that the approximation with a quadratic function was most fittable. Therefore, a quadratic regression equation was obtained and integrated. F (t ), an equation for obtaining mean fluoride concentration in oral fluid, was deduced by dividing the integrated equation by an arbitrary brushing time (t ). The quadratic approximate expression is as follows: (1) f (t )⳱at 2ⳭbtⳭC By integrating this equation by a brushing time (t ), an equation for the fluoride concen-.
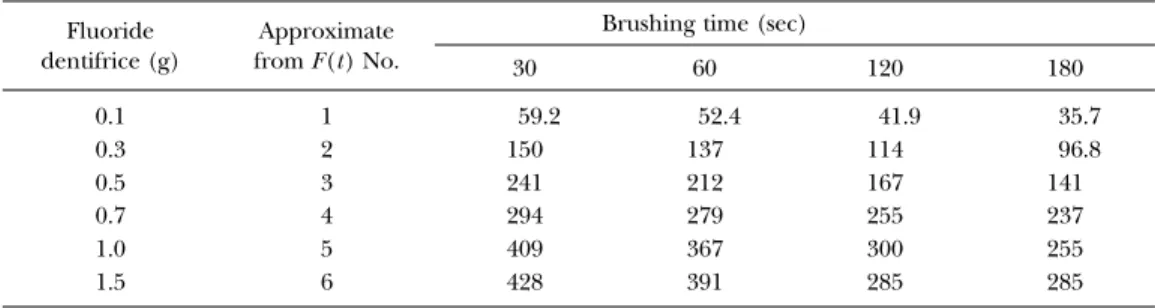
(9) 126. Koga H et al.. Table 6 Mean active fluoride concentration calculated in oral cavity brushed by 1,000 ppm fluoride dentifrice Fluoride dentifrice (g). Approximate from F (t) No.. 0.1 0.3 0.5 0.7 1.0 1.5. 1 2 3 4 5 6. Brushing time (sec) 30. 60. 120. 180. 59.2 150 241 294 409 428. 52.4 137 212 279 367 391. 41.9 114 167 255 300 285. 35.7 96.8 141 237 255 285. F (t ): Mean active fluoride concentration, t: brushing time (sec). No.1: F (t )⳱0.0006t 2ⳮ0.2828t Ⳮ67.18 No.2: F (t )⳱0.0089t 2ⳮ0.5395t Ⳮ165.8 No.3: F (t )⳱0.0027t 2ⳮ1.2322t Ⳮ276.0 No.4: F (t )⳱0.000967t 2ⳮ0.8084t Ⳮ310.4 No.5: F (t )⳱0.0029t 2ⳮ1.6455t Ⳮ459.6 No.6: F (t)⳱0.00237t 2ⳮ1.4475t Ⳮ469.3. tration at an arbitrary brushing time can be obtained. (2) F (t )⳱兰(at 2ⳭbtⳭC )dt a b (3) F (t )⳱—t 3Ⳮ—t 2ⳭCtⳭC 1 3 2 Since t is 0 and F (0) is 0, C 1 becomes 0. This is converted to the mean fluoride concentration at a brushing time (t ). The conversion equation, MF (t) is as follows: F (t ) a b (4) MF (t )⳱———⳱—t 2Ⳮ—tⳭC t 3 2 Equation (4) is a equation that of enables calculation of mean fluoride concentration in oral fluid by using the actual values. The mean fluoride concentration in oral fluid was used for comparing the groups treated with fluoride dentifrice in order to a constant fluoride concentration for fluoride uptake. Table 6 shows the amounts of the dentifrice used and the regression equation for each amount, and mean fluoride concentrations in oral fluid after 10- to 180-sec brushing time. The mean fluoride concentration in oral fluid at 10-sec brushing time was maximal, 455 ppm at 1.5 g of dentifrice and minimal, 64.4 ppm at 0.1 g, indicating that the range of the mean fluoride concentration was wide. Even with the usage of 1.0 g or 1.5 g of liquid fluoride dentifrice (1,000 ppmF), the initial active fluoride concentration did not reach 500 ppm. At 120-sec brushing time, close to. Fig. 2 Optimal amount of fluoride dentifrice (1 g). an actual typical brushing time, 300 ppm or higher mean fluoride concentrations were observed only for the treatment with 1.0 g or 1.5 g dentifrice. Figure 2 illustrates optimal amount of fluoride dentifrice (1 g) to prevent coronal caries effectively. 5. Optimal amount of dentifrice for children (3–6 years old) We were difficult to determine optimal amount of fluoride dentifrice for children because of doing experiment 2. However, in Japan, Yamaguchi and co-workers reported that mean amount of dentifrice for 3–4 years old found 0.29 g16). From a view point of developing enamel fluorosis (0.1 mgF/kg) by fluoride intakes of children, if children swal-.
(10) Optimal Amount of Fluoride Dentifrice. low 15% of fluoride dentifrice16) (500 ppmF) and their mean weight is 15 kg, the fluoride intake is 0.022 mgF or 0.0015 mg/kg, that is no problem. WHO recommended that amount of fluoride dentifrice must use with 0.25 g for six years old below from the same point15). Also Den Besten found that adequate amount of fluoride dentifrice for 4–5 years old was 0.25 g6). Therefore, amount of fluoride dentifrice for children (six years old below) to inhibit an incidence of enamel fluorosis should be used with 0.25 g.. Conclusion The present study was conducted to determine the optimal amount of fluoride dentifrice for adults by examining in vitro fluoride uptake into enamel and the fluoride concentration in oral fluid after treatment with fluoride dentifrice (1,000 ppmF) and by comparing in vitro and in vivo results. The results showed that at 300 to 500 ppm fluoride concentration near the enamel surface, fluoride uptake in the layer of enamel (several m)11,13) was remarkably increased. To obtain 300 ppm or higher mean fluoride concentration in oral fluid, 1.0 g or 1.5 g dentifrice was needed (p⬍0.05). It has been reported that the lowest limit of the concentration of fluoride for CaF2 formation under the neutral pH conditions is 300 ppm. Therefore, it was considered that CaF2 formation was strongly involved in fluoride uptake into enamel at 300 ppmF or higher active concentrations. In conclusion, from these two findings and the considerations regarding CaF2 formation, 1.0 g or more of fluoride dentifrice (1,000 ppmF) for adults was recommended as the actual optimal amount.. References 1) Aggeryd T (1983) Goals for oral health in the year 2000: cooperation between WHO, FDI and the national dental associations. Int Dent. 127. J 33:55–59. 2) Brudevold F, Soremark R (1967) Chemistry of mineral phase of enamel, Structural and Chemical Organization of Teeth, Miles AEW, 2nd ed., pp.247–277, Academic Press, New York. 3) Chandler S, Chio CC, Fuerstenau DW (1982) Transformation of calcium fluoride for caries prevention. J Dent Res 61:403–407. 4) Christoffersen J, Christffersen MR, Arends J, Leonardsen ES (1995) Formation of phosphatecontaining calcium fluoride at the expense of enamel, hydroxyapatite and fluoapatite. Caries Res 29:223–230. 5) Coklica V, Burudevold F (1966) Dentistry fractions in human enamel. Arch Oral Biol 11: 1261–1268. 6) Den Besten P, Ko HS (1996) Fluoride levels in whole saliva of preschool children after brushing with 0.25 g (pea-sized) as compared to 1.0 g (full-brush) of a fluoride dentifrice. Pediatr Dent 18:277–280. 7) Health Policy Bureau, Ministry of Health and Welfare, Japan (2001) Report on the Survey of Dental Diseases (1999), Dental Health Division of Health Policy Bureau, Ministry of Health, Labour and Welfare Japan (Ed), pp.124, Association of Oral Health, Tokyo. (in Japanese) 8) Institute of Lion Dental Hygiene (2003) Easily Understandable Statistical Graph of Oral Health Status in Japan, pp.54, Association of Futoku, Tokyo. (in Japanese) 9) Kanauya Y, Spooner P, Fox JL, Higuchi WI, Muhammad NA (1983) Mechanistic studies on the bioavailability of calcium fluoride for re-mineralization of dental enamel. J Pharmacol 16:171–179. 10) Kimoto K, Haresaku S, Taura K, Shimura M, Fujino E, Yamamoto T, Yoshihara A, Isozaki A, Arakawa H, Kobayashi S, Sakai O (2005) National survey on the school-based fluoride mouthrinsing program in Japan. J Dent Hlth 55:199–203. (in Japanese) 11) Koga H, Yoshinobu M, Matsukubo T, Takaesu Y (2002) Fluoride uptake human enamel and root surfaces with fluoride mouthrinces in vitro. J Dent Hlth 52:28–35. (in Japanese) 12) Larsen MJ, Jensen SJ (1994) Experiments on the initiation of calcium fluoride formation with reference to the solubility of dental enamel and brushite. Arch Oral Biol 39:23–27. 13) Maia LC, de Sonza IPR, Cury JA (2003) Effect of a combination of fluoride dentifrice and varnish on enamel surface rehardening and fluoride uptake in vitro. Eur J Oral Sci 111: 68–72. 14) Ten Cate JM (1997) Review on fluoride, with.
(11) 128. Koga H et al.. special emphasis on calcium fluoride mechanisms in caries prevention. Eur J Oral Sci 105: 461–465. 15) World Health Organization (1994) Fluoride and oral health. Report of WHO Expert Committee on Oral Health Status and Fluoride Use. World Health Organ Tech Rep Ser 846: 1–37. 16) Yamaguchi K, Kimoto K, Hirata Y, Arakawa H, Iiduka K (1993) Determination of fluoride retention in oral cavity after using fluoride dentifrice (III). J Dent Hlth 43:404–405. (in Japanese). Reprint requests to: Dr. Hiroshi Koga Department of Epidemiology and Public Health, Tokyo Dental College, 1-2-2 Masago, Mihama-ku, Chiba 261-8502, Japan E-mail: [email protected].
(12)
図

関連したドキュメント
Keywords: Convex order ; Fréchet distribution ; Median ; Mittag-Leffler distribution ; Mittag- Leffler function ; Stable distribution ; Stochastic order.. AMS MSC 2010: Primary 60E05
It is suggested by our method that most of the quadratic algebras for all St¨ ackel equivalence classes of 3D second order quantum superintegrable systems on conformally flat
In particular, we consider a reverse Lee decomposition for the deformation gra- dient and we choose an appropriate state space in which one of the variables, characterizing the
Keywords: continuous time random walk, Brownian motion, collision time, skew Young tableaux, tandem queue.. AMS 2000 Subject Classification: Primary:
Inside this class, we identify a new subclass of Liouvillian integrable systems, under suitable conditions such Liouvillian integrable systems can have at most one limit cycle, and
Next, we prove bounds for the dimensions of p-adic MLV-spaces in Section 3, assuming results in Section 4, and make a conjecture about a special element in the motivic Galois group
Transirico, “Second order elliptic equations in weighted Sobolev spaces on unbounded domains,” Rendiconti della Accademia Nazionale delle Scienze detta dei XL.. Memorie di
Then it follows immediately from a suitable version of “Hensel’s Lemma” [cf., e.g., the argument of [4], Lemma 2.1] that S may be obtained, as the notation suggests, as the m A
