GastroIntestinal Color Space and Its Application to Image Enhancement
7
0
0
全文
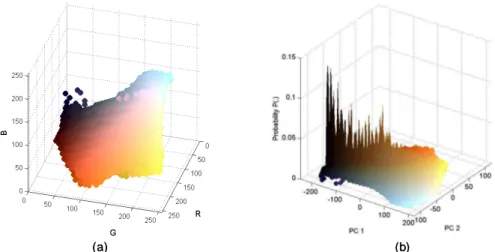
(2) Vol.2010-CVIM-173 No.21 2010/9/5 IPSJ SIG Technical Report. technique is inspired by the conventional histogram equalization technique transforming original pixel data to a new uniform distribution. Efficiency of the proposed technique is validated by experts through extensive evaluations in experiments. 2. The GI Color space 2.1 Material and generic GI color space Intuitively, constructing a consistent GI color space requires a large dataset of VCE sequences to cover a variety of patient data. In this study, we selected 30 sequences (each containing about 57,000 frames) from a database containing data for 300 patients, taking care in selecting a wide range of ages, both genders and varying lengths of video sequences. Subsequently, a large dataset containing ≈ 107 × 109 images was quantized using the popularity color algorithm. For an original RGB image (256 x 256 pixels), each color channel is divided into N bins to construct a global color histogram. The popularity algorithm simply selects the K color components with the highest histogram values. The components included in the space are uniquely collected from fully quantized data. The probability P(.) of a color component crgb is defined as:. (a) Fig. 1. (b). (a) The original GI color space in RGB space. (b) Distribution of P(.) with the color components plotted in PCA space.. color and the probability thereof provide cue information to cluster color components, as listed in Table 1. Because of the advantages of visualizing and clustering data, the use of the SOM technique6) is fully justified. The SOM is an unsupervised technique that makes use of a two-dimensional grid map for data clustering. The main aim of the SOM is to adjust iteratively the weights connecting inputs to outputs, so that ultimately these reflect the distance relations between input patterns. In this study, the SOM technique is deployed as a two stage scheme. The main task in the first stage is to construct a coarse map that makes it easy to label color components. Then, the coarse map is fine-tuned in the second stage by increasing the size of the grid map.. H(crgb ) , (1) T where H(crgb ) is the total number of pixels belonging to color crgb and T is the total number of pixels in the dataset. N = 32 and K = 256 are optimal values. Figure 1(a) shows the constructed color space in the original RGB space. To observe distributions of color components more easily, Fig. 1(b) shows P(.) plotted along the PC 1 and PC 2 axes, which are the primary components transformed from the original RGB space using Principal Component Analysis (PCA). Fig. 1(b) is also rendered using the true colors of the components. 2.2 Color Component Clustering A capsule image usually comprises the wall regions visualizing surfaces of rugae in the GI tract; non-wall regions expressed as darkness, and other artifacts such as water bubbles, bile, food, etc. The visible texture of the GI wall has unique color tones, for example, the surface of the stomach is usually pinkish in color, whereas small intestine tissue contains villi with yellowish colors. In terms of statistical measurement, Fig. 1(b) verifies that with a large dataset, the probability P(.) of noise is very small, whereas the P(.) of wall regions and dark regions is more robust. Therefore, the appearance of P(crgb ) =. Group (label) GI wall (1) Noise (2) Darkness (3). Table 1 Criteria for clustering color components Color Appearance Close to wall regions (reddish to yellow) Water bubbles (white), food, gas ... Black or high intensity grey. Probability High Low High. The color component x = [R G B] is an input vector used in training the SOM. First,. 2. c 2010 Information Processing Society of Japan.
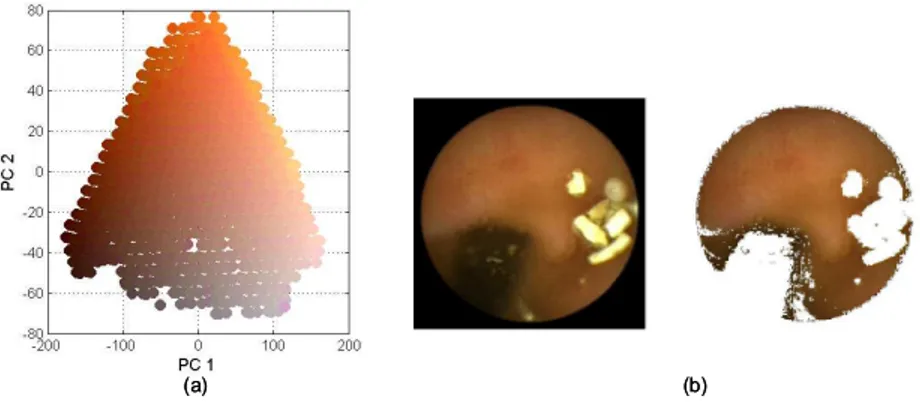
(3) Vol.2010-CVIM-173 No.21 2010/9/5 IPSJ SIG Technical Report. a simple map consisting of j × k nodes is created, in which the weights of nodes z jk are randomly initialized. Then the distance d jk between an input vector x and a map node z jk is computed by: d jk =. d X. (xi − w jk,i )2. P jk =. Based on the minimum distance of d jk , a node which is Best-Maching Unit (BMU) is identified. Weights of the BMU and its neighborhood are adjusted by: (3). These steps are repeats until the stop conditions, in which the learning rate η and neighborhood radius r are updated after each iteration. Fig. 2(a) shows the data distribution of the randomly initialized nodes (in total, 25 × 25 nodes) in the GI color space (Fig. 1(b)) to construct a coarse map. The resulting SOM after 10 iterations is shown in Fig. 2(b). In more detail, each node in the resulting SOM is a representative of similar input vectors. Two example nodes are shown zoomed-in in Fig. 2(c). These illustrations were generated using the SOM Toolbox in Matlab13) .. (a). (b). (4). where N is the number of input vectors connected to node z jk . To express P jk in the constructed map, the region within each node is utilized. Fig. 3(a) shows white regions the size of which is proportional to the value of P jk . Heuristically, the combination of color appearances and visualizations of their frequencies in Fig. 3(a) suggests a way of labeling nodes. Fig. 3(b) shows blue nodes manually assigned as wall regions (class 1) through an user interface. Nodes labeled in the first stage support a small amount of domain knowledge. Theoretically, the number of nodes selected should be as large as possible6) . In the second stage, the clustering result is fine-tuned by increasing the number of nodes, e.g., to 60 × 60. A fine map is constructed with unlabeled nodes. To assign labels to the new map, the K-Nearest-Neighbors (K-NN) algorithm is deployed. A label is assigned to the new node based on the majority votes of the K objects found from the coarse map. Fig. 3(c) shows a fine map with the labels assigned over nodes, in which the wall components (label 1) are bounded by white contours. Consequently, the wall components are separated from the generic GI color space, as shown in Fig. 4(a). Fig. 4(b) illustrates an example matching the wall colors to pixel data in an original image. The extracted regions suggests the colors that occurred as the GI wall regions are able to verify.. i=1. Fig. 2. Pi. i=1. (2). (r) (r) wr+1 jk,i = w jk,i + η(xi − w jk,i ). N X. (c). (a) Distribution of random data (in circles) in the GI color space. (b). The coarse SOM resulting. (c) Two representative nodes connecting similar input vectors (a). Fig. 3. Summing P(.) of the input vectors gives color distribution P jk of the representative node:. 3. (b). (c). (a) Visualizing P jk values in white hexagons. (b) Manually assigned labels for the wall components by blue nodes. (c) Clustering result in a fine SOM 60 × 60 nodes.. c 2010 Information Processing Society of Japan.
(4) Vol.2010-CVIM-173 No.21 2010/9/5 IPSJ SIG Technical Report. (a). Fig. 4. 3.2 Histogram equalization in the proposed GI color space Often the enhancement of certain features in images is accompanied by undesirable effects. This may cause of over-diagnostics or misunderstanding type of abnormal regions. For example, because FICE images are represented in false colors (e.g. B1/R, B2/R G/R) resulting in color gamut unfamiliar to the clinicians. Without proper training such images are difficult to interpret. Different from previous works, our main objective for image enhancement approaches is that we try to preserve color tones of the original image. This also responds to examining doctor’s requirement that colors and texture of inner wall near abnormality should be preserved. With the proposed GI color space, a prior information to identify the useful color gamut is available, therefore our enhancement task is to maximize the information conveyed from the image to examining doctors. This task is deal with by distributing the color data in an original image as uniformly as possible over available color tones in the GI space. Given a GI color space G(e.g, as shown in Fig. 4(a)), distributions of pixel data of a ROI is denoted by f . f (x, y) is in a range: f (x, y) = {L1 < a < L2 ; M1 < b < M2 } (5) Where a, b is pixel data in the space G. L1 , L2 and M1 , M2 are minimum and maximum values of distribution f in PC 1 and PC 2 axes, respectively. Because the space G is constructed from a large VCE sequences, it provides a maximum prior information about available colors in range L1 , L2 and M1 , M2 . Therefore, the enhancement task becomes giving the target image a flat distribution in the current range. This is similar to the aim of the conventional histogram equalization technique, which is to distribute the intensity information uniformly over the available intensity levels. The target image g(x, y) can be computed using the following cascaded transformation: g(x, y) = T −1 [O( f (x, y))] (6) where O(.) and T (.) are cd f functions. O(.) is build from each dimension of original distribution f (.), while T (.) is established based on a uniform data (typically, a uniform white noise). O(.) and T (.) functions are normalized with levels in range L1 , .., L2 (or M1 , .., M2 ). The entire process of the proposed technique is illustrated by the example in Fig. 5. From the ROI in Fig. 5(a), pixel data are transformed and plotted in 2D space of the GI wall color components. As depicted in Fig. 5(b), the dotted-blue line in the center graph expresses the boundary of the wall components, while the pixel data boundary is denoted by the solid-blue line. Distribution f (.) is denoted by blue. (b). (a). The wall components expressed in 2-D space by PCA transformation. (b) Left is original image, right is result of the segmented GI wall regions.. 3. Capsule Endoscopy (CE) image enhancement using the GI color space 3.1 Related works To enhance the contrast and the details of the CE image,7) and8) suggested solutions based on anisotropic diffusions approach. The enhanced images were generated by solving specific diffusion functions. In7) , based on analyzing the structure tensor of the CE image, two functions, which are adaptively determining the diffusion force according to characteristics of gradient and edge directions, were designed. In8) , a forward and backward anisotropic diffusion function was utilized in a contrast space. Because of darkness environments in the GI tube, the contrast space can effectively solve in gradient calculation, which is significant to successful of diffusion. However, as a potential problem of the diffusion process, the enhancement results are strongly depending on predetermined parameters in diffusivity functions. In term of the clinical application, the current CE diagnostic system (RapidReader Version 6.04) , supported elegantly enhancement functions, named as FICE (Flexible spectral Imaging Color Enhancement) mode. Originally, FICE is developed by Fujinon Ltd.11) for proper conventional endoscopy. FICE images are represented by a four-color vector: [B1 , B2 , G, R]. B1 is normally at a lower end of a blue range (400−430nm), chosen so because of the increased blood absorption in abnormal region. Particularly, this potentially can emphasis regions of higher blood fraction (ulcers, haemorrhages, dense vascular networks characteristic of angiogenesis, cancer).. 4. c 2010 Information Processing Society of Japan.
(5) Vol.2010-CVIM-173 No.21 2010/9/5 IPSJ SIG Technical Report. tiveness for all cases. It imply that our proposed method are more reliable than FICE modes, particularly in aspect of various type of abnormal images.. lines in the histograms on each axis shown in the left and bottom panels of the figure. The enhanced image is illustrated in Fig. 5(c). The red lines in Fig. 5(b) show the transformed data, thus confirming that the histograms are ”flat” in the local sense.. P. Score in an eval. Count Percentage (%). Table 2 12 2 3. Above baseline (%). Fig. 5. 23 2 3. Total 60 100. 84%. For qualitative evaluation, comparisons between the enhanced and original images are assessed at five levels: damaging, worse, ineffective, better and very clear. Scores are assigned from 1 for damaging, to 5 for the very clear level. Support from five examining doctors, all experts in gastroenterology, was included in implementing these evaluations. The baseline is established at the ineffective level, where abnormal regions in the enhanced image and the original image are identical. Table 2 provides further detail by giving the score distributions, in which 84% of the evaluations have a score above the baseline level; only in 2 cases are the enhanced images worse than the original images. Moreover, inspired by conventional histogram equalization, the proposed technique also offers an advantage in terms of computational time.. (a). (c). Score distributions in the evaluations by five examiners 15 16 17 18 19 20 21 22 8 9 11 7 8 5 7 1 13 15 18 12 13 8 12 2. (b). Image Enhancement Technique. (a). Original ROI. (b). Data distribution in the proposed color space. (See text for details). (c). The enhanced image. 5. Conclusions The complete process for generating the GI color space was explained in this paper. The GI wall and non-wall color components are separated in the proposed GI color space using a two stage clustering scheme. The clustering task is based on visualizing similar colors and their distributions using the SOM technique. Utilizing the proposed color space, a technique for image enhancement was described. This technique is able to limit over-diagnosis, that is, to retain the natural color tones of the original image. Experiments confirmed that in 84% of the cases, the enhanced image is clearer than the original image. The GI color space suffers from requirements to validate its accuracy. Several directions may be explored to solve this issue in future works, such as verifying the consistency of the GI space with different types of datasets; or evaluating the performance of wall regions segmented from original images. For the image enhancement technique, the current transformation implemented in separated axes of the GI color space, thus it lost. 4. Experimental Results To validate the proposed enhancement technique, 60 image pairs (each containing original and enhanced images) were prepared for evaluation. The ROIs are extracted from original images with windows of size 128 × 128 pixels. These ROIs include known types of abnormal regions, such as angiodysplasia, erosion, erythematous, and ulcers. Fig. 6 shows enhanced images by proposed method and FICE images at different modes. For erosion or angiodysplacia images (Case 2 and Case 3) in Fig. 6, FICE images #2 obtains quite good results. This is similar to evaluations in11) that FICE modes images obtain a good performance for bleeding images. However, for other types of abnormal regions, such as Case 1 (Ulcer) and Case 4 (Polyp), FICE images are unclear even compared to original images. As shown in Fig. 6, our proposed method obtains effec-. 5. c 2010 Information Processing Society of Japan.
(6) Vol.2010-CVIM-173 No.21 2010/9/5 IPSJ SIG Technical Report Case 1: Ulcer. Case 2: Erosion. Case 3: Angiodysplacia. Case 4: Polyp. (a) Original Image. Fig. 6. (b) Proposed method. (c) FICE mode #1. (c) FICE mode #2. (c) FICE mode #3. (c) FICE mode #4. Comparative results between proposed method and FICE images with four cases of abnormal regions.. choice selections, consensus of evaluations between examining doctors, statistical test to verify consistency in evaluation results are implemented in our future works.. correlation between dimensions. These limitations and spare data problems of histogram equalization technique were mentioned in1) or12) . These works suggest us to further research for CE images. Regarding performance evaluation, more aspects such as the best. 6. c 2010 Information Processing Society of Japan.
(7) Vol.2010-CVIM-173 No.21 2010/9/5 IPSJ SIG Technical Report. References 1) Bassiou, N. and Kotropoulos, C.: Color image histogram equalization by absolute dicounting back-off, Computer Vision and Image Understanding, Vol.107, pp.108–202 (2007). 2) Bonnel, J., Khademi, A., Krishnan, S. and Ioana, C.: Small bowel image classification using cross-co-occurrence matrices on wavelet domain, Biomedical Signal Processing and Control, Vol.4, No.1 (2009). 3) Cunha, J. P.S., Coimbra, M., Campos, P. and Soares, J.M.: Automated Topographic Segmentation and Transit Time Estimation in Endoscopic Capsule Exams, IEEE Trans. on Medical Imaging, Vol.27, pp.19–27 (2008). 4) Given Imaging Ltd.: RAPID Software Product, http://www.givenimaging.com/en-us2/ HealthCareProfessionals/Products/Pages/Software.aspx (2009). 5) Iddan, G., Meron, G., Glukovsky, A. and Swain, P.: Wireless Capsule Endoscope, Nature, Vol.405, p.417 (2000). 6) Kohonen, T.: Self-Organized Maps, Springer-Verlag, Heidelberg, Berlin, (Third Edition, 2001). 7) Li, B. and Meng, M.: Wireless Capsule Endoscopy Images Enhancement by Tensor Based Diffusion, In Proceeding of International Conference on Engineering in Medicine and Biology Society (2006). 8) Li, B. and Meng, M.: Wireless Capsule Endoscopy Images Enhancement using Contrast Driven Forward and Backward Anisotropic Diffusion, In Proceeding of International Conference on Image Processing (2007). 9) Mackiewicz, M., Berens, J. and Fisher, M.: Wireless Capsule Endoscopy Color Video Segmentation, IEEE Trans. on Medical Imaging, Vol.27, No.12, pp.1769–1781 (2008). 10) M.Coimbra and Cunha, J. P.S.: MPEG-7 visual descriptors - Contributions for automated feature extraction in Capsule Endoscopy, IEEE Trans. Circuits and Systems for Video Technology, Vol.16, No.5, pp.628–637 (2006). 11) Mouri, R., Yosida, S., Tanaka, S., Oka, S., Yoshihara, M. and Chayama, K.: Evaluation and validation of computed virtual chromoendoscopy in early gastric cancer, Vol.69, No.6 (2009). 12) Pichon, E., Niethammer, M. and Saprio, G.: Color Hisogram equalization through mesh deformation, Proceeding of International Conference on Image Processing 2003 (2003). 13) SOM Toolbox: http://www.cis.hut.fi/somtoolbox/ (2003). 14) Vu, H., Echigo, T., Sagawa, R., , Yagi, K., Shiba, M., Higuchi, K., Arakawa, T. and Yagi, Y.: Controlling the Display of Capsule Endoscopy Video for Diagnostic Assistance, IEICE Trans. on Information and Systems, Vol.E92-D, No.3, pp.512–528 (2009).. 7. c 2010 Information Processing Society of Japan.
(8)
図


+2

関連したドキュメント
I give a proof of the theorem over any separably closed field F using ℓ-adic perverse sheaves.. My proof is different from the one of Mirkovi´c
Keywords: continuous time random walk, Brownian motion, collision time, skew Young tableaux, tandem queue.. AMS 2000 Subject Classification: Primary:
This paper presents an investigation into the mechanics of this specific problem and develops an analytical approach that accounts for the effects of geometrical and material data on
The object of this paper is the uniqueness for a d -dimensional Fokker-Planck type equation with inhomogeneous (possibly degenerated) measurable not necessarily bounded
In the paper we derive rational solutions for the lattice potential modified Korteweg–de Vries equation, and Q2, Q1(δ), H3(δ), H2 and H1 in the Adler–Bobenko–Suris list.. B¨
While conducting an experiment regarding fetal move- ments as a result of Pulsed Wave Doppler (PWD) ultrasound, [8] we encountered the severe artifacts in the acquired image2.
Wro ´nski’s construction replaced by phase semantic completion. ASubL3, Crakow 06/11/06
In what follows, everything is stated in terms of color digraphs; color graphs can be modelled as color digraphs by replacing each edge of color k by a digon (arcs in both
