第 巻 第 号 抜 刷
年 月 発 行
Stylized facts of financialization
in Japanese non-financial corporations
Stylized facts of financialization
in Japanese non-financial corporations
Norihito Shimano
.Introduction
After the s, the developed countries have experienced a social phenomenon called financialization. Many previous literatures of financialization indicate that in the process of financialization, the roles of financial markets and financial transactions become much more important(Epstein( ), Krippner ( ), Orhangazi( a, b)). As financialization progresses, even non-financial corporations(hereafter NFCs)strengthens their relations with financial activities. For example, in the United States, NFCs have earned much more profits from financial investments than ever before over the past few decades(Krippner( )). As financialization advanced, NFCs became more and more involved with financial activities, and this is a particularly important characteristic of financialization.
So far previous studies have mainly made much of an ideology for corporate governance, “shareholder value orientation,” as the cause of financialization of NFCs in the Western countries. This ideology had its origins in the United States in s(Lazonick and O’Sullivan( )). It is well known that shareholder value orientation plays very important roles on financialization. Especially in NFCs, the spread of shareholder value orientation evokes many aspects of financialization such as the increase of financial investment, the surge in dividend payments, and the rise in profit share by changing management goals in NFCs(Boyer( ),
Krippner( ), Orhangazi( a, b), Stockhammer( )). Furthermore, some empirical studies insists that financialization caused by the spread of shareholder value orientation has suppressed capital accumulation in Western countries in the past few decades(Stockhammer( ), van Treeck( ), Clévenot et al( )). Thus far, previous studies of financialization have illuminated serious influences of financialization on NFCs of the Western countries to some extent focusing on the spread of shareholder value orientation.
However, on the other hand, financialization of non-Western countries have not been fully demonstrated. This is surprising when considering the fact that shareholder value orientation spreads even to outside the United States and European countries in these days and financialization prevails around many non-Western countries. Among the non-Western countries, Japan is an interesting country in the sense that financialization that was evoked by shareholder value orientation has caused many great changes in NFCs.
NFCs in Japan originally did not make much of interests of shareholders. Before the bubble economy collapsed in , cross-shareholdings among corporations were popular in Japan. However, after the bubble economy collapsed, changes in ownership structures such as the increase in the shareholdings of foreign investors, individuals, and trust banks who aggressively demand firms to meet shareholder value occurred in Japanese firms(Aoki et al( )). As a result, shareholder value orientation has penetrated Japanese NFCs since the s. As the shareholder value orientation spread in Japanese NFCs, the Japanese economy began to show several aspects of financialization after s. As a result of the financialization, many important changes were brought about in the Japanese economy. The increase of financial investments, the surge in dividend payments, and the change in income distribution and a regime of capital accumulation were particularly important.
This paper demonstrates how financialization has affected the Japanese economy through its effect on NFCs and shows the outlines of Japanese financialization. In doing so, I divide the Japanese NFCs into manufacturing and non-manufacturing industries and illuminate details of the effect of Japanese financialization on both of the industries. This paper shows how financialization has affected investment policies, income distribution and capital accumulation in Japanese manufacturing and non-manufacturing NFCs. This paper is a first attempt to analyze financialization in Japanese NFCs by industry and show the stylized facts of it).
This paper is organized as follows. Section shows how financialization in the Japanese economy has changed investment policies and income distribution of Japanese NFCs since the s. Section demonstrates the influence of financialization on capital accumulation in the Japanese economy from the s, focusing on the effect of functional income distribution on demand formation. Section concludes.
.Evidence for financialization in Japanese NFCs
In Japanese NFCs, a new ideology for corporate governance, shareholder value orientation, began to penetrate in Japanese NFCs from s. An important reason of the spread of this ideology is a change of ownership structure in Japanese NFCs. From the mid- s, cross-shareholdings between NFCs and financial institutions began to decrease in Japan because share price of financial institutions in Japan dropped from financial crisis in and many NFCs sold their shares of financial institutions. Before the s, such cross-shareholdings enabled Japanese NFCs to have nothing to do with hostile takeovers and run a business from a long-term
)This paper aims to complement the findings of Shimano( a)that describes the effect of financialization on investment policies and income distribution in all industries of Japanese NFCs by showing sectoral details of Japanese financialization.
perspective. However, after that, shareholders called “outsiders” who strongly demand interests of shareholders have dramatically increased in Japanese NFCs (Aoki et al( )). “Outsiders” consist of foreign investors, individuals, and trust banks, and the increase of such shareholders has gradually changed management goals of Japanese NFCs. Namely, management of Japanese NFCs became short-termism, and management goals such as short-term profits, share price, the dividend payout ratio became much more important in Japanese NFCs. The spread of shareholder value orientation evokes many aspects of financialization.
In general, as shareholder value orientation penetrates in NFCs, three aspects of financialization appear. First, financial investments increase because NFCs substitutes financial investments for real investments(Krippner( )). This is because financial investments are more suitable for making short-term profits than real investments. To make profits from capital investments needs a long duration of time, and the capital investments are sometimes suffered from uncertainty. Financial investments are more prompt way to earn profits. As financialization advances, therefore, financial investments increase and capital investments decrease. As a result, the substitution of financial assets for real assets occurs in the asset side of balance sheet in NFCs(Clévenot et al( )). Secondly, dividend payments dramatically increase because of a high pressure from shareholders. In the United States where the influence of shareholder value orientation is very powerful, the dividend payments have dramatically increased since the s(Skott and Ryoo ( ), van Treeck( )). Recently, even in a country like Germany where shareholder value orientation was originally not so powerful, the dividend payments have dramatically increased since the s because the protection of shareholder value has been gradually recognized in corporate governance(Duenhaupt( )). The great increase of dividend payments caused by shareholder value orientation is an important aspect of financialization. Thirdly, a change in functional income
distribution occurs. Namely, the profit share rises because NFCs raises mark-up to secure profits for paying large dividend payments(Boyer( ), Hein and Schoder ( )). This pro-shareholder income distribution, the rise in profit share, has been the common trend in functional income distribution of the developed countries in the past few decades. Of course, such a change in functional income distribution caused by financialization can influence demand formation in a country through some routes.
Among the three aspects, as for dividend payments, Shimano( )shows trends of the dividend payments of Japanese NFCs by industry in detail. Shimano ( )shows that both the amount of dividend payments and the ratio of dividend payments to capital stock have dramatically increased in both manufacturing and non-manufacturing industries in Japanese NFCs since the s. On the other hand, with regard to the effect of financialization on trends of financial investments and income distribution in Japanese NFCs, no studies have attempted to reveal the whole figures of these aspects by industry. Therefore, I show details of the trend of financial investments and income distribution in both Japanese manufacturing and non-manufacturing NFCs, and provide a much more complete picture of financialization in Japanese NFCs.
− .Financial investments and financial revenues in Japanese NFCs At first, I show trends of financial investments from to . From all-industry level analysis, Shimano( b)indicates that financialization erodes large firms more deeply than small and medium-sized firms). This tendency is the same in both manufacturing and non-manufacturing industries. Figure and show the )Shimano( b)shows that in all-industry-level, the ratio of total financial assets to total assets had increased by .% from Q to Q in Japanese large NFCs, but it had increased by .% during the same period in Japanese small and medium-sized NFCs. Q was the start point of surge in financial investment in Japanese NFCs.
0 0.1 0.2 0.3 0.4 0.5 0.6 1964 Q1 1967 Q1 1970 Q1 1973 Q1 1976 Q1 1979 Q1 1982 Q1 1985 Q1 1988 Q1 1991 Q1 1994 Q1 1997 Q1 2000 Q1 2003 Q1 2006 Q1 2009 Q1 2012 Q1 liquidity financial assets fixed financial assets equity in fixed assets total financial assets tangible fixed assets
ratio of respective assets to total assets in Japanese large NFCs in both industries). In Japanese NFCs, effects of financialization is deepest in large firms that is capitalized over billion yen(Shimano( ),( b)). Therefore, I choose large firms to clearly show the trend of financialization.
As these tables show, the ratio of total financial assets to total assets has
)Data of all figures and tables in this paper is taken from Corporate Statistics published by Ministry of Finance. If quarterly data are used, all variables are seasonally adjusted based on the Census X using Eviews . In these figures, total financial assets are composed of liquidity financial assets and fixed financial assets. Liquidity financial assets are financial assets that belong to liquidity assets, and fixed financial assets are financial assets that belong to fixed assets. Equity in fixed assets is one of the components of fixed financial assets. See Shimano ( b)for detailed definitions of these variables.
)On the contrary, effects of financialization is relatively weak in small and medium-sized firms that is capitalized between ten million and one billion yen. In the figures of this paper, all firms include both large firms and small and medium-sized firms. However, as shown in Table and , the increase of total financial assets and the decrease of tangible fixed assets since the late
s can also be seen all firms and small and medium-sized firms.
Figure :The ratio of respective assets to total assets in Japanese large NFCs, in manufacturing industries, −
liquidity financial assets fixed financial assets equity in fixed assets total financial assets tangible fixed assets
0 0.1 0.2 0.3 0.4 0.5 0.6 1964 Q1 1967 Q1 1970 Q1 1973 Q1 1976 Q1 1979 Q1 1982 Q1 1985 Q1 1988 Q1 1991 Q1 1994 Q1 1997 Q1 2000 Q1 2003 Q1 2006 Q1 2009 Q1 2012 Q1
dramatically increased since the late s in both industries, especially in large firms. This reflects the great increase of financial investments in Japanese large NFCs in the same period. Also, it can be found from these tables that the ratio of tangible fixed assets to total assets has remarkably decreased in both industries, especially in large firms. The substitution of financial assets to tangible fixed assets occurred in both industries. The substitution of financial assets for real assets is a remarkable characteristic of financialization(Clévenot et al( )).
It is worthy of note that the degree of substitution is more serious in non-manufacturing industries than in non-manufacturing industries. This also can be detected from Table and that show the ratio of total financial assets and tangible fixed assets to total assets in NFCs of both industries.
While the ratio of total financial assets to total assets rose by .% from Q to Q in manufacturing large NFCs, this ratio rose by .% in
non-Figure :The ratio of respective assets to total assets in Japanese large NFCs, in non-manufacturing industries, −
manufacturing industries in the same period. The ratio of tangible fixed assets to total assets dropped by .% from Q to Q in manufacturing large NFCs, and the ratio dropped by .% in non-manufacturing industries in the same period. These figures show a deeper influence of financialization on Japanese non-manufacturing NFCs.
The great increase of financial investments brought about a surge in financial revenues in both industries. Figure and show the amount of financial revenues in both industries of Japanese NFCs.
From Figure and , it is apparent that financial revenues have also dramatically increased since the s, especially in large firms. The amount of financial revenues approximately doubled from s in large firms in both
Q Q Q Q
all firms tangible fixed assets .% .% .% .%
total financial assets .% .% .% .%
large firms tangible fixed assets .% .% .% .%
total financial assets .% .% .% .%
small and medium-sized firms
tangible fixed assets .% .% .% .%
total financial assets .% .% .% .%
Q Q Q Q
all firms tangible fixed assets .% .% .% .%
total financial assets .% .% .% .%
large firms tangible fixed assets .% .% .% .%
total financial assets .% .% .% .%
small and medium-sized firms
tangible fixed assets .% .% .% .%
total financial assets .% .% .% .%
Table : The ratio of respective assets to total assets in Japanese manufacturing NFCs
Table : The ratio of respective assets to total assets in Japanese non-manufacturing NFCs
all firms large firms small and medium-sized firms 0 500,000 1,000,000 1,500,000 2,000,000 2,500,000 3,000,000 1964 Q1 1967 Q1 1970 Q1 1973 Q1 1976 Q1 1979 Q1 1982 Q1 1985 Q1 1988 Q1 1991 Q1 1994 Q1 1997 Q1 2000 Q1 2003 Q1 2006 Q1 2009 Q1 2012 Q1
all firms large firms small and medium-sized firms 0 1,000,000 2,000,000 3,000,000 4,000,000 5,000,000 1964 Q1 1967 Q1 1970 Q1 1973 Q1 1976 Q1 1979 Q1 1982 Q1 1985 Q1 1988 Q1 1991 Q1 1994 Q1 1997 Q1 2000 Q1 2003 Q1 2006 Q1 2009 Q1 2012 Q1 industries.
The cause of the rise in financial revenues in Japanese large NFCs is due to great increase of dividend income from equity in fixed assets(not equity in liquidity assets). Isobe( , ) indicate that Japanese large NFCs have greatly increased the holding of equity in fixed assets since s through substantial growth in holding of equities in affiliated companies. According to Isobe( ,
Figure : Financial revenues in Japanese manufacturing NFCs, ∼ (in billions yen)
Figure : Financial revenues in Japanese non-manufacturing NFCs, ∼ (in billions yen)
), important reasons for the growth in holding of equities in affiliated companies are aggressive investments in overseas subsidiaries in Japanese large NFCs and increase of their merger and acquisition of foreign companies. The ratio of equity in fixed assets to total assets in Japanese large NFCs in all-industry was only .% in and .% in , but the ratio reached .% in after great increase in the s. In listed companies, the ratio of equity of affiliated firms to total assets was % in , but the ratio began to increase especially in the s, and exceeded % in in Japanese large NFCs in all industry. Most of equity in fixed assets consist of equity of affiliated firms in Japanese large NFCs. Isobe ( )shows that a significant proportion of great increase of dividend income in Japanese large NFCs since the s can be explained by the increase of dividend income from foreign direct investment returns. The increase of financial investments have changed the composition of asset side of balance sheet in Japanese large NFCs.
Reflecting the great increase of financial revenues, the ratio of financial revenues to gross profits has also soared since the s. Figure and show the ratio of financial revenues to gross profits in manufacturing and non-manufacturing industries of Japanese NFCs.
A surge in the ratio occurred in both industries from the s, especially in large firms). Gross profits are the sum of operating profits and depreciation and represent the profits from productive activities. Therefore, a surge in the ratio of financial revenues to gross profits means that the source of profit-making changed from productive activities to financial activities. Through the increasing influence of finanacialization, the degree of dependence upon financial revenues in Japanese NFCs has apparently increased since the s in both industries.
From the trends of financial investments and financial revenues, it is apparent )The ratio of financial revenues to gross profits became more than twice during the s both manufacturing and non-manufacturing industries.
all firms large firms small and medium-sized firms 0 0.2 0.4 0.6 0.8 1964 Q1 1967 Q1 1970 Q1 1973 Q1 1976 Q1 1979 Q1 1982 Q1 1985 Q1 1988 Q1 1991 Q1 1994 Q1 1997 Q1 2000 Q1 2003 Q1 2006 Q1 2009 Q1 2012 Q1
all firms large firms small and medium-sized firms 0
0.2 0.4 0.6
1964 Q1 1967 Q1 1970 Q1 1973 Q1 1976 Q1 1979 Q1 1982 Q1 1985 Q1 1988 Q1 1991 Q1 1994 Q1 1997 Q1 2000 Q1 2003 Q1 2006 Q1 2009 Q1 2012 Q1
that the way of earning profits in Japanese NFCs changed from s. The importance of financial investments to acquire profits in Japanese NFCs has greatly increased.
− .Dividend payments in Japanese NFCs
In addition to the increase of financial investments and financial revenues, the rise in financial payments like dividend payments also appears when financialization
Figure : The ratio of financial revenues to gross profits in Japanese manufacturing NFCs(all firms), ∼
Figure : The ratio of financial revenues to gross profits in Japanese non-manufacturing NFCs(all firms), ∼
2,000,000 4,000,000 6,000,000 8,000,000 10,000,000 1964 1967 1970 1973 1976 1979 1982 1985 1988 1991 1994 1997 2000 2003 2006 2009 2012 manufacturing industries non-manufacturing industries penetrates NFCs. This is simply because high pressures from shareholders evoked by shareholder value orientation makes firms pay larger dividends. Shimano ( )shows that Japanese NFCs have greatly increased their dividend payments since the s). Figure shows the amount of dividend payments in Japanese manufacturing and non-manufacturing NFCs from to .
From the Figure , it is apparent that the amount of dividend payments has dramatically increased in both Japanese manufacturing and non-manufacturing industries since the s. In manufacturing NFCs, although the dividend payments decreased temporarily in the late s, it has recovered again since . In non-manufacturing NFCs, the dividend payments tremendously increased in the first half of s, and it has also had an increasing trend since the late s. Dividend payout policies in Japanese NFCs have been more friendly with shareholders since the s.
)Shimano( ) shows that the amount of dividend payments in Japanese NFCs has dramatically increased since the s. Dividend payments of all industries in Japanese NFCs in
was three times as large as dividend payments in .
Figure : The dividend payments in Japanese manufacturing and non-manufacturing NFCs, ∼ (in billions yen)
all firms large firms small and medium-sized firms 0 0.2 0.4 0.6 1964 Q1 1967 Q1 1970 Q1 1973 Q1 1976 Q1 1979 Q1 1982 Q1 1985 Q1 1988 Q1 1991 Q1 1994 Q1 1997 Q1 2000 Q1 2003 Q1 2006 Q1 2009 Q1 2012 Q1
all firms large firms small and medium-sized firms 0 0.2 0.4 0.6 0.8 1964 Q1 1967 Q1 1970 Q1 1973 Q1 1976 Q1 1979 Q1 1982 Q1 1985 Q1 1988 Q1 1991 Q1 1994 Q1 1997 Q1 2000 Q1 2003 Q1 2006 Q1 2009 Q1 2012 Q1 − .Functional income distribution in Japanese NFCs
Next, I reveal trends of income distribution in both Japanese manufacturing and non-manufacturing NFCs. Figure and illustrate the rising trend of the profit share in both industries except the depression from to , especially in large firms.
Crotty( ), Stockhammer( , ) and Dallery( ) indicate that firms prefer short-term profits to long-term growth as a management goal under the influence of shareholder value orientation because shareholders prefer the recent
Figure : The profit share in Japanese manufacturing NFCs, −
wage share wage for employees / value added welfare expenses / value added compensation for officers / value added dividend payments / value added retained earnings / value added −0.4 −0.2 0 0.2 0.4 0.6 0.8 1964 1967 1970 1973 1976 1979 1982 1985 1988 1991 1994 1997 2000 2003 2006 2009 2012
profits to keep the stock price and pay sufficient dividends. Boyer( )also argues that firms raise their profit share to secure profits for dividend payments under pressures from shareholders. The rise in profit share is the same meaning as the decline in wage share. For the duration of the increase in dividend payments, Japanese large NFCs maintained retained earnings and increased the dividend payments at the expense of wage share since the s. The wage share is defined as the share of personal expenses in value added. When personal expenses are decomposed into wage for employees, compensation for officers, and welfare expenses, it turns out that that an erosion of wage for employees was the most severe from the late s. Figure and show the components of expenditures and saving as a share of value added in both industries of Japanese large NFCs from
to .
Table and also show detailed figures about income distribution of Japanese NFCs.
Figure : Components of expenditures and saving as a share of value added in Japanese large manufacturing NFCs, −
wage share wage for employees / value added welfare expenses / value added compensation for officers / value added dividend payments / value added retained earnings / value added −0.1 0 0.1 0.2 0.3 0.4 0.5 0.6 1964 1967 1970 1973 1976 1979 1982 1985 1988 1991 1994 1997 2000 2003 2006 2009 2012
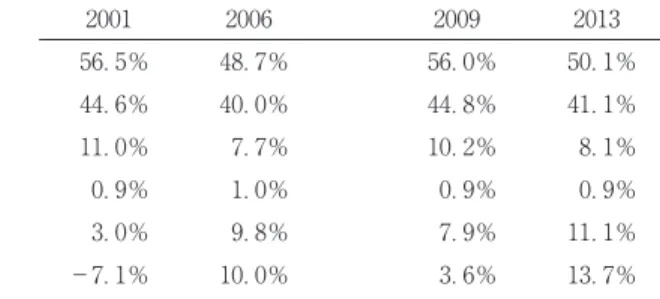
Table and show that with the spread of shareholder value orientation, rentiers gained dividend incomes from the fall in wage share. When focusing on the difference of the industries, it can be said that the decrease in wage share and the increase in dividend payments differ among the industries. From to , the wage share dropped by .% in manufacturing industries and by .% in non-manufacturing industries. In the same period, the ratio of dividend payments to
wage share .% .% .% .%
wage for employees .% .% .% .%
welfare expenses .% .% .% .%
compensation for officers .% .% .% .%
dividend payments .% .% .% .%
retained earnings − .% .% − .% .%
Figure : Components of expenditures and saving as a share of value added in Japanese large non-manufacturing NFCs, −
Table : Components of expenditures and saving as a share of value added in Japanese large manufacturing NFCs, −
value added rose by .% in manufacturing industries and by .% in non-manufacturing industries. From to , the wage share dropped by .% in manufacturing industries and by .% in non-manufacturing industries. In the same period, the ratio of dividend payments to value added rose by .% in manufacturing industries and by .% in non-manufacturing industries.
These figures show that in both periods, the decrease in the wage share in manufacturing industries was larger than that in non-manufacturing industries. On the other hand, the increase in percentage of dividend payments was larger in manufacturing industries than in non-manufacturing industries from to , but the order reversed from to . There are differences among the industries like these, but both of the industries share the common trend of income distribution from the s that the increase in profit share and dividend payments coexist.
This pro-shareholder income distribution reflects changes in the structure of stock ownership in Japanese NFCs. The ratio of cross-shareholding among firms declined from .% in to .% in , while stock ownership ratio of foreign investors, individual investors, institutional investors rose since the mid-s. Especially, stock ownership ratio of foreign investors increased from % in to % in . Sasaki and Yonezawa( )reveal that foreign stock
wage share .% .% .% .%
wage for employees .% .% .% .%
welfare expenses .% .% .% .%
compensation for officers .% .% .% .%
dividend payments .% .% .% .%
retained earnings − .% .% .% .%
Table : Components of expenditures and saving as a share of value added in Japanese large non-manufacturing NFCs, −
ownership ratio had a significant negative influence on the wage share in Japanese large firms, while stock ownership ratio of main bank had a positive influence. From decomposition of the wage share, Noda and Abe( ) show that the decrease of per capita wage was more important than the growth of labor productivity for the decline of the wage share from to in Japanese large firms. Then, Noda and Abe( )estimate wage equations and found that foreign stock ownership ratio had a significant negative impact on wage in Japanese large firms from to . On the other hand, Noda and Abe( )show that stock ownership ratio of financial institutions and business firms had a positive impact on wage in Japanese profitable large firms. These results imply that the rise in foreign stock ownership ratio and the decline of stock ownership ratio of stable shareholders have contributed to the rise in profit share since the s.
.Financialization and capital accumulation in Japanese NFCs
In the previous section, I showed actual states of financialization in Japanese NFCs. In this section, I further reveal details of the effect of Japanese financialization on capital accumulation by industry.First, I show the rate of capital accumulation in Japanese manufacturing and non-manufacturing NFCs, from Q to Q . Figure shows the rate of capital accumulation in both industries.
Figure indicates that the rate of capital accumulation in manufacturing industries has been larger than that in non-manufacturing industries since the s. Figure reveals that after bubble economy collapsed in , the rate of capital accumulation stagnated in Japanese NFCs, but the slowdown of capital accumulation has been more serious in non-manufacturing industries than manufacturing industries in Japan. After s, compared with non-manufacturing industries that experienced serious stagnation of capital accumulation, stagnation of capital accumulation in
manufacturing industries non-manufacturing industries −0.02 0 0.02 0.04 0.06 0.08 0.1 0.12 1964 Q1 1967 Q1 1970 Q1 1973 Q1 1976 Q1 1979 Q1 1982 Q1 1985 Q1 1988 Q1 1991 Q1 1994 Q1 1997 Q1 2000 Q1 2003 Q1 2006 Q1 2009 Q1 2012 Q1
manufacturing industries was not so hard. From Q to Q , the average value of the rate of capital accumulation was . % in manufacturing industries and
. % in non-manufacturing industries.
Then, what caused the difference of the pace of capital accumulation between Japanese manufacturing and non-manufacturing industries after the s ? The most convincing explanation is that the effect of functional income distribution on demand formation differs among the industries. The rise in profit share influences each components of aggregate demand. It has a negative effect on consumption through income distribution from workers who have high propensity to consume to capitalists and rentiers who have low propensity to consume. Generally, since the negative effect of the rise in profit share on consumption is larger than its positive effect on investment, the rise in profit share has negative effect on domestic demand that is composed by consumption and investment(Stockhammer and Stehrer
( )).
Figure : The rate of capital accumulation in Japanese manufacturing and non-manufacturing NFCs(all firms), −
However, the rise in profit share stimulates exports since it decreases the cost effect of wages. The decline in wage share leads to the fall in unit labor cost. Even if the rise in profit share depressed domestic demand and domestic demand regime is wage-led, it may increase aggregate demand and aggregate demand regime becomes profit-led on the condition that the positive effect of the rise in profit share on export exceeds its negative effect on domestic demand. Therefore, industries with high dependence on exports tend to be profit-led and industries with low dependence on exports tend to be wage-led.
With regression results of consumption, investment, and net exports function, Shimano( a)concluded that from the s, while the rise in profit share caused by financialization depressed domestic demand, but it increased aggregate demand because the positive effect of rising profit share on exports had been so large). Namely, the Japanese economy has been wage-led in domestic demand, but has been profit-led in aggregate demand that is the sum of domestic demand and net exports since the s. From the empirical results, it is expected that the increase of profit share raises demand in manufacturing industries that highly depend on exports but depresses demand in non-manufacturing industries that mainly depend on domestic demand. An accelerator effect caused by growing demand is the prominent factor to stimulate investment(Chirinko( )). Therefore, if the rise in profit share increases net exports and aggregate demand, it also contributes to a promotion of capital accumulation in industries heavily depend upon exporting. Similarly, if the rise in profit share decreases domestic demand through its negative effect on domestic demand, it also contributes to slowdown of capital accumulation. This may explain the difference of speed of capital accumulation between Japanese
)Shimano( a)shows that percent increase in profit share bring about . percent decrease in domestic demand but . percent increase in aggregate demand from his calculation of the functions.
manufacturing and non-manufacturing industries after the s.
The difference of speed of capital accumulation between the two industries also caused an change in capital accumulation regime in the Japanese economy. Generally, the movement of the rate of capital accumulation is mainly determined by that of the profit rate. In fact, as shown in Figure and , this is the case for the Japanese economy before the s in both manufacturing and non-manufacturing industries.
The figures show that the movement of the rate of capital accumulation was perfectly determined by that of the profit rate before the s. However, the figures also show that the great change occurred in capital accumulation regime since the s. Although the rate of capital accumulation has still been determined by the profit rate in manufacturing industries since the s, it has no longer been determined by the profit rate in non-manufacturing industries over the same period). After the s, although the profit rate recovered, the rate of capital accumulation remained stagnant in non-manufacturing industries.
The abnormal change in capital accumulation regime in non-manufacturing industries after the s can be explained by the effect of rising profit share on capital accumulation. The rise in profit share raised the profit rate. However, it depressed capital accumulation in non-manufacturing industries by lowering the level of domestic demand. That is why the rising trend of profit rate and the declining trend of rate of capital accumulation have coexisted and the rate of capital accumulation has no longer been determined by the profit rate since the s in non-manufacturing industries in Japanese NFCs. On the other hand, the rise in
)Shimano( a)estimates a simple investment function that only includes the profit rate as an explanatory variable for all firms of manufacturing and non-manufacturing industries in Japanese NFCs from Q to Q . Estimation results of the investment function is that while the profit rate is estimated positively and significantly at % level in manufacturing industries, it is not estimated significantly in non-manufacturing industries.
the profit rate the rate of capital accumulation 0 0.02 0.04 0.06 0.08 0.1 0.12 0.14 0.16 1964 Q1 1967 Q1 1970 Q1 1973 Q1 1976 Q1 1979 Q1 1982 Q1 1985 Q1 1988 Q1 1991 Q1 1994 Q1 1997 Q1 2000 Q1 2003 Q1 2006 Q1 2009 Q1 2012 Q1
the profit rate the rate of capital accumulation −0.02 0 0.02 0.04 0.06 0.08 0.1 0.12 1964 Q1 1967 Q1 1970 Q1 1973 Q1 1976 Q1 1979 Q1 1982 Q1 1985 Q1 1988 Q1 1991 Q1 1994 Q1 1997 Q1 2000 Q1 2003 Q1 2006 Q1 2009 Q1 2012 Q1
Figure : The profit rate and the rate of capital accumulation in Japanese manufacturing NFCs(all firms), −
Figure : The profit rate and the rate of capital accumulation in Japanese non-manufacturing NFCs(all firms), −
profit share has raised not only the profit rate but also the rate of capital accumulation by raising the level of aggregate demand in manufacturing industries over the same period. Therefore, the movement of the profit rate has still corresponded with that of the rate of capital accumulation and accumulation has still been determined by the profit rate in manufacturing industries since the s. In this way, the rising profit share has generated totally different capital accumulation regimes in the two industries because its effect on demand formation utterly differs among these industries.
.Conclusion
This paper has shown details of financialization in Japanese NFCs. With respect to the increase of financial investments, the increase of dividend payments, and the rise in profit share, both Japanese manufacturing and non-manufacturing NFCs have shown all of the important signs of financialization since the s, mainly due to the spread of shareholder value orientation. Financialization has deeply affected the Japanese economy in several ways after the bubble economy collapsed regardless of the difference of industries.
Interestingly, however, the effect of financialization on capital accumulation has differed between the two industries. After the s, the slump of capital accumulation has been more serious in non-manufacturing industries than in manufacturing industries. Furthermore, a regime of capital accumulation has also differed between the two industries since the s. After the collapse of the bubble economy in , the profit rate and the rate of capital accumulation have still corresponded in manufacturing industries, but trends of the two variables have differed in non-manufacturing industries. In non-manufacturing industries, the rising trend of the profit rate and the decreasing trend of the rate of capital accumulation have coexisted.
Behind the difference of a regime of capital accumulation, there have been pro-shareholder income distribution, namely the rise in profit share caused by financialization. The rise in profit share since the s has increased a demand level in manufacturing industries through its positive effect on exports. But it has decreased a demand level in non-manufacturing industries through its negative effect on domestic demand. The rising profit share from the s has raised capital accumulation in manufacturing industries by causing the growing demand, but it has depressed capital accumulation in non-manufacturing industries by decreasing the level of demand. Since the rise in profit share has uniformly increased the profit rate in both industries, the differing effect of the rise in profit share on capital accumulation generated the varying regime of capital accumulation between manufacturing and non-manufacturing industries.
Thus, many aspects such as investment policies, income distribution, and a regime of capital accumulation has been changed as a result of financialization in the Japanese NFCs since the s.
Acknowledgements
This work was supported by Research Grant from Matsuyama University in .
References
Aoki, M., Jackson, G., and Miyajima, H.[ed],( ) Corporate Governance in Japan : Institutional Change and Organizational Diversity, Oxford University Press.
Boyer, R.( ) “Is a Finance-led Growth Regime a Viable Alternative to Fordism ? : A Preliminary Analysis”, Economic and Society, Vol. , No. , pp. − .
Chirinko, R, S.( ) “Business Fixed Investment Spending : Modeling Strategies, Empirical Results, and Policy Implications”, Journal of Economic Literature, Vol. , No. , pp. −
.
Clevenot, M., Guy, Y. and Mazier, J.( )“Investment and The Rate of Profit in a Financial Context”, International Review of Applied Economics, Vol. , No. , pp. − .
Crotty, J.( ) “Owner-manager Conflict and Financial Theory of Investment Stability : A Critical Assessment of Keynes, Tobin and Minsky”, Journal of Post Keynesian Economics, Vol. , No. , pp. − .
Dallery, T.( ) “Post-Keynesian Theories of the Firm under Financialization”, Review of Radical Political Economics, Vol. , No. , pp. − .
Duenhaupt, P.( )“Financialization and the Rentier Income Share- Evidence from US and Germany”, International Review of Applied Economics, Vol. , No. , pp. − .
Epstein, G.,[ed.],( )Financialization and the World Economy, Northampton, MA, Edward Elgar.
Hein, E. and Schoder, C.( )“Interest Rates, Distribution and Capital Accumulation−A Post-Kaleckian Perspective on the US and Germany”, International Review of Applied Economics, Vol. , No. , pp. − .
Isobe, S.( )“The Change of Financial Structure in Japanese Firms from to ”, Finance, Vol. , pp. − (In Japanese).
Isobe, S.( )“The Change of Financial Structure in Listed Firms and Unlisted Firms in Japan”, Finance, Vol. , pp. − (In Japanese).
Krippner, G.( )“The Financialization of the American Economy”, Socio-Economic Review, Vol. , No. , pp. − .
Lazonick, W. and O’Sullivan, M.( )“Maximizing Shareholder-value : a New Ideology for Corporate Governance”, Economic and Society, Vol. , No. , pp. − .
Noda, T. and Abe, M.( )“The Wage Share and the Decline of Wages”, in Higuti, Y.[eds.], Labor Market and Income Distribution, Keio Gijuku Daigaku Syuppankai(In Japanese). Orhangazi, O.( a)“Financialization and Capital Accumulation in the Non-financial Corporate
Sector : A Theoretical and Empirical Investigation on the US Economy : − ”, Cambridge Journal of Economics, Vol. , No. , pp. − .
Orhangazi, O.( b)Financialization and the US economy, Cheltenham : Edward Elgar. Sasaki, T and Yonezawa, Y.( )“Corporate Governance and the FirmValue”, Security Analysts
Journal , Vol. , No. , pp. − (In Japanese).
Shimano, N.( ) “An Empirical Analysis of the Effect of Financializationon Capital Accumulation in Japan”, Political Economy Quarterly, Vol. , No. , pp. − (In Japanese). Shimano, N.( a)“The Effect of Pro-shareholder Income Distribution and Financial Investment on Capital Accumulation−evidence from Japanese Non-financial Firms”, Shikakeizaigakkai Ronnsyuu.
Shimano, N.( b)“The Cause of Change in Pattern of Capital Accumulation in the Japanese Economy”, Political Economy Quarterly, Vol. , No. , pp. − (In Japanese).
Journal of Economics, Vol. , No. , pp. − .
Stockhammer, E.( ) “Shareholder Value Orientation and the Investment-Profit Puzzle”, Journal of Post Keynes in Economics, Vol. , No. , pp. − .
Stockhammer, E.( )“Some Stylized Facts on the Finance-Dominated Accumulation Regime”, Competition and Change, Vol. , No. , pp. − .
Skott, P. and Ryoo, S.( ) “Macroeconomic Implications of Financialization”, Cambridge Journal of Economics, vol. , No. , pp. − .
Stockhammer, E. and Stehrer, R.( )“Goodwin or Kalecki in Demand ? Functional Income Distribution and Aggregate Demand in the Short Run”, Review of Radical Political Economics, Vol. , No. , pp. − .
van Treeck, T.( )“Reconsidering the Investment-Profit Nexus in Finance-ledEconomies : An ARDL-based Approach”, Metroeconomica, Vol. , No. , pp. − .