Problems in Trace Analysis of Pesticide Using GC‑MS, and Approach towards their Improvements
著者 Sugitate Kuniyo
journal or
publication title
金沢大学大学院自然科学研究科博士学位論文, 114p.
number 2012
page range 1‑114
year 2013‑03‑26
URL http://hdl.handle.net/2297/34831
博士論文
Problems in Trace Analysis of Pesticide Using GC-MS, and Approach towards their Improvements
GC-MS
の高感度化に伴う農薬分析上の問題点及び改善へのアプローチ
金沢大学大学院自然科学研究科 環境科学専攻
環境動態講座
学 籍 番 号 1 0 2 3 1 4 2 4 0 5
氏 名 杉 立 久 仁 代
主 任 指 導 教 官 名 早川 和一 教授
Contents
Contents ...i
List of Abbreviations ...iv
General Introduction ... 1
Chapter 1 Deoxidation of Fenthion Sulfoxide, Fenthion Oxon Sulfoxide and Fnsulfothion in GC-MS, and the Prevention of Sulfoxide Deoxidation by Polyethylene Glycol 300 ... 7
1.1 Introduction ... 7
1.2 Experimental ... 9
1.2.1 Reagents and Chemicals ... 9
1.2.2 Apparatus ... 11
1.3 Results and Discussion ... 11
1.3.1 Concentration and solvent ... 11
1.3.2 Ion source temperature ... 12
1.3.3 The cause of the “shifted base peak” ... 12
1.3.4 Addition of polyethylene glycol 300 (PEG 300) ... 17
1.3.5 Possibility of deoxidation at the injection port ... 23
1.3.6 Additional effect ... 23
2.1 Introduction ... 28
2.2 Experimental ... 29
2.2.1 Reagents and Chemicals ... 29
2.2.2 Apparatus ... 29
2.2.3 Gold-Plated Ion Source ... 30
2.2.4 Sample and Sample Preparation ... 30
2.3 Results and Discussion ... 32
Chapter 3 Search of Components Causing Matrix Enhancement Effect on GC-MS for Pesticide Analysis in Foods ... 43
3.1 Introduction ... 43
3.2 Experimental ... 43
3.2.1 Materials and Methods ... 43
3.2.1.1 Experiment 1: Search for the components in agricultural products ... 43
3.2.1.2 Experiment 2: Evaluation of the components which cause the matrix enhancement effect ... 44
3.2.1.3 Analytical method for Experiment 1 ... 45
3.2.1.4 Analytical method for Experiment 2 ... 45
3.3 Results and Discussion ... 46
3.3.1 Experiment 1: Search for matrix components in agricultural products ... 46
3.3.2 Experiment 2: Experiment 2: Evaluation of the components which cause the matrix enhancement effect ... 49
Chapter 4 Matrix Behavior during Sample Preparation Using Metabolomics Analysis Approach for Pesticide Residue Analysis by GC-MS in Foods ... 65
4.1 Introduction ... 65
4.2 Experimental ... 68
4.2.1 Reagents and Chemicals ... 68
4.2.2 Sample Preparation for Experiment 1 ... 70
4.2.3 Sample Preparation for Experiment 2 ... 71
4.2.4 Derivatization ... 72
4.2.5 GC-MS Conditions ... 73
4.2.6 Identification ... 73
4.3 Results and Discussion ... 74
4.3.1 Experiment 1: Difference between two extractive solvents, acetone and acetonitrile ... 74
4.3.2 Experiment 2: Cleanup efficiency by Solid Phase Extraction (SPE) ... 86
4.3.3 Conclusions ... 92
Summary ... 94
References ... 96
List of Publications ... 105
Acknowledgements ... 107
List of Abbreviations
Chemicals
PEG 300 polyethylene glycol 300
MSTFA N-methyl-N-trimethylsilyltrifluoroacetamide TMCS trimethylchlorosilane
FAME fatty acid methyl ester
Methods and Instruments
GC gas chromatograph (instrument) gas chromatography (analysis)
GC-MS gas chromatograph-mass spectrometer (instrument) gas chromatography-mass spectrometry (analysis)
GC-MS/MS gas chromatograph-tandem mass spectrometer (instrument) gas chromatography-tandem mass spectrometry (analysis)
LC-MS liquid chromatograph-mass spectrometer (instrument) liquid chromatography-mass spectrometry (analysis)
LC-MS/MS liquid chromatograph-tandem mass spectrometer (instrument) liquid chromatography-tandem mass spectrometry (analysis) QuEChERS Quick Easy Cheap Effective Rugged Safe
SPE Solid Phase Extraction GPC gel permeation chromatography
C18 octadecyl
NH2 aminopropylsilanized silica gel
PSA ethylenediamine-N-propylsilanized silica gel
GCB graphite carbon black
Others
m/z mass to charge ratio
MRL Maximum Residue Levels LOD limit of detection
LOQ limit of qualification
Log Po/w n-octanol/water partition coefficient
AMDIS Automated Mass spectral Deconvolution and Identification System NIST National Institute of Standards and Technology
RI Retention Index
RT Retention Time
RTL Retention Time Locking PLS Positive List System
MHLW Ministry of Health, Labour and Welfare FDA U.S. Food and Drug Administration
CFDA California Department of Food and Agriculture
General Introduction
Due to the high sensitivity of a gas chromatograph-mass spectrometer (GC-MS), the trace level analysis of pesticides using GC-MS has become common in the environmental and food safety fields. Because the interests in environmental risk and food safety are growing, the requirements of the number of measured compounds and their detection limits have become very strict. Recently, a gas chromatograph-tandem mass spectrometer (GC-MS/MS) has been widely used as a more selective instrument to meet these strict requirements. The multi-residue analysis of pesticides with wide physicochemical properties has also been common along with the popularization of GC-MS. The molecular weight and Log Po/w value of the pesticides, which are measured by GC-MS, are in the range of 90-541 and -1.2-9.6, respectively.
The water supply regulation by the Ministry of Health, Labour and Welfare (MHLW) was amended in 2004,1) the measured pesticides increased from 13 to 102 (Fig.
1), and five metabolites of fenthion were added in 2006. The Positive List System for food safety by the MHLW was in force in 2006,2) and the number of measured pesticides has been dramatically increasing (Fig. 2). Before 2005, 250 pesticides were regulated based on the Maximum Residue Levels (MRLs) under the Food Sanitation Law. Under the Positive List System (PLS), the measured pesticides are almost all that are used around the world (around 800 pesticides). The uniform limit (0.01 ppm) has been established for pesticides without MRLs. Approximately 65-70% of the pesticides are measured by GC-MS for both the drinking water regulation and the Positive List System for foods.
It is often said that GC-MS is a matured instrument. However, there are still some problems which influence the quantitative values for trace level analysis of pesticides.
Fig. 2 Increase the number of pesticides set with MRMs in foods, and the ratio of GC-MS and LC-MS.
One of the most serious problems is the matrix enhancement effect such that the intensity of the pesticides in the matrix solution is higher than that in the matrix-free solution.3)-13) The matrix enhancement effect is suspected to occur at all the places that are in contact with the pesticides solution; such as the glass vial, injection port, column and ion source. (Fig. 3) The other problem is the change in the mass spectra of specific pesticides, i.e., sulfoxides. Sulfides and sulfoxides have been analyzed by oxidization to sulfone by potassium permanganate treatment14) because both are easy to be oxidized.
However, since the toxicities of sulfide, sulfoxide and sulfone are different, separate measurements are currently required.
Therefore, the purpose of this thesis is to reveal the cause of these problems and to find a good solution to improve them, from both the aspect of hardware and sample preparation.
In Chapter 1, the change in the mass spectra of fenthion sulfoxides and fensulfothion is described. Two metabolites of fenthion, fenthion sulfoxide and fenthion oxon sulfoxide, are regulated by the drinking water law. Fensulfothion, another pesticide, also has the sulfoxide structure. These sulfoxides have different base peaks depending on their concentrations. The change in the mass spectra is a serious problem for quantitative analysis, and the author determined their mechanism and the solution.
Chapters 2 and 3 describe the matrix enhancement effect problem. A gold-plated ion source was made and the aspect of the hardware was evaluated. We can commercially select a more inert injection liner and column, however, there is no choice about the ion
to solve the matrix enhancement effect.
Chapter 1
Deoxidation of Fenthion Sulfoxide, Fenthion Oxon Sulfoxide and Fensulfothion in Gas Chromatograph/Mass Spectrometer, and the Prevention of Sulfoxide
Deoxidation by Polyethylene Glycol 300
1.1 Introduction
Fenthion is one of the organophosphourus pesticides, and is widely used as an effective insecticide for rice, fruits, etc. On the other hand, fenthion raises serious concern because of its strong toxicity to wild birds.15) Fenthion is photooxidized to fenthion sulfoxide in the environment,16) and fenthion sulfoxide shows higher toxicity than fenthion.17)
In Japan, five derivatives of fenthion (fenthion sulfoxide, fenthion sulfone, fenthion oxon, fenthion oxon sulfoxide and fenthion oxon sulfone) are controlled by the water supply law.1) We had several chances to determine fenthion and its five derivatives, and noted that two sulfoxides sometimes showed mass spectra different from those in the NIST Mass Library (National Institute of Standards and Technology, USA), that is, each base peak shifted to a lower level by 1 m/z. We also found that fensulfothion, which is not a fenthion derivative, but has a sulfoxide structure, also acted in the same manner. We extensively examined the data on those compounds to find similar analytical situations.
The base peak of fenthion sulfoxide, fenthion oxon sulfoxide and fensulfothion in the NIST library, are m/z 279, 263 and 293, respectively. In contrast, in the acquired mass spectra, the base peak of fenthion sulfoxide, fenthion oxon sulfoxide and fensulfothion were m/z 278, 262 and 292, respectively. The base peaks shown in the NIST library are derivered from demethylation, which is very popular for EI fragmentation. On the
contrary, the 1 m/z lower base peaks are slightly unique because the difference based on molecular weight (mono-isotopic) is an even number for all sulfoxides. In this report, we identify the base peak equal to that of the NIST library as the "usual base peak", and call the 1 m/z lower base peak the "shifted base peak". Properly choosing the quantification ion is essential for precise GC-MS quantitative analyses; thus, it is very important to comprehend the cause of producing the shifted base peak result.
GC-MS analyses of sulfoxides were difficult for the following reasons: 1) Sulfoxide is easily produced from sulfide by oxidation, and tends to change into sulfone by additional oxidation. 2) Sulfoxide has a higher polarity than sulfide or sulfone because of its strong polarization between sulfur and oxygen. Fedrak et al.18) reported that methylbenzothiophene sulfoxides were decomposed in a GC injection port. Tanaka et al.19) reported that disulfoton sulfoxide was degraded at a GC injection port, and that a programmed temperature vaporization (PTV) inlet in the pulsed splitless mode reduced the degradation. Ueno et al.20) reported that oxydemeton-methyl (sulfoxide of demeton-S-methyl) also decomposed at a GC injection port, and that demeton-S-methyl was easily oxidized to oxydemeton-methyl in the sample preparation. They thus added both L-ascorbic acid and butylhydroxytoluene as an antioxidant. Mastovska et al.21) also reported on the thermodegradation of some sulfoxides. They said that the analyses of sulfoxides were difficult because of their unstable behavior in GC analyses.
Here, the problem with the concerned sulfoxides is derived from deoxdation in an EI ion source, was found. With a decrease in the concentration, the ratio of the “shifted
residue analysis by GC or GC-MS.3)-13) This phenomenon means that the response of a pesticide in the matrix solution is higher than that in the matrix-free standard solution.
It was reported that the matrix protected the analytes from adsorption or alternation during transfer from the injector to the column.3)-5), 8),10) In order to compensate for the matrix-induced enhancement effect, the priming injection technique by real samples,22) the standard addition technique, the matrix matching technique, or using a pseudo matrix, such as polyethylene glycol 300 (PEG 300),23) or analyte protectants,24)-26) are often used.
In the present work, the effect of PEG 300 on the GC-MS behavior of the sulfoxides was examined, and that PEG 300 prevented deoxidation in an EI ion source and a dirty injection port was found.
1.2 Experimental
1.2.1 Reagents and chemicals
The standards for pesticides with a purity of 98% or higher, except for fenthion sulfoxide (94.7%), were obtained from Hayashi Pure Chemical Ind., Ltd. (Osaka, Japan).
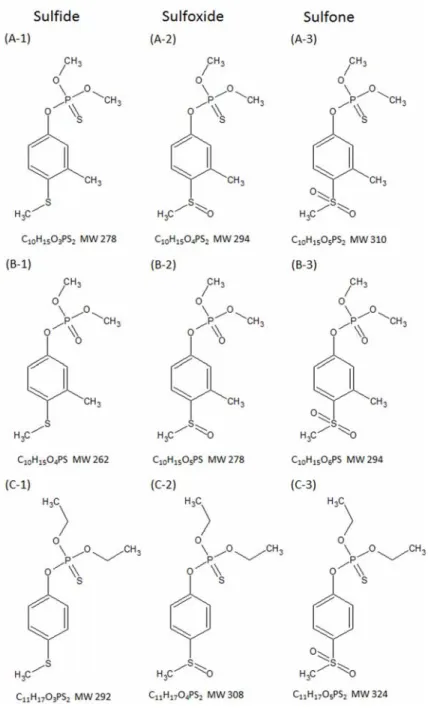
The chemical structures of sulfide, sulfoxide and sulfone are shown in Fig.1.1. Acetone, dichloromethane, n-hexane and ethyl acetate were high-purity solvents for pesticide and PCB analysis, obtained from Kanto Chemical Co., Inc. (Tokyo, Japan). Methanol, HPLC grade, and polyethylene glycol 300 (PEG 300), special grade, were obtained from Kanto Chemical Co., Inc. (Tokyo, Japan). Bottled water was “Natural water of Minami-alps” from Suntory Holdings., Ltd. (Osaka, Japan).
Fig. 1.1 Chemical structures of sulfide, sulfoxide and sulfone.
1.2.2 Apparatus
GC-MS measurements were performed on an Agilent 7890A GC system coupled to a 5975C TAD mass spectrometer (Little Falls, DE, USA). GC-MS/MS analyses were performed on an Agilent 7890A GC system coupled to a 7000B triple quadrupole mass spectrometer (Santa Clara, CA, USA). Both systems were equipped with a 7693 autoinjector (Little Falls, DE, USA). The inlet temperature was 250C, the total flow was set at 50 mL/min, and a split valve was opened 1.0 min after pulsed splitless injection (25 psi). The injection volume was 2 µL. A fused silica capillary column, HP-5msUI (30 m x 0.25 mm i.d. x 0.25 µm film thickness, Agilent, Folsom, CA, USA) was used. At the beginning of injection, the oven temperature was set at 60C for 1.0 min, ramped to 310C at 20C/min and then held for 3.0 min. The helium carrier gas flow rate was constant at 1.0 mL/min, and the transfer line temperature was set at 280C.
GC-MS was operated in a scan or SIM mode (SIM was for ppb level analyses), and GC-MS/MS was operated in the product ion scan mode. The source temperature was 230C in both systems. As for the GC-MS/MS, nitrogen gas was used as the collision gas.
All data from Chemstation were converted to MassHunter software.
1.3 Results and Discussion 1.3.1 Concentration and solvent
The mass spectrum of each sulfoxide standard solution at 10 ppm in acetone was almost the same as that in the NIST library. The base peaks for fenthion sulfoxide, fenthion oxon sulfoxide, and fensulfothion were m/z 279, 263 and 293, respectively.
However, the base peaks of sulfoxide at 1 ppm were shifted to a lower level by 1 m/z.
The “shifted base peaks” of fenthion sulfoxide, fenthion oxon sulfoxide and
fensulfothion were m/z 278, 262 and 292, respectively (Fig. 1.2). The concordance of the retention time at both concentrations showed that the change in these spectra occurred neither in the GC injection port nor in the column. Furthermore, we tested various solvents, such as acetone, dichloromethane, n-hexane and ethyl acetate which are common in pesticide analyses, but there was no significant difference. This means that the changes in the spectra were occurred in an EI ion source. On the other hand, sulfones were stable, and no base peaks shift was observed.
1.3.2 Ion source temperature
Considering that the spectral change occurred in the ion source, as described above, we observed the spectra at various temperatures of the ion source. The results showed that the lower was the ion source temperature, the higher was the ratio of the “usual base peak”. Nevertheless, the spectra were different from those in the NIST library even at low temperature. In addition, the shape of the “shifted base peak” at 150C showed asymmetry, and the sensitivity was much lower than that at 230C. Based on these results, the spectra change was caused by the interaction between sulfoxides and the EI ion source. However, over a 200C ion source temperature is practical for environmental and food safety analyses in order to prevent any loss of sensitivity due to possible accumulated contamination from the sample matrix.
1.3.3 The cause of the “shifted base peak”
(A)
Fig. 1.2 (A) Spectra of fenthion sulfoxide.
Upper: 10 ppm, Lower: 1 ppm.
(B)
Fig. 1.2 (B) Spectra of fenthion oxon sulfoxide.
Upper: 10 ppm, Lower: 1 ppm.
(C)
Fig. 1.2 (C) Spectra of fensulfothion.
Upper: 10 ppm, Lower: 1 ppm.
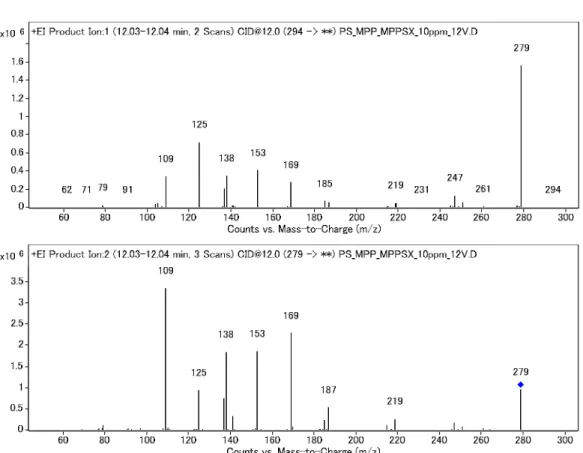
Fig. 1.3 Product ion scan spectra of fenthion sulfoxide.
Upper: precursor ion = molecular ion, m/z 294.
Lower, precursor ion = “usual base peak”, m/z 279.
other hand, it is thought that the “shifted base peak” ([M-16]+) was not formed by the common EI fragmentation. The result that the “shifted base peak” ([M-16]+) was detected neither from the product ion scan of the molecular ion nor from that of the
“usual base peak” ion supported, too. Although EI fragmentation and collision induced dissociation (CID) are different mechanisms, both are derive from the structure or functional group of the compounds. The example result of fenthion sulfoxide is shown in Fig. 1.3. After performing a product ion scan for the “shifted base peak”, the spectra were equal to the product ion scan of their sulfides. (Fig. 1.4). However, the product ion scan spectrum of fensulfothion could not be compared with that of fensulfothion sulfide, because fensulfothion sulfide could not be obtained. In consideration of these results and the similarity of the basic framework of sulfoxide and sulfide, it was concluded that the “shifted base peak” was formed from the sulfide, which was produced from the sulfoxide through deoxidation.
1.3.4 Addition of polyethylene glycol 300 (PEG 300)
Polyethylene glycol 300 (PEG 300), which has been commonly used to compensate for the matrix-induced enhancement effect, was used against this problem. The average molecular weight of PEG300 is 300 with a range of approximately 285 to 315, which covered the molecular weight and retention times of these three target sulfoxides. The added amount of PEG 300 was 250 ppm, and there was no memory of PEG 300 to the system (ion source, column and injection port) from its concentration and molecular weight. Since the ion source was temporarily coated, or PEG 300 was preferentially ionized, sulfoxides were avoided to direct contact with the metal surface. As a result, the formation of sulfide from sulfoxide was controlled and provided reproducible experimental data of mass spectra, even at low concentration (Fig. 1.5).
(A)
x104
0 1 2 3 4 5 6 7
Counts vs. Mass-to-Charge (m/z)
50 60 70 80 90 100 110 120 130 140 150 160 170 180 190 200 210 220 230 240 250 260 270 280 +EI Product Ion (11.78 min) [email protected] (278 -> **) PS_MPP-SXD_1ppm_278_c.D
109
278
169 125
151 245 263
137 184
79
x105
0 1 2 3 4 5 6 7
Counts vs. Mass-to-Charge (m/z)
50 60 70 80 90 100 110 120 130 140 150 160 170 180 190 200 210 220 230 240 250 260 270 280 +EI Product Ion (10.47 min) [email protected] (278 -> **) PS_MPP_1ppm_278_c.D
109
278
169
125 137 151 184 245 263
79
Fig. 1.4 (A) Product ion scan spectra of the “shifted base peaks” of sulfoxide and those of molecular ions of their sulfides.
Upper: fenthion sulfoxide (precursor ion = “shifted base peak” m/z 278) Lower: fenthion (precursor ion = molecular ion m/z 278).
(B)
x104
0 0.1 0.2 0.3 0.4 0.5 0.6 0.7 0.8 0.9 1
Counts vs. Mass-to-Charge (m/z)
50 60 70 80 90 100 110 120 130 140 150 160 170 180 190 200 210 220 230 240 250 260 270 280 +EI Product Ion (11.45 min) [email protected] (262 -> **) PS_MPP-OXSXD_1ppm_262_c.D
262
247 135
153 217
109 121 203
x105
0 0.2 0.4 0.6 0.8 1 1.2 1.4
Counts vs. Mass-to-Charge (m/z)
50 60 70 80 90 100 110 120 130 140 150 160 170 180 190 200 210 220 230 240 250 260 270 280 +EI Product Ion (10.14 min) [email protected] (262 -> **) PS_MPP-OX_1ppm_262_c.D
262
247
109 135
153 217
121 203
91
Fig. 1.4 (B) Product ion scan spectra of the “shifted base peaks” of sulfoxide and those of molecular ions of their sulfides.
Upper: fenthion oxon sulfoxide (precursor ion = “shifted base peak” m/z 262) Lower: fenthion oxon (precursor ion = molecular ion m/z 262).
(A)
x102
0 1 2 3 4 5 6 7 8
Counts vs. Mass-to-Charge (m/z)
110 120 130 140 150 160 170 180 190 200 210 220 230 240 250 260 270 280 290 300 + Scan (11.84 min) MPP-SXD_10PPB_P.D
279 125
109
294
x103
0 1 2 3 4 5 6 7 8
Counts vs. Mass-to-Charge (m/z)
110 120 130 140 150 160 170 180 190 200 210 220 230 240 250 260 270 280 290 300 + Scan (11.84 min) MPP-SXD_100PPB_P.D
279
125 109 294
Fig. 1.5 (A) SIM spectra of fenthion sulfoxide at low levels with PEG300.
Upper: 10 ppb, Lower: 100 ppb.
(B)
x102
0 0.2 0.4 0.6 0.8 1 1.2 1.4
Counts vs. Mass-to-Charge (m/z)
110 120 130 140 150 160 170 180 190 200 210 220 230 240 250 260 270 280 290 300 + Scan (11.51 min) PEG_MPP-OXSXD_10PPB.D
109 263
x103
0 0.2 0.4 0.6 0.8 1 1.2
Counts vs. Mass-to-Charge (m/z)
110 120 130 140 150 160 170 180 190 200 210 220 230 240 250 260 270 280 290 300 + Scan (11.51 min) PEG_MPP-OXSXD_100PPB.D
263
109
278
Fig. 1.5 (B) SIM spectra of fenthion oxon sulfoxide at low levels with PEG300.
Upper: 10 ppb, Lower: 100 ppb.
(C)
x103
0 0.2 0.4 0.6 0.8 1
Counts vs. Mass-to-Charge (m/z)
110 120 130 140 150 160 170 180 190 200 210 220 230 240 250 260 270 280 290 300 + Scan (11.82 min) PEG_FENSULFOTHION_10PPB.D
293
125 109 308
x104
0 0.2 0.4 0.6 0.8 1 1.2
Counts vs. Mass-to-Charge (m/z)
110 120 130 140 150 160 170 180 190 200 210 220 230 240 250 260 270 280 290 300 + Scan (11.82 min) PEG_FENSULFOTHION_100PPB.D
293
125 308
109
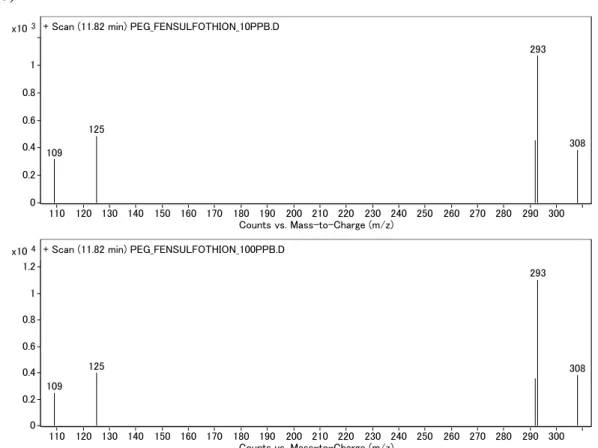
Fig. 1.5 (C) SIM spectra of fensulfothion at low levels with PEG300.
Upper: 10 ppb, Lower: 100 ppb.
1.3.5 Possibility of deoxidation at the injection port
The plural GC-MS and GC-MS/MS for this test was used, and that the deoxidation of sulfoxides normally occured at the ion source was found. However, it was found that deoxidation could occur at the GC injection port, especially when the metal part at the bottom of the injection port was dirty. This phenomenon was observed after one hundred injections of derivatizing reagents (methoxyamine hydrochloride in pyridine and N-methyl-N-trimethylsilyltrifluoroacetamide with 1% trimethylchlorosilane for another test) in the split injection mode. The liner and the column were renewed after the derivatized compound analysis, but the metal part which became rusty by the derivatization regant, was not exchanged. When deoxidation occurred at the injection port, two different peaks appeared. As for fenthion sulfoxide, one eluted at the fenthion sulfoxide retention time, and the other eluted at the fenthion retention time (Fig. 1.6).
Fenthion oxon sulfoxide also showed two different peaks: one was fenthion oxon sulfoxide and the other was the deoxidized compound, fention oxon. By adding PEG300, the sulfide peaks was not produced and only sulfoxide peaks were obtained.
This result indicates that PEG 300 prevented the deoxidation of sulfoxides at the injection port when using an extremely dirty metal part.
1.3.6 Additional effect
Since PEG300 has been used to compensate for the matrix-induced enhancement effect, we tested PEG 300 for other fenthion derivatives including fenthion. The target compounds were fenthion, fenthion oxon, fenthion sulfone, fenthion oxon sulfone, fenthion sulfoxide, fenthion oxon sulfoxide and fensulfothion. According to sample preparation reported by the Japanese Ministry of Health, Labour and Welfare,1) bottled water was extracted by a solid-phase extraction (SPE) column packed with polystyrene
(A)
x104
0 0.25 0.5 0.75 1 1.25 1.5 1.75 2 2.25 2.5
Counts vs. Acquisition Time (min)
5 6 7 8 9 10 11 12 13 14 15 16 17 18
+ TIC Scan MPP-SXD_1PPM_2ULSIM.D
fenthion sulfoxide deoxidation product
= fenthion
(B)
x105
0 0.5 1 1.5 2 2.5 3 3.5 4 4.5
Counts vs. Acquisition Time (min)
5 6 7 8 9 10 11 12 13 14 15 16 17 18
+ TIC Scan MPP-SXD_1PPMP_2ULSIM.D
fenthion sulfoxide
Fig. 1.6 Chromatogram of fenthion sulfoxide using an extremely dirty metal part at the bottom of the GC injection port.
(A) without PEG 300, (B) with PEG 300.
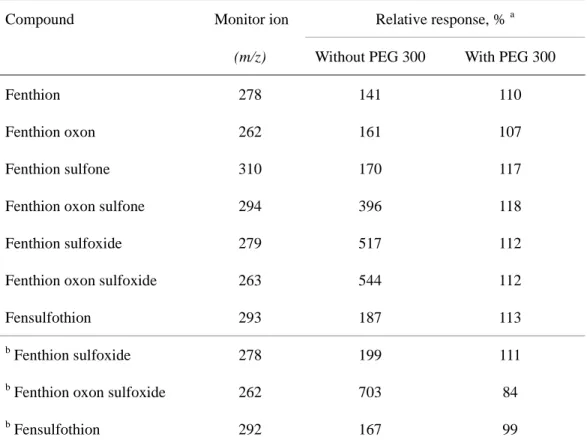
divinylbenzene (PS-DVB, 500 mg). The PS-DVB column was conditioned with dichloromethane, methanol and water in succession. Five hundred milliliters of water was loaded onto the PS-DVB column and eluted with 3 ml of dichloromethane. The eluted solution was concentrated with a stream of nitrogen gas, and the volume was adjusted to 1 ml. Fenthion and related compounds were fortified at 100 ppb level into the test solution. As a result, the matrix-induced enhancement effect values of these 7 pesticides in the eluted solution were between 141 and 703% without PEG 300, while, those were between 107-118% with PEG 300 (Table 1.1). PEG 300 not only prevented the sulfoxides deoxidation and provided reproducible experimental data of mass spectra, but also compensated for the matrix-induced enhancement effect.
1.3.7 Conclusions
Fenthion sulfoxide, fenthion oxon sulfoxide and fensulfothion were deoxidated at the EI ion source in the GC-MS system. The degrees of deoxidation were different depending on their concentrations, and had an influence on quantitative analysis at the ppb level. Adding PEG 300 prevented sulfoxide deoxidation was found. Also the deoxidated peaks at their sulfides retention time was observed when sulfoxides were injected into the injection port, which the metal part at the bottom of the injector port was extremely dirty. The addition of PEG300 was also effective in this case. Moreover, PEG 300 compensated for the matrix-induced enhancement effect for other fenthion derivatives, such as fenthion oxon, and fenthion sulfone.
Fig. 1.7 is a view showing a frame format of PEG 300 protecting sulfoxides interaction to the ion source.
Table 1.1 Matrix-induced enhancement effect value of each pesticide with and without PEG 300.
Compound Monitor ion Relative response, % a (m/z) Without PEG 300 With PEG 300
Fenthion 278 141 110
Fenthion oxon 262 161 107
Fenthion sulfone 310 170 117
Fenthion oxon sulfone 294 396 118
Fenthion sulfoxide 279 517 112
Fenthion oxon sulfoxide 263 544 112
Fensulfothion 293 187 113
b Fenthion sulfoxide 278 199 111
b Fenthion oxon sulfoxide 262 703 84
b Fensulfothion 292 167 99
a. Relative response of the analyte in the sample solution to that of the matrix-free standard solution.
b. Deoxidated ion ( = “shifted base peak”).
Fig. 1.7 Protection sulfoxides interaction to the ion source by PEG 300.
Chapter 2
Decrease in the Matrix Enhancement Effect of GC-MS by a Gold-Plated Ion Source
2.1 Introduction
GC-MS has been commonly used for pesticide multi-residue analyses since 2005. In Japan, the PLS has been in force since 2006,28) and GC-MS has been used instead of 3 types of GC detectors (FPD, ECD, and NPD).2) However, the matrix effect of pesticides analyzed in foods by GC/MS, a phenomenon in which the response of a pesticide is higher in the food matrix than that in the standard solution, has been often observed.3)-13) In order to calculate the exact quantity value, the priming injection technique by samples,22) the standard addition technique, the matrix matching technique, a pseudo matrix, such as PEG 300,23) and analyte protectants24)-26) are often used. However, matrix-free organic solvents are commonly used in pesticide analyses because of the abundance of samples.
The matrix effect on GC-MS has been suspected to occur at the injection port, the column, and the ion source, where matrix components pass through. The injection port was the most likely place3),7) for the matrix effect to occur when GC detectors were widely used. In GC-MS, it is difficult to find the place where the matrix effect occurs, because the injection port, the column, and the ion source are connected to the vacuum system. It is also known that the presence of an inert surface in the system, sample clean-up, and the concentration rate of the samples influence the matrix effect.7)
(Agilent), and Silicosteel (GL Science, Saitama, Japan). The gold plating technique was chosen because gold is the most inactive metal. D’Autry et al. demonstrated the stability of volatile compounds, such as methanol and ethanol, using headspace GC/MS with a gold-coated ion source.28) The most inert liner and column were chosen and the matrix effect was evaluated by the difference in the ion source.
2.2 Experimental
2.2.1 Reagents and chemicals
The pesticide mixture standards, PL-2-1 and PL-3-1 (listed in Table 2.1) were obtained from Wako Pure Chemical Industries, Ltd. (Osaka, Japan). The pesticides mixtures are listed in Table 1. Acetone and n-hexane, high-purity solvents for the pesticide and PCB analyses, were obtained from Kanto Chemical Co., Inc. (Tokyo, Japan).
2.2.2 Analytical method
The Siltek deactivated injection liner (Restek, Bellefonte, PA, USA) and factorFOUR VF-5ms (Agilent, Middleburg, Netherlands) were chosen to establish the most inert system available. An Agilent 7890A gas chromatograph with a 5975C TAD mass spectrometer with a solid inert ion source and a 7693A autoinjector (Little Falls, DE, USA) was used. The operating conditions were as follows: injection liner, Siltek deactivated injection liner; column, factorFOUR VF-5ms, 30 m × 0.25 mm id, 0.25 µm thickness; oven temperature program, 70C (1 min hold) to 125C at 25C/min and to 300C at 10C/min (10 min hold); injection temperature, 250C; injection mode, pulsed splitless (30 psi, 1 min, 2 µL injection); carrier gas, He 1.0 ml/min constant flow;
transfer line, 280C; ion source temperature, 300C.
2.2.3 Gold-plated ion source
A metalwork company in Japan was hired to gold-plate an existing ion source (a solid inert ion source). These ion source parts were electroplated. The gold material contained 99.7% Au and 0.3% Co, and Ni was used as the adhesive. Not only the ion source body but also the draw-out plate lens and the interface socket were coated with gold. The ion source body and the draw-out plate lens create an ionization place where an interaction could occur. The entrance lens, ion focus lens, and repeller were not coated this time because there was a possibility that the electric field might change. The plated thickness was 1.2-1.4 µm (Fig. 2.1).
2.1.4 Sample and sample preparation
Potato, spinach, orange, brown rice, and soybean were chosen as representative samples. They were prepared using a method that conformed to the “Multiresidue Method for Agricultural Chemicals by GC-MS (Agricultural Products)” for the PLS by the MHLW.2)
For fruits and vegetables, 20 g samples were weighted. For brown rice and soybean, 10 g samples were weighted and added to 20 mL of water, and then the mixture was stored for 15 min. After shaking with 50 mL of acetonitrile for 30 min, the samples were filtered. Acetonitrile was added to the samples to make 100 mL, and then 20 mL of the sample solution was measured (for brown rice and soybean: 40 mL). After 10 g of sodium chloride and 20 mL (brown rice and soybean: 40 mL) of a 0.5 M phosphate
Fig. 2.1 Gold-plated ion source. Upper: picture of the ion source body with the interface socket and draw-out lens; lower: cross-section diagram.
with 20 mL of acetonitrile/toluene (3:1). The eluate was evaporated to dryness and the residue was dissolved in acetone/n-hexane (1:1) to make a 5 mL solution.
As for the samples of brown rice and soybean, an octadecylsilanized silica gel column (C18, 1 g, 6 mL) (Agilent, Lake Forest, CA, USA) was treated before the GCB/NH2 column clean-up. The C18 column was conditioned with 10 mL of acetonitrile. The sample solution was applied to the column and eluted with 2 mL of acetonitrile.
The GC-MS measurement was performed in the following order:
pesticide standard fortified sample (n = 3, consecutively) solvent
First, the pesticide standard mixture was analyzed. Then, the sample solution was analyzed three times consecutively. Before moving to the next sample, the solvent (acetone:n-hexane, 1:1, v/v) was injected 3 times to avoid the influence of the previous sample. After checking the intensity, stability, and peak shape of the next standard, the next sample solution was analyzed. The sample order was potato, spinach, orange, brown rice and soybean. First, the matrix effect was measured using the original ion source (the new ion source). Then, the ion source was changed to the gold-plated ion source. The injection liner was also changed to a new one, and the tip of the column was cut by about 30 cm. The matrix effect value of the pesticide in the sample solutions was analyzed in the SIM mode, and the relative response of the pesticide in the sample
120%) in almost all samples using the original ion source (Table 2.1). The mean matrix effect value of the pesticides in the samples of potato, spinach, orange, brown rice and soybean was 132%, 202%, 181%, 240%, and 151%, respectively. The compounds which showed a high matrix effect had hydroxyl (-OH; e.g., bromopropylate and bitertanol) or amino groups (R-NH-; e.g., simazine and propyzamide), azoles (-N=; e.g., bitertanol, fipronil, difenoconazole, and triadimenol) and organophosphorus (OPs) (P=O, P=S; e.g., profenofos, phosmet, and pyraclofos). This result agreed with the reports by Brunete et al.29) and Poole.12) Moreover, low-polar compounds, such as pyrethroids (e.g., cypermethrin and fenvarelate), showed a high matrix effect value. The retention time of any organic compounds by a non-polar or low-polar column is sorted by the boiling point and polarity;29) thus, the compounds which had higher RTs tended to show a high matrix effect (Table 2.1). Brunete et al. demonstrated that the addition of not only analyte protectants for the polar compounds but also corn oil and olive oil for the low-polar compounds compensated for the matrix effect.29)
The GC-MS analysis has an advantage in multi-residue analysis over GC using 3 types of detectors. However, many pesticides cannot be separated by a GC capillary column and are often interfered with by the matrix components because simple clean-up is used for multi-residue analyses. Recently, GC-MS/MS has become more common for multi-residue analyses because of its selectivity. However, the problem of the matrix effect still remains. Therefore, we created a gold-plated ion source to form a more inert GC-MS.
The efficiency of the gold-plated ion source was evaluated for 80 pesticide standards.
The abundance of pesticides at 50 ppb was 1.3-2.5 times higher than that of the original ion source. Since the matrix effect is remarkable at low concentration, the calibration curve shows a quadric curve. The calibration curves of fenitrothion (5-100ppb, 5points)
Table 2.1 Matrix effect value of each pesticide with original ion source.
Monitor Relative response, % a) Compound RT ion, Potato Spinach Orange Brownrice Soybean
m/z Mean SD Mean SD Mean SD Mean SD Mean SD Propoxur 9.61 152 114 10 162 19 153 19 169 32 129 21 Ethoprophos 9.94 158 118 9.4 150 13 146 14 146 20 123 16 Carbofuran 11.05 164 132 12 194 28 187 21 202 43 139 26 Simazine 11.10 201 117 7.3 134 6.8 143 6.5 131 9.5 119 11 Quintozene 11.35 237 106 3.6 132 15 132 16 144 27 111 16 r-BHC 11.45 219 106 5.6 120 5.2 121 6.3 121 7.7 108 8.9 Propyzamide 11.52 173 117 6.6 141 8.2 137 6.4 132 11 117 11 Diazinon 11.54 304 114 4.0 137 8.1 135 8.7 134 14 116 11 Tri-allate 11.96 268 112 5.2 126 4.9 132 5.3 125 7.2 112 10 Propanil 12.47 161 117 9.2 142 8.2 147 10 108 11 121 14 Vinclozoline 12.61 285 114 5.2 132 2.7 127 4.4 124 5.8 111 9.4 Alachlor 12.69 160 111 6.3 131 12 134 11 140 17 113 13 Parathion-methyl 12.69 263 111 8.2 154 25 144 19 176 38 121 21 Pirimifos-methyl 13.08 290 117 8.2 143 9.1 139 8.9 142 14 119 13 Fenitrothion 13.17 277 113 8.0 156 24 150 19 182 38 123 21 Metolachlor 13.44 162 115 6.6 139 8.0 131 8.6 152 10 116 12 Chlorpyriphos 13.47 314 111 7.9 141 11 139 10 151 10 117 14 Fenthion 13.56 278 117 7.1 135 6.5 135 6.3 137 5.9 117 10 Isophenphos oxon 13.60 229 150 18 244 36 264 38 351 69 241 50 Parathion 13.62 291 115 6.9 151 23 154 20 221 35 123 21 Triadimefon 13.69 208 113 7.6 136 8.5 136 8.7 152 8.5 117 13 Fipronil 14.14 367 117 12 154 17 152 17 238 40 128 22 Allethrin-1,2 14.25 123 147 16 161 14 141 14 287 53 128 17 Isophenphos 14.25 213 124 8.0 152 16 152 14 178 17 124 17 Chlorfenvinphos-Z 14.30 267 124 10 157 17 155 14 186 20 128 19 Allethrin-3,4 14.32 123 131 9.2 155 11 154 19 252 31 133 17 Triadimenol-1 14.50 112 134 11 -b) 24 169 15 250 19 -b) 30
Profenofos 15.34 337 120 9.5 172 19 166 18 270 10 137 23 Oxyfluorfen 15.48 252 116 6.7 164 20 160 19 308 27 132 22 Myclobutanil 15.50 179 122 5.2 126 2.8 145 7.5 154 11 119 13 Buprofezin 15.54 172 118 7.6 139 5.3 132 6.5 141 1.3 115 10 Cyproconazole 15.87 222 134 11 171 10 127 17 201 5.0 133 18 Chlorbenzilate 16.04 139 119 8.5 152 7.6 150 7.8 177 2.4 133 14 Ethion 16.18 231 147 11 203 21 184 18 239 9.1 144 20 Triazophos 16.48 257 148 12 201 24 184 20 255 14 141 25 Propiconazole-1 16.78 259 137 9.1 174 3.4 158 10 193 2.8 139 15 Quinoxyfen 16.84 237 117 6.6 150 3.9 143 5.4 149 0.9 126 10 Propiconazole-2 16.89 259 128 10 170 4.1 151 10 179 6.0 138 14 Hexazinone 17.04 171 134 8.5 190 3.1 178 8.7 188 3.1 151 16 Propargite 17.16 173 126 8.6 192 23 175 24 320 38 149 28 Tebuconazole 17.20 250 143 10 199 7.3 175 15 213 7.1 144 17 Acetamiprid 17.71 166 279 26 806 60 664 104 973 57 389 66 Phosmet 17.82 160 130 7.9 205 21 190 28 337 34 151 28 Bromopropylate 17.86 341 144 10 218 17 205 21 270 10 175 24 Fenpropathrin 17.94 181 134 9.0 202 14 171 16 222 9.1 140 20 Methoxychlor 17.95 227 130 8.4 189 14 170 18 252 13 145 21 Cyhalothrin-λ 18.51 181 143 10 209 18 189 22 292 23 152 25 Pyriproxyfen 18.58 136 134 7.8 166 4.0 182 8.8 163 1.8 125 12 Cyhalothrin-γ 18.69 181 141 6.3 201 15 179 21 275 24 157 25 Pyraclofos 19.23 360 153 13 318 30 268 36 420 28 221 38 Bitertanol-1 19.50 170 166 13 367 14 291 31 352 8.1 231 29 Bitertanol-2 19.61 170 163 12 429 20 313 37 425 12 270 34 Pyridaben 19.73 147 136 7.8 253 12 217 24 319 10 176 25 Fenbuconazole 19.74 340 124 7.2 182 4.1 166 13 188 2.8 136 14 Fluquinconazole 20.11 198 150 10 235 3.8 203 15 237 5.2 162 17 Cypermethrin 20.38-20.58 163 139 12 486 34 219 28 353 22 191 30 Fluridone 20.98 328 187 10 342 8.8 300 36 331 9.0 274 23 Fenvalerate-1 21.31 225 131 9.0 259 22 202 28 319 31 210 25 Fenvalerate-2 21.54 225 145 9.3 244 15 195 28 326 32 192 25 Difenoconazole-1 21.89 323 185 16 439 23 348 46 575 23 348 41 Difenoconazole-2 21.96 323 151 12 330 13 267 31 385 15 240 24 Deltamethrin 22.21 253 128 6.2 188 14 152 17 264 67 110 21
Mean 132 202 181 240 151
a) Relative response of the pesticide in each sample solution to that of the standard solution, b) Matrix interfered.
using the gold-plated ion source were improved (Fig. 2.2). This is because the interaction of the pesticides and the ion source decreased.
The mean matrix effect value of the pesticides in the samples of potato, spinach, orange, brown rice, and soybean decreased by 2.5, 14, 20, 38, and 15%, respectively, using the gold-plated ion source (Table 2.2). The rate of decrease was significant in the sample of brown rice. The sample of brown rice contained many more matrices than those of other agricultural products,31) and, when the gold-plated ion source was used, the interaction between the matrices and the ion source was reduced. The result of some representative pesticides showed in Fig. 2.3.On the other hand, since the sample of potato had few matrices, its matrix effect was small, and, therefore, the rate of decrease in the matrix effect was also small. From these results, the amount of matrices influenced the matrix effect. The pesticides whose matrix effects decreased by using the gold-plated ion source also had hydroxyl or amino groups, azols, OPs, and pyrethroids.
This might be because both the interaction between the matrices and the ion source and the adsorption or decomposition of pesticides was reduced by the gold-plated ion source. Fig. 2.4 is a view showing a frame format of interaction difference between pesticide/matrix and ion source. Meanwhile, the matrix effect value did not decrease in the pesticides having a heterocyclic amine structure, such as triadimefon, triazophos, hexadinone, acetamiprid, phosmet, pyraclofos, and fluquinconazole. These pesticides might be influenced by the injection port or the column rather than by the ion source. As for deltamethrin, isomerization at the injection port occurred.21)
gold-plated ion source, the gold-plated ion source effectively reduced the matrix effect.
Fig. 2.2 Calibration curves of fenitrothion.
*Relative response (%) = Relative response of pesticide in brown rice solution to that of the matrix‐free standard solution
Fig. 2.3 Comparison of matrix enhancement effect using original ion source and gold-plated ion source.
Fig. 2.4 Interaction difference between pesticide/matrix and ion source.
Table 2.2 Matrix effect value of each pesticide with gold-plated ion source.
Monitor Relative response, % a)
Compound RT ion, Potato Spinach Orange Brown rice Soybean m/z Mean SD Mean SD Mean SD Mean SD Mean SD
Propoxur 9.61 152 115 3.3 134 11 124 7.9 122 7.9 113 8.1 Ethoprophos 9.94 158 116 3.8 132 10 124 6.1 121 15 110 7.6 Carbofuran 11.05 164 137 5.0 161 13 145 7.8 131 16 123 8.9 Simazine 11.10 201 117 3.3 122 5.0 128 2.8 98.6 4.4 108 4.7 Quintozene 11.35 237 108 3.8 123 11 118 7.7 118 14.6 104 6.9 r-BHC 11.45 219 104 0.9 107 3.1 109 1.9 101 3.9 100 2.2 Propyzamide 11.52 173 114 2.6 122 4.9 121 4.0 105 5.1 111 6.8 Diazinon 11.54 304 115 3.1 121 5.2 119 5.0 104 5.2 108 4.3 Tri-allate 11.96 268 110 1.9 108 4.2 118 2.0 106 6.5 105 4.6 Propanil 12.47 161 120 5.3 131 6.7 132 5.1 114 9.1 110 9.5 Vinclozoline 12.61 285 111 2.1 116 5.2 116 2.2 97 0.7 105 5.2 Alachlor 12.69 160 110 2.6 120 5.8 119 5.0 104 4.5 105 6.4 Parathion-methyl 12.69 263 113 5.0 137 17 122 13 135 24 113 14 Pirimifos-methyl 13.08 290 117 4.0 124 6.1 122 4.8 103 5.4 109 6.7 Fenitrothion 13.17 277 117 5.7 141 17 127 12 139 20 115 13 Metolachlor 13.44 162 114 3.3 122 5.7 119 3.9 116 4.2 108 6.7 Chlorpyriphos 13.47 314 113 5.0 116 5.9 121 4.7 104 4.3 104 7.4 Fenthion 13.56 278 116 4.1 119 4.9 122 4.1 105 3.7 107 6.5 Isophenphos oxon 13.60 229 140 9.5 178 19 173 17 169 20 154 22 Parathion 13.62 291 114 2.8 139 14 132 14 171 20 117 15 Triadimefon 13.69 208 115 2.1 120 5.4 122 5.2 108 6.0 107 81 Fipronil 14.14 367 130 7.8 151 12 137 9.3 153 13 122 14 Allethrin-1,2 14.25 123 132 6.2 105 5.3 120 5.5 211 35 129 14 Isophenphos 14.25 213 119 4.9 127 7.1 126 6.0 113 7.0 108 8.5 Chlorfenvinphos-Z 14.30 267 123 6.0 132 7.6 131 6.0 124 8.9 114 9.9 Allethrin-3,4 14.32 123 125 5.1 132 6.6 133 6.3 153 13 118 11 Triadimenol-1 14.50 112 133 7.2 -c) 16 140 6.7 165 12 -b) 17 Triadimenol-2 14.65 112 132 6.5 -c) 13 138 6.8 137 11 120 11 Tetrachlorvinphos 14.83 329 124 7.4 148 9.4 134 6.9 139 9.3 121 12 Endosulfan-α 15.09 241 106 1.4 106 4.5 114 2.0 -b) -b) 102 3.6 Flutolanil 15.14 173 125 8.3 157 9.0 140 5.3 141 9.5 199 17 Isoprothiolane 15.28 118 118 4.6 127 7.5 133 2.3 118 5.8 119 8.2
Profenofos 15.34 337 126 9.5 152 9.9 140 8.5 145 13 121 11 Oxyfluorfen 15.48 252 110 5.9 148 14 143 14 209 17 133 18 Myclobutanil 15.50 179 119 5.3 125 15 130 4.7 110 18 110 9.4 Buprofezin 15.54 172 114 3.2 118 7.8 120 2.8 107 5.4 106 6.9 Cyproconazole 15.87 222 137 7.0 153 12 99 75 139 10 123 11 Chlorbenzilate 16.04 139 117 5.0 125 6.9 126 3.9 116 7.6 112 7.4 Ethion 16.18 231 140 8.4 174 13 153 7.9 151 12 127 12 Triazophos 16.48 257 139 13 187 19 151 10 154 16 119 13 Propiconazole-1 16.78 259 135 5.9 153 9.1 142 5.6 138 11 123 11 Quinoxyfen 16.84 237 118 5.2 128 9.0 131 2.0 112 8.6 116 6.9 Propiconazole-2 16.89 259 131 6.2 157 9.8 135 3.8 128 8.6 125 9.0 Hexazinone 17.04 171 132 5.9 152 9.3 148 3.3 135 9.1 134 9.5 Propargite 17.16 173 115 8.1 164 15 150 14 197 28 136 18 Tebuconazole 17.20 250 138 11 175 10 150 6.9 143 14 126 12 Acetamiprid 17.71 166 234 43 349 18 308 14 365 44 324 20 Phosmet 17.82 160 139 11 204 14 160 10 176 19 136 14 Bromopropylate 17.86 341 150 9.8 167 11 145 4.9 132 11 124 9.2 Fenpropathrin 17.94 181 133 7.7 156 10 136 3.5 122 9.7 115 9.1 Methoxychlor 17.95 227 125 7.9 170 11 142 8.8 140 14 117 9.6 Cyhalothrin-λ 18.51 181 154 10 191 12 148 7.0 155 15 129 11 Pyriproxyfen 18.58 136 132 6.8 142 10 161 3.8 126 12 120 8.9 Cyhalothrin-γ 18.69 181 143 9.1 185 11 151 6.4 157 15 131 12 Pyraclofos 19.23 360 159 18 294 19 206 13 232 25 178 17 Bitertanol-1 19.50 170 152 15 301 17 202 7.2 195 18 169 15 Bitertanol-2 19.61 170 145 14 311 18 206 8.9 208 21 179 16 Pyridaben 19.73 147 135 9.0 194 12 151 6.2 163 15 137 12 Fenbuconazole 19.74 340 126 8.3 161 11 141 4.1 127 12 101 26 Fluquinconazole 20.11 198 163 15 261 15 172 5.1 174 18 149 12 Cypermethrin 20.38-20.58 163 153 13 418 20 168 13 177 18 140 12 Fluridone 20.98 328 172 13 265 13 204 5.0 220 20 198 12 Fenvalerate-1 21.31 225 135 11 234 12 158 9.9 178 19 143 14 Fenvalerate-2 21.54 225 144 13 242 13 160 10 184 19 144 10 Difenoconazole-1 21.89 323 129 20 376 15 235 13 277 33 237 23