4
International review for spatial planning and sustainable development, Vol.2 No.1 (2014), 4-22 ISSN: 2187-3666 (online)
DOI: http://dx.doi.org/10.14246/irspsd.2.1_4
Copyright@SPSD Press from 2010, SPSD Press, Kanazawa
Evaluating Emergency Response Activities during Earthquakes in Local Cities of Japan
To develop a tool to support community-based disaster mitigation planning
Akira Ohgai
1*and Takatoshi Yamamoto
11 Department of Architecture and Civil Engineering, Toyohashi University of Technology, Japan
*Corresponding Author, Email: [email protected] Received 19 April 2013; Accepted 26 October 2013
Key words: Earthquake Disaster mitigation, Emergency response activities, Evaluation method, Community-based planning, Local cities
Abstract: This study attempts to develop a method to evaluate the difficulty of emergency response activities in densely built-up areas, focusing on practical usefulness and issues in local cities of Japan. The emergency response activities are classified into evacuation, firefighting, and rescue, based on previous research. The method evaluates the difficulty of the activities by calculating the non-arrival probability and arrival distance for each building, using physical condition data. The developed method is applied to case study districts in Japanese local cities that have disaster mitigation issues. From spatial and quantitative analysis using evaluation results of the emergency response activities, we found that the difficulty of the activities in local cities is relatively low compared with results obtained in previous research dealing with densely built-up areas in big cities such as Tokyo and Osaka. Finally, we discuss the possibility of the proposed method as a support tool for community-based planning for disaster mitigation that can plainly offer residents useful information about the difficulty of the response activities.
1. INTRODUCTION
Japan has experienced many seismic disasters since time immemorial.
However, there exist many densely built-up areas with a high proportion of old wooden structures and many narrow roads that are considered to have disaster mitigation issues. These areas face many problems, such as building collapse, fire spread, and safety of evacuation pathways. Improvement of densely built-up areas has been seen as one of the most urgent problems in urban policy in Japan (Ministry of Land, Infrastructure, Transport and Tourism, 2002). In order to solve the problem and reduce the risk level in these areas, it is crucially important to promote collaborative planning with public involvement at the community level for improvement of the local environment through consensus building among residents in areas concerned (Pearce, 2003).
However, for residents who have little professional planning knowledge, it is difficult to make effective and concrete plans for disaster mitigation.
For this reason, development of planning support technologies to reduce the
difficulty and help consensus building has been encouraged as a matter of
national policy in Japan (MLIT, 2002).
Road blockage by seismic-induced building collapse is one of the main problems for disaster mitigation. Road blockage causes difficulty during emergency response activities such as evacuation, firefighting, and rescue. It is important to evaluate that difficulty in collaborative planning with public involvement, especially when dealing with densely built-up areas with old wooden buildings and many narrow roads. If there were a method that could visually and quantitatively offer the residents information about the evaluation of the activities, the information would be useful for consensus building, enhancing awareness of the need for improvement of local environment, and decision making in planning for disaster mitigation.
The Ministry of Land, Infrastructure, Transport and Tourism (2005) released a list of densely built-up areas totalling 8,000 hectares nationwide that are considered to have disaster mitigation issues in case of seismic occurrences and need to be urgently improved. Half of the 8,000 hectares are found in Tokyo and Osaka, while the other half are in the local cities.
Though densely built-up areas with old wooden buildings and narrow roads exist in local cities, there are also substantial amounts of open space, such as farmland and open-air parking. Additionally, the spatial size of these areas is small compared with the densely built-up areas in the metropolises.
Accordingly, because of these differences in spatial scale, density level, and other measures, the characteristics of the disaster mitigation issues in local cities could be considered different from those in the metropolitan areas.
In Japan, there are many previous studies related to emergency response activities (for example, Ichikawa, Sakata, et al., 2004; Ieda, Mochizuki, et al., 1998; Kato, Yusuf, et al., 2001; Kugai and Kato, 2007; Imaizumi and Asami, 2000) including a comprehensive technology development project by the Japanese government (Ministry of Land, Infrastructure, Transport and Tourism, 2003). However, most of these studies deal with the built-up areas in metropolises such as Tokyo and Osaka and focus on analysis of accessibility of evacuation sites or collapsed buildings for firefighting or recue activities. In order to offer residents information on the evaluation of emergency response activities in disaster mitigation planning in local cities, it is important to develop an evaluation method suited to the characteristics of the issues in local cities as well as to give residents easily understandable information.
Using the background described above, in this study, we try to develop a method for evaluating the difficulty of emergency response activities in case of seismic disasters and discuss the characteristics of urban vulnerability in Japanese local cities through applying the method to some case study areas.
The goal of this study is to provide a support technology for community- based disaster mitigation planning, one that can plainly offer residents useful information on the difficulties of emergency response activities.
This paper is organized as follows: Following review of related research,
(1) using the results of a previous study (MLIT, 2003), we try to develop an
evaluation method for the difficulty of emergency response activities,
focusing on practical usefulness and issues in local cities; (2) the developed
method is applied to case study areas with densely grouped old wooden
buildings and many narrow roads. Based on the visual and quantitative
evaluation results, the usefulness and problems of the proposed evaluation
method and the characteristics of vulnerability in local cities are discussed.
2. REVIEW OF RELATED RESEARCH
There are many previous researches dealing with emergency response against natural disasters. These can be roughly classified into two categories.
One is related to evaluation methods of evacuation against various disasters like earthquakes, floods, tsunamis, and typhoons (for example, Chen, et al., 2012; Wang and Zhao, 2012; Kim, et al., 2011; Jelinek, et al. 2012; Wood and Schmidtlein, 2012; Zou, et al., 2006). Another is researches dealing with methodology and its application for evacuation planning or decision support system against various disasters like earthquakes, floods or hurricane (for example, Ye, et al., 2012; Lindell and Prater, 2005; Zhang, et al., 2013;
Coutinho-Rodrigues, et al., 2012; Saadatseresht, et al., 2009).
Among the former studies, Wood and Schmidtlein (2012), Zou, et al.
(2006), Wang and Zhao (2012) and Chen, et al. (2012) assess the risk of evacuation or rescue focusing on the individual behaviors. But the subject of disaster taken by Wood and Schmidtlein (2012) and Zou, et al. (2006) is tsunami and typhoon respectively. Wang and Zhao (2012) analyze the potential risks during residents’ evacuation when facing earthquakes or fire hazards in Chinese residential quarters. However, the analysis does not take account of road blockage caused by seismic-induced building collapse.
Moreover, Chen, et al. (2012) takes a unique approach of assessing evacuation risk with consideration pre- and post-disaster factors. Although the post-disaster factors include the spatial impact of the disaster and the potential for traffic congestion caused by the evacuee routing behaviors, the subject to which is applied the proposed method is the transportation network of the whole city of Beijing, China, not a network for community- scale evacuation or rescue. The method we propose in this study focuses on evaluating community-scale evacuation or rescue risks caused by road blockage accompanying seismic-induced building collapse in densely built- up areas with old wooden buildings and many narrow roads.
Within the latter studies, Coutinho-Rodrigues, et al. (2012) and Saadatseresht, et al. (2009) introduce multiobjective optimization approaches related to evacuation paths, shelter locations and path lengths, of which the purpose is not to evaluate individual emergency response activities, but for evacuation planning. Lindell and Prater (2005) developed a hurricane evacuation management decision support system based on evacuation behaviors. Moreover, Ye, et al. (2012) propose a methodology for community-scale evacuation planning. The proposed methods by them could be used to formulate pre-event planning for organizing a rapid and smooth evacuation. The evaluation method we propose here is not for evacuation planning in local authorities, but to provide resident with useful information on the difficulties of emergency response activities during earthquakes for collaborative disaster mitigation planning at community- scale.
3. AN EVALUATION METHOD FOR EMERGENCY RESPONSE ACTIVITIES
3.1 The basic concept
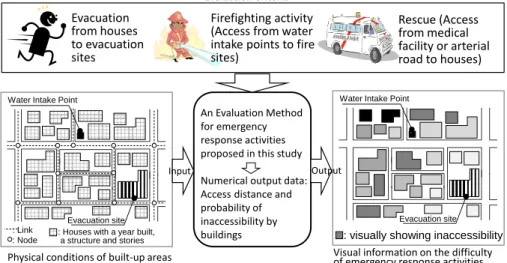
In Figure 1 and Table 1, the basic concept for developing a method of
evaluating emergency response activities is summarized. The evaluation
method in this study uses geographical data representing the physical conditions of built-up areas (building and its attributes like year built, structure and story, road link and node, road width, evacuation site, and water intake point for firefighting). These data are needed for calculating the difficulty of the activities for each building. Emergency response activities to be evaluated were categorized into three types: evacuation, firefighting, and rescue. These activities are evaluated by two types of output data as shown in Table 1. The evaluation results are numerically determined and visually shown by building, not by block or road link.
: Houses with a year built, a structure and stories
Evacuation site : Link
: Node Water Intake Point
Evacuation site Water Intake Point
: visually showing inaccessibility Physical conditions of built-up areas Visual information on the difficulty
of emergency response activities
Evacuation
from houses to evacuation sites
Firefighting activity (Access from water intake points to fire sites)
Rescue (Access from medical facility or arterial road to houses)
Evaluation CriteriaAn Evaluation Method for emergency response activities proposed in this study Numerical output data:
Access distance and probability of inaccessibility by buildings
Input Output
Figure 1. The image of the basic concept for developing a method of evaluating emergency response activities
Table 1. The basic concept of the evaluation method Input data (physical
conditions of built-up areas)
(1) Building,
(2) Building attributes (year built, structure and story), (3) Road link and node, (4) Road width,
(5) Evacuation site, and (6) Water intake point for firefighting
Output data (1) Probability of inaccessibility and (2) Access distance [meters]
Evaluation unit Building (not road link or node) Evaluation activities
(evaluation criteria)
(1) Evacuation, (2) Firefighting, and (3) Rescue (each is evaluated by the output data: probability of inaccessibility and access distance [meters] if accessible)
3.2 Evaluation criteria
The evaluation criteria are simplified on the basis of previous research focusing on provision of easy-to-understand information for residents. The previous research used nine criteria, as shown in the left column of Table 2 (MLIT, 2003). However, it is generally thought that residents would find it difficult to understand the evaluation result if there are too many criteria.
There is a need to reduce the amount of information for easy understanding
while at the same time keeping the important factors that residents can
recognize as critical needs and that can be useful during consensus building
for improvement of the local environment. Based on this reasoning, the
criteria used in this research are redefined to the following: (1) evacuation,
(2) firefighting, and (3) rescue.
Table 2. Criteria of the evaluation method
Criteria (activities) used in previous works Criteria proposed 1) Evacuation from buildings with risk of collapse, falling
objects, and so on due to earthquakes
>> Evacuation 2) Evacuation from collapsed building
3) Evacuation from fire spread area 4) Access to fire site
>> Firefighting 5) Prevention of fire spread
6) Casualty rescue
>> Rescue 7) Transportation of seriously injured person to hospital
8) Transportation of slightly injured person to aid station 9) Transportation of supplies to aid station
3.2.1 Criterion 1: Evacuation
This study defines evacuation as an act to protect oneself from earthquake damage such as building collapse, falling objects due to earthquakes, and fire spread. This definition was chosen because it is meaningful for residents to get the information on the risk level of the entire act of evacuation itself rather than of particular dangers.
In Japanese local cities, there are many types of open spaces, such as farmland, open-air parking, and unused land, which can play the role of temporary evacuation space. In reality, many people would use these spaces during emergencies. Consequently, there is a need to consider the temporary evacuation spaces in addition to assigned evacuation sites. Therefore, the following two types of points are treated as evacuation sites for evaluating evacuation activity in this study:
1. temporary evacuation space in the neighbourhood: spaces such as open-air parking, parks, and farmlands that are safe from building collapse and falling objects
2. designated evacuation sites: evacuation sites such as elementary schools, junior high schools, and community centres assigned by local government
The difficulty of evacuation from each building to the evacuation site is evaluated by considering the following cases: (1) only the designated evacuation sites and (2) the nearest site, including both temporary and designated evacuation sites.
3.2.2 Criterion 2: Firefighting
For evaluation of the difficulty of firefighting activity in this study, the following three processes of firefighting were considered: (1) fire engines and firefighters arrive at the water intake points nearest to the fire site, (2) they take the water for firefighting to the fire site, and then (3) firefighters uncoil the hose and discharge the water.
The water intake points are the natural water supply and earthquake- proof tanks. They do not include fire hydrants because fire hydrants might fail to function as a result of earthquake damage. Therefore, firefighters will be forced to use only the water intake points considered in this research. In general, initial firefighting by residents is important for minimization of fire damage. Therefore, it is important to consider resident participation in firefighting. However, because of the difficulty of quantifying and modelling initial firefighting activities, the present experimental research only considers activities by firefighters.
Based on the above considerations, the difficulty of firefighting by
firefighters is evaluated by the accessibility of each building from the water intake points. Additionally, the access distance in this evaluation is limited by the fire hose extent, defined by the municipality.
3.2.3 Criterion 3: Rescue
Rescue here implies the act of saving persons from collapsed buildings and transferring injured persons to medical facilities via arterial roads. The evaluation of such rescue activities is for emergency cars used by persons such as firefighters, police officers, and defence groups saving the injured persons. In reality, it should be considered that residents would participate in rescue and transfer of injured persons to medical facilities by private cars or stretchers. However, for the same reason as in criterion 2 (firefighting), the present experimental research considers only rescue by professionals using emergency vehicles.
Accordingly, the difficulty of rescue activities is evaluated on the basis of the accessibility of each building by emergency vehicles from medical facilities or arterial roads. Here, arterial roads are used as starting points for access to each collapsed building when there is no medical facility within the area to be evaluated. This is because emergency vehicles would arrive at the point nearest to collapsed buildings via arterial roads.
3.3 Evaluation procedure
The outline of the evaluation procedure is shown in Figure 2. Each step in the evaluation is explained below.
Step 4: Calculating the nonarrival probability and the arrival distance based on Step 3.
Step 2: Calculating the probability of road blockage by link Step1: Setting prerequisites for each criterion and road network
Evacuation
Temporary evacuation space in the neighborhood
Designated evacuation site
Firefighting Rescue
Step 3: Calculating the practicable route and the distance from origins to destinations for each criterion (Probabilistic calculation process)
Generating a practicable road network based on the probability of road blockage by link calculated in Step 2.
Practicable routes and distances from origins to destinations for each criterion.
Searching the shortest path from origin points to destination points using the road network generated.
Iteration
Figure 2. Outline of the evaluation procedure
Step 1: Setting prerequisites for each criterion and road network
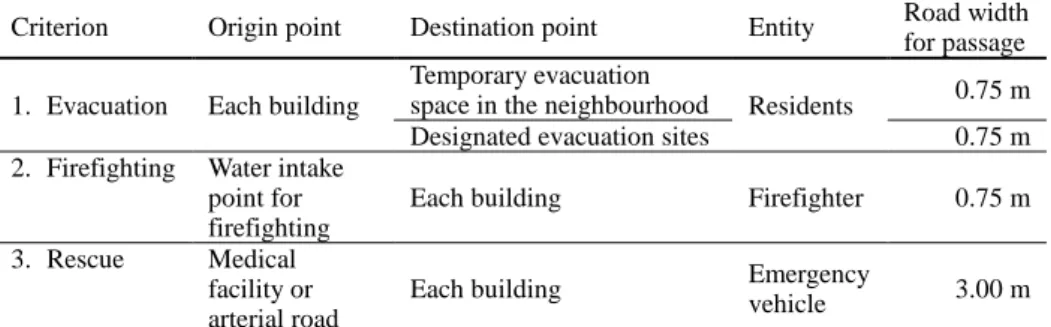
First of all, the origin and destination points, the entity acting, and the road width for passage are set as prerequisites for each criterion, as shown in Table 3. The road width for passage means the minimum width that residents and firefighters need to use a road for evacuation or firefighting.
Likewise, for rescue, it means a width that allows emergency vehicles to traverse the road. These values are referred to in MLIT (2003).
In community-based planning for disaster mitigation, the final focus of
the evaluation of the difficulty of the activities would be on whether or not
each resident can evacuate from his or her building and whether or not the
rescue team and firefighters can reach the building. In short, an output expression of the evaluation based on building unit is required for such planning. However, the road network used in the previous study (MLIT, 2003), as shown in the left-hand part of Figure 3, enables calculation of the difficulty of the activities by link, but not by building. A revised road network, adding links and nodes by buildings as shown in the right-hand part of Figure 3, is proposed in this study. This revision enables the calculation and output expression of difficulty for each building. Moreover, it allows evaluation of difficulty caused by a road blockage in front of a building from which residents evacuate.
Table 3. Prerequisites for each criterion
Criterion Origin point Destination point Entity Road width for passage 1. Evacuation Each building
Temporary evacuation
space in the neighbourhood Residents 0.75 m
Designated evacuation sites 0.75 m
2. Firefighting Water intake point for firefighting
Each building Firefighter 0.75 m
3. Rescue Medical facility or arterial road
Each building Emergency
vehicle 3.00 m
Note: The range of firefighting activity is limited by the fire hose extent.
(b) This study (a) Previous research Building
Road
: Link : Node : Link
: Node
Figure 3. The road networks used in the previous research and in this study
Step 2: Calculating the probability of road blockage by link
The probability of road blockage for each link of the road network in a subject area is calculated by using the following three probabilities:
1. Probability of building collapse, P
r(%): This is set by the fragility- curves that have been defined by the relationship between seismic intensity and building damage (Murao and Yamazaki, 2002), which were estimated by use of data obtained from the Hanshin-Awaji Earthquake in 1995. Here, the probabilities shown in Table 4 are used.
2. Probability of debris outflow into frontal roads, P
f(%): This shows the probability that debris of a collapsed building flows into the frontal road of the site. This probability is calculated by expression (1) (Ieda, Mochizuki, et al., 1998).
0541 . 0 1753
.
1
cf
B
P (1)
where B
cis the building-to-land ratio.
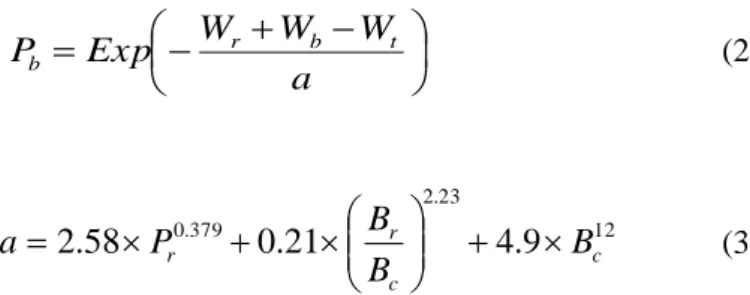
3. Probability of road blockage due to debris outflow, P
b(%): This is the probability that the road in front of a building is blocked by debris outflow.
This is obtained by expressions (2) and (3) (Ieda, Mochizuki, et al., 1998).
a
W W Exp W
P
b r b t(2)
12 23
. 2 379
.
0
0 . 21 4 . 9
58 .
2
cc r
r
B
B P B
a
(3)
where W
ris the road width in front of a building, W
bis the setback width from the road, W
tis the road width for passage, shown in Table 3, a is the average length of debris, and B
ris a floor area ratio.
Therefore, the probability of road blockage at link l, P
l(%) is calculated by the expressions (4) and (5) (MLIT, 2003).
ni
i
l
P
P
1
)
1
(1 (4)
) ( ) ( ) ( )
(i
P
riP
f iP
biP (5) where n is the total number of buildings on the roadside and P
(i)is the probability of road blockage in front of building i.
Table 4. Probabilities of building collapse by earthquake intensity
Building structure Year built Seismic intensity
6 upper 7
Wooden structure
Before 1952 0.55 0.75
1952–1971 0.45 0.70
1972–1981 0.20 0.40
After 1981 0.05 0.15
Steel structure
Before 1971 0.35 0.50
1972–1981 0.10 0.25
After 1981 0.05 0.10
Reinforced concrete structure
Before 1971 0.10 0.20
1972–1981 0.05 0.10
After 1981 0.02 0.05
Step 3: Calculation of the practicable route and the distance from origin to destination for each criterion (probabilistic calculation process)
A practicable road network excluding links blocked by debris overflow is generated by comparing the probability of road blockage by link calculated in Step 2 and a randomly generated number. The shortest practicable route from each origin point to each destination point for each criterion (activity) is then determined by using a shortest-path search. The result of this calculation depends on the road network generated by using the probabilistic Monte Carlo method. Therefore, iteration of the above calculation is needed in order to obtain reliable values probabilistically. In this study, the number of iterations was set at 2000, as in the previous study (MLIT, 2003).
Step 4: Calculation of nonarrival probability and arrival distance
Finally, the nonarrival probability for building i, P
i(%), and the arrival distance, D
i(m), are calculated, using the results of Step 3. The values are obtained from equations (6) and (7). The nonarrival probability is the probability that the entity cannot arrive at the destination point from an origin point because, as a result of road blockage, no practicable route exists.
The arrival distance is the average of the shortest distances from an origin
point to the destination point when practicable routes exist on the road
network.
100 1
T
P
iA
i(6)
i A
k k i
i
A
D D
i
1(7)
where i is the identification number of the building (if the criterion is evacuation, it corresponds to the origin point, but in firefighting and rescue, it corresponds to the destination point), A
iis the times it can take to arrive (at the destination from building i if evacuation or at building i from the origin point in firefighting or rescue activities), T is the iteration times, and D
ikis the shortest distance between building i and the origin or destination point if practicable routes exist in the kth iteration time.
3.4 Data Set
Use of the building-to-land ratio and plot ratio was a precondition for calculating road blockage probability in a previous study (Ieda, Mochizuki, et al., 1998). However, in actual application, it is necessary to evaluate easily without putting too much time and effort into data collection and preparation, while ensuring some degree of data accuracy. In view of these considerations, the data collection and preparation are simplified as explained below.
1. Building-to-land ratio, B
cWhen calculating the building-to-land ratio, plot size is required. The GIS data of block and building shape are available through local government in Japan, but the borders of the plot on which the building stands are not included in the data. Therefore, it is difficult to prepare the building-to-land ratio data. In this research, the floor space of all the buildings in a block are summed up and divided by the block area, and the resultant value is used as the building-to-land ratio.
2. B
r/B
cLikewise, it is difficult to survey and obtain the plot ratio data, B
r. However, the GIS data of the structure and the number of stories are available through local government in Japan. Therefore, the approximate value of B
r/B
ccan be obtained by using the structure and the number of stories, as shown in Table 5. The value is a generally accepted value in Japan because of the characteristics of Japanese buildings.
Table 5. Approximate values of B
r/B
c4. APPLICATION
The evaluation method is applied to the following three districts of local cities in Japan: Akumi, Komoguchi, and Akabane. The first two districts are in Toyohashi city, and the last is in Tahara city (see Figure 4).
Building Stories Building Structure Approximate values of B
r/B
c1 Wooden, nonwooden 1
2 Wooden 1.5
Nonwooden 2
3 or more Wooden, nonwooden Number of stories
Aichi Prefecture
efectu
Pacific Ocean Sea of Japan
Aichi Prefecture
Toyohashi City
Akumi District Akabane District Tahara City
Tokyo Metropolitan
Komoguchi District
Figure 4. The location of case study districts
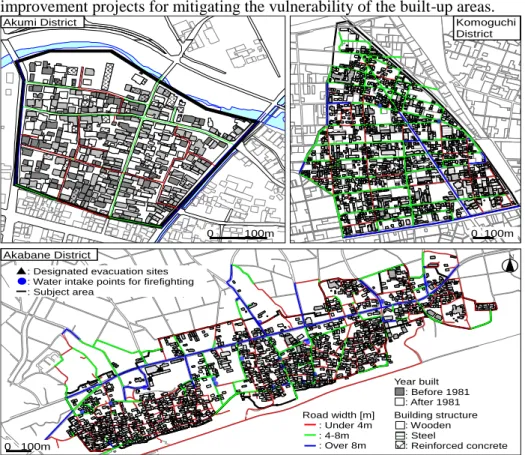
4.1 Overview of Case Study Districts
These districts have seismic disaster mitigation issues due to the existence of many narrow roads and densely built-up areas with old wooden buildings, as shown in Figure 5. Furthermore, occurrences of huge disaster damage due to big earthquakes are feared in these municipalities. The Japanese central government had designated these municipalities as priority areas for seismic disaster mitigation measures in 2002. Therefore, the municipalities in these case study areas are seriously working on improvement projects for mitigating the vulnerability of the built-up areas.
Road width [m]
: Under 4m : 4-8m : Over 8m
Year built : Before 1981 : After 1981 Akabane District N
Akumi District
Building structure : Wooden : Steel
: Reinforced concrete Komoguchi District
: Designated evacuation sites : Water intake points for firefighting : Subject area
0 100m
0 100m
0 100m
Figure 5. Case study districts
The characteristics of these case study districts are shown in Table 6. The Akumi district is a small-scale densely built-up area that never encountered world war damage. Additionally, because of the lack of damage, this district was not involved in the improvement of urban infrastructure after the war.
Therefore, while the number of buildings is the smallest, the area still has
the highest ratio of old wooden buildings. Moreover, there are relatively
many narrow roads, lacking water intake points for firefighting. On the other
hand, the Komoguchi district is a built-up area developed by arable land
readjustment, sprawling over 60 hectares with a low building density, 20 buildings/hectares. Thus, the area has many open spaces and open-air parking lots.
The Akabane district is a fishery and agricultural settlement of 70 hectares. The size of each plot in the area is large, and designated evacuation sites such as elementary schools, community centres, and many open spaces exist within the district. While the road density is the highest among all the case study districts, the percentage of narrow roads is also the highest.
If there would be a local fire station, the accessibility to the fire station by firefighters would be critical for evaluating the firefighting activity.
However, in all districts, there is no local fire station within the subject area.
Therefore, in this case study, assuming that firefighters can arrive at water intake points, we evaluate the difficulty of firefighting by firefighters by the accessibility from the water intake points to buildings.
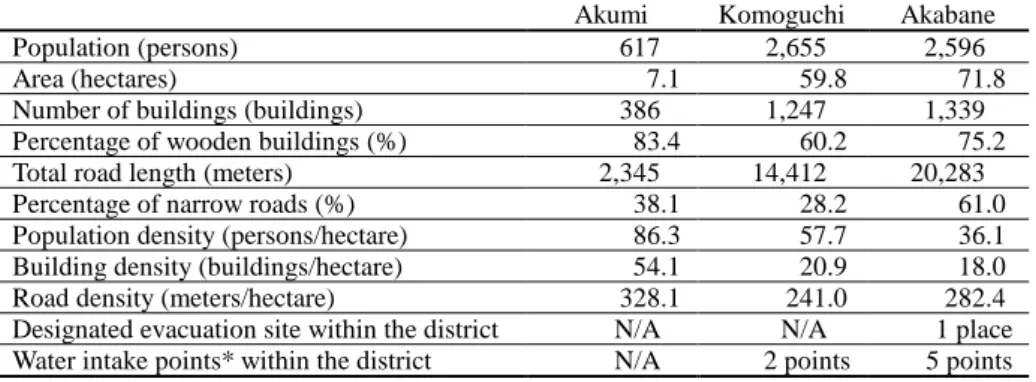
Table 6. The characteristics of case study districts
Akumi Komoguchi Akabane
Population (persons) 617 2,655 2,596
Area (hectares) 7.1 59.8 71.8
Number of buildings (buildings) 386 1,247 1,339
Percentage of wooden buildings (%) 83.4 60.2 75.2
Total road length (meters) 2,345 14,412 20,283
Percentage of narrow roads (%) 38.1 28.2 61.0
Population density (persons/hectare) 86.3 57.7 36.1
Building density (buildings/hectare) 54.1 20.9 18.0
Road density (meters/hectare) 328.1 241.0 282.4
Designated evacuation site within the district N/A N/A 1 place Water intake points* within the district N/A 2 points 5 points
* the natural water supply and earthquake-proof tanks, excluding fire hydrants
4.2 Data preparation and assumptions
The input data for calculation consist mainly of building attributes such as structure, number of stories, year built, road network with link and node, road width, and location data like evacuation sites or water intake points.
The text-formatted data are generated from GIS data of case study districts.
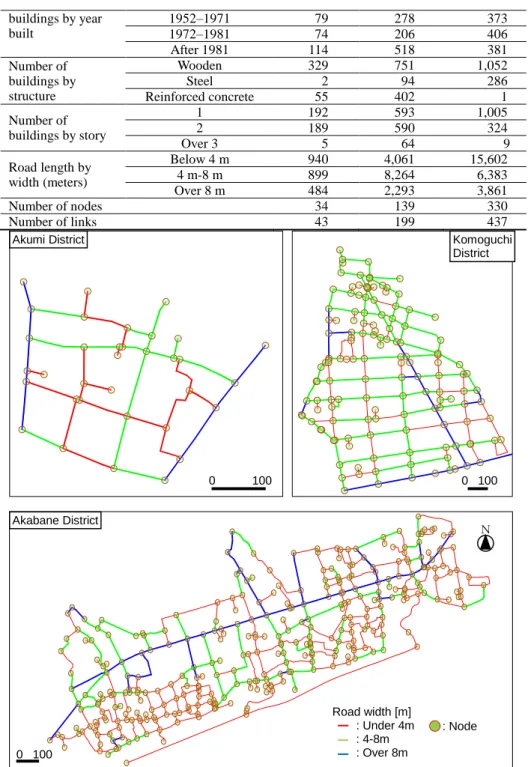
Within the GIS, the structure, number of stories, year built, and building-to- land ratio data are attributed to each building shape. The data of road width are added to the road link. The descriptive statistics of the data of case study districts for calculation is shown in Table 7. And Figure 6 shows road network (links and nodes) and the width by link in three case study districts.
The locations of evacuation sites and water intake points within the districts are shown in Figure 5. Moreover, each building is given a node linked with the nearest road intersection node. This enables each building to be evaluated individually.
As assumptions for evaluation, the earthquake scale was set to an intensity of 6-upper, based on an expected earthquake damage survey that had been done by the municipalities. All buildings that do not directly border any road in a block were assumed to be inaccessible because the difficulty of evacuation to the outside of the block would be very high as a result of possible collapse of surrounding buildings. The maximum fire hose extent was set at 400 m (20 m per piece by 20 pieces) for firefighting activity.
Table7. Physical conditions related to emergency response activities by districts
Akumi Komoguchi Akabane
Number of Before 1952 119 245 179
buildings by year built
1952–1971 79 278 373
1972–1981 74 206 406
After 1981 114 518 381
Number of buildings by structure
Wooden 329 751 1,052
Steel 2 94 286
Reinforced concrete 55 402 1
Number of buildings by story
1 192 593 1,005
2 189 590 324
Over 3 5 64 9
Road length by width (meters)
Below 4 m 940 4,061 15,602
4 m-8 m 899 8,264 6,383
Over 8 m 484 2,293 3,861
Number of nodes 34 139 330
Number of links 43 199 437
1:10000
1:10000
Akumi District Komoguchi
District
Akabane District 1:2500
0 100 0 100
0 100
N
Road width [m]
: Under 4m : 4-8m : Over 8m
: Node
Figure 6. Road network (links and nodes) by case study districts
4.3 Application results
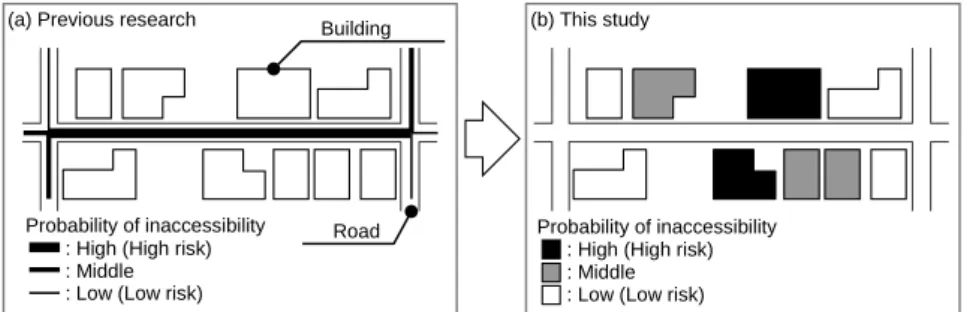
As mentioned in previous section, the output expression of the
evaluation must use the building unit to be useful for community-based
planning for disaster mitigation. Therefore, the evaluation output is as
shown in Figure 7(b) for each building, not as in Figure 7(a) for link units.
(a) Previous research (b) This study
Probability of inaccessibility : High (High risk) : Middle : Low (Low risk) Probability of inaccessibility
: High (High risk) : Middle : Low (Low risk)
Building
Road
Figure 7. Difference in the output expression between the previous research and this study
The application results are shown in Figures 8 to 10 and Tables 8 to 11.
The nonarrival probability and arrival distance for each district are analyzed for each activity as follows.
4.3.1 Evacuation
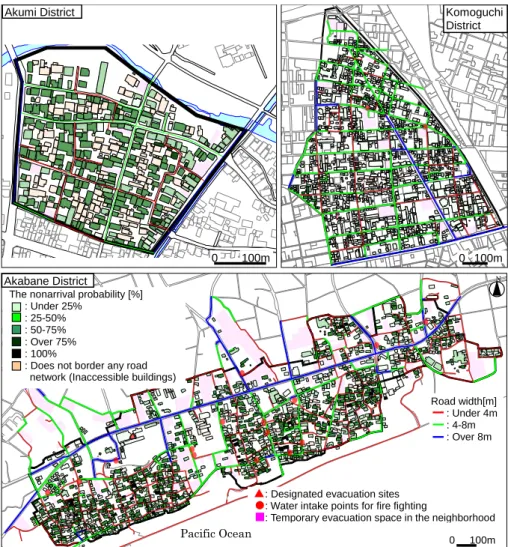
Looking at the distributions of nonarrival probability shown in Table 8 and Figure 9, we can find that the difficulty of evacuation to temporary evacuation spaces in the Akumi district is the highest among the three districts. This is because the Akumi district has a high building density and few temporary evacuation spaces in the neighbourhood. The peak of the arrival distance from buildings to a temporary evacuation space in the district is between 100 m and 200 m, as shown in Figure 8.
0 10 20 30 40 50
0 200 400 600 800 1000
Composition ratio [%]
Arrival distance [m]
Arrival distance for temporary evacuation space in the neighborhood
: Akumi District : Komoguchi District : Akabane District
Arrival distance for designated evacuation sites
: Akumi District : Komoguchi District : Akabane District
Figure 8. Evaluation results of arrival distance for evacuation
Komoguchi District has few temporary evacuation spaces in the neighborhood, as shown in Figure 8, and the ratio of narrow roads is less than 30% (see Table 6). The arrival distance to a temporary evacuation space tends to be longer than in the Akumi district, but about 85% of all buildings have a nonarrival probability under 25%.
On the other hand, focusing on the Akabane district, because there are many temporary evacuation spaces in the neighborhood (see Figure 9), the arrival distance from most buildings is less than 100 m, as shown in Figure 8. However, because there are many narrow roads (the ratio is 61.0%), more than 70% of buildings are concentrated between 25% and 75% nonarrival probability.
The evaluation results of evacuation to designated evacuation sites have a tendency similar to those of evacuation to temporary evacuation spaces.
Comparing these results with those in extremely densely built-up areas
of big cities such as Tokyo (Ichikawa, Sakata, et al., 2004), that have many
inaccessible buildings in the districts, we find that the difficulty of
evacuation activity in local cities is dramatically low. This is because a lot of farmland and open spaces, open-air car parks, and so on can be used as temporary evacuation spaces in local cities.
0 100m Pacific Ocean
The nonarrival probability [%]
: Under 25%
: 25-50%
: 50-75%
: Over 75%
: 100%
: Does not border any road network (Inaccessible buildings)
: Designated evacuation sites : Water intake points for fire fighting
: Temporary evacuation space in the neighborhood Road width[m]
: Under 4m : 4-8m : Over 8m
N
0 100m 0 100m
Akumi District Komoguchi
District
Akabane District
Figure 9. Evaluation results of the nonarrival probability for temporary evacuation spaces in the neighborhood
Table 8. Evaluation results of nonarrival probability for evacuation Nonarrival
probability
Akumi Komoguchi Akabane
Temp. Desig. Temp. Desig. Temp. Desig.
Under 25% 17
(4.4)
17 (4.4)
1,067 (85.6)
867 (69.5)
190 (14.2)
190 (14.2)
25–50% 68
(17.6)
76 (19.7)
22 (1.8)
128 (10.3)
467 (34.9)
467 (34.9)
50–75% 158
(40.9)
151 (39.1)
23 (1.8)
61 (4.9)
490 (36.6)
482 (35.9)
Over 75% 8
(2.1)
7 (1.8)
0 (0.0)
10 (0.8)
37 (2.8)
45 (3.4) Inaccessible 135
(35.0)
135 (35.0)
135 (10.8)
181 (14.5)
155 (11.6)
155 (11.6)
Total 386 (100.0) 1,247 (100.0) 1,339 (100.0)
Note: (1) Numerical value is number of buildings and parenthesis is composition percentage.
(2) Temp.; Temporary evacuation space in the neighborhood; Desig.; Designated evacuation sites.
Table 9. Evaluation results of the arrival distance for evacuation Arrival
distance
Akumi Komoguchi Akabane
Temp. Desig. Temp. Desig. Temp. Desig.
Under 200m
231 (59.8)
18 (4.7)
632 (50.7)
45 (3.6)
1,173 (86.9)
57 (4.2)
200–500m 20
(5.2)
198 (51.3)
453 (36.3)
235 (18.8)
11 (0.8)
303 (22.4)
Over 500 0
(0.0)
35 (9.1)
27 (2.2)
786 (63.0)
0 (0.0)
824 (61.0)
Inaccessible 135 135 135 181 155 155
(35.0) (35.0) (10.8) (14.5) (11.6) (11.6)
Total 386 (100.0) 1,247 (100.0) 1,339 (100.0)
Note: (1) Numerical value is number of buildings and parenthesis is composition percentage.
(2) Temp.; Temporary evacuation space in the neighborhood; Desig.; Designated evacuation sites.
4.3.2 Firefighting
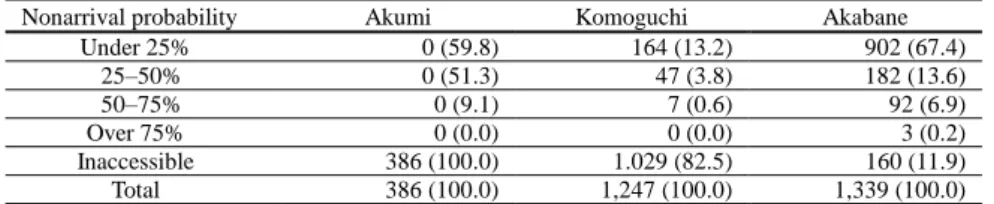
As shown in Table 10, the nonarrival probability from water intake points to buildings by firefighters is ‘inaccessible’ for all buildings in the Akumi district and for 82.5% of buildings in the Komoguchi district. This is because the inadequate water intake points for firefighting result in areas that cannot be reached because of the limit of fire hose length, not the road blockages.
On the other hand, in the Akabane district, because of well-developed water intake points, the nonarrival probability is under 25% for 67.4% of buildings. Therefore, the difficulty faced by firefighters during firefighting activity is relatively low.
In this study, the firefighting evaluation considered only the activities of firefighters. However, it would be a more effective tool for enhancing awareness if there were a way to compare the evaluation results when residents do and do not participate in the firefighting activity.
Table 10. Evaluation results of the nonarrival probability for firefighting
Nonarrival probability Akumi Komoguchi Akabane
Under 25% 0 (59.8) 164 (13.2) 902 (67.4)
25–50% 0 (51.3) 47 (3.8) 182 (13.6)
50–75% 0 (9.1) 7 (0.6) 92 (6.9)
Over 75% 0 (0.0) 0 (0.0) 3 (0.2)
Inaccessible 386 (100.0) 1.029 (82.5) 160 (11.9)
Total 386 (100.0) 1,247 (100.0) 1,339 (100.0)
Note: Numerical value is number of buildings and parenthesis is composition percentage.
4.3.3 Rescue
As you can see from Figure 10 and Table 11, because of the arterial roads passing through the Akabane district, the nonarrival probability for buildings along these roads is relatively low. The other districts more or less have a similar tendency. However, since there are many narrow roads in the inner part of the districts, buildings inaccessible by emergency vehicles exist in large numbers. This is especially true in the Akabane district, where the built-up area is structured along the arterial road but has excessively high difficulty levels for rescue activities in the inner area.
However, the walking distances from arterial roads to buildings in all
three districts are relatively short, about 500 m at the longest. Therefore, it is
possible for persons to carry the injured on stretchers from buildings to
arterial roads. Because of this ability, when considering rescue activities in
local cities, it is important to also add rescue activities by residents into the
evaluation method.
N
0 300m
Pacific Ocean
Road width[m]
: Under 4m : 4-8m : Over 8m The nonarrival probability [%]
: Under 25%
: 25-50%
: 50-75%
: Over 75%
: 100%
: Does not border any road network (Inaccessible buildings)