1
Title: Characteristic of slow growth in cell culture of adenovirus type 54 causing
1
nationwide outbreak epidemic keratoconjunctivitis in Japan
2
Running Title: Slow propagation of adenovirus 54
3
Tomoko Tsukahara-Kawamura1,2), Nozomu Hanaoka2), Masami Konagaya2), Eiichi Uchio1)*,
4
Tsuguto Fujimoto2)
5
1) Department of Ophthalmology, Fukuoka University School of Medicine, 7-45-1 Nanakuma,
6
Jonan-ku, Fukuoka 814-0180, Japan
7
2) Infectious Disease Surveillance Center, National Institute of Infectious Diseases, 1-23-1
8
Toyama, Shinjuku-ku, Tokyo 162-8640, Japan
9
*Corresponding author: Eiichi Uchio, M.D., PhD.
10
Department of Ophthalmology, Fukuoka University School of Medicine, 7-45-1 Nanakuma,
11
Jonan-ku, Fukuoka 814-0180, Japan,
12
Tel +81 92 801 1011
13
Fax +81 92 865 4445
14
E-mail: [email protected]
15
Abstract
16
Purpose: To characterize the virological features of adenovirus type 54 (Ad54) causing
17
nationwide outbreak of severe epidemic keratoconjunctivitis (EKC) in Japan, we
18
2
comparatively analysed the viral propagation phenotype of Ad54 and other Ads: Ad type 37
19
(Ad37), 64 (Ad64), and 5 (Ad5), in A549 cells quantitatively.
20
Study Design: Laboratory investigation
21
Methods: We compared the growth rate of Ads using copy numbers and cytopathic effect
22
observation during propagation in A549 cell lines. Expressions of mRNA of E1 gene were
23
also calculated and compared. Phylogenetic analysis of the region, including putative
24
promoter of E1 gene and E1 open reading frame (ORF), were performed.
25
Results: Increases in viral loads, growth rate, and viral propagation were slower for Ad54
26
than for other Ads. The expression level of the E1 gene per infected cell was lower for Ad54
27
than for other Ad types on post-infection day 1. Phylogenetic analysis of the E1 gene putative
28
promoter and ORF revealed Ad54 was the closest to Ad type 8.
29
Conclusion: The propagation of Ad54 in A549 is slow compared with Ad37, Ad64 and Ad5.
30
Slow propagation could have been caused by slow genomic replication resulting from
31
delayed viral entry or E1 transcription initiation. The EKC caused by Ad54 needs more
32
attention because the slow propagation of Ad54 may contribute to prolonged disease
33
duration.
34
35
3
Keywords: adenovirus, epidemic keratoconjunctivitis, species D, type 54, slow propagation.
36
4
Introduction
37
Human mastadenovirus (Ad) is a DNA virus that infects various organs throughout the body
38
[1]. Ad has a linear, double stranded DNA genome, approximately 35 kb in size [2]. Over 100
39
types of Ad, including serotypes and genotypes, are known (http://hadvwg.gmu.edu/), and
40
they belong to seven species (Ad A to G) [2].
41
Among them, several members of Ad D species: Ad type 8 (Ad8), 37 (Ad37), 54
42
(Ad54), and 64 (formerly known as 19a) (Ad64) are responsible primarily for causing
43
epidemic keratoconjunctivitis (EKC). The ocular manifestations caused by the member of Ad
44
D viruses are more severe than those caused by Ad B (Ad type 3, 7), C: Ad type 2, 5(Ad5),
45
and E: (Ad type 4), which cause mild follicular conjunctivitis and pharyngoconjunctival fever
46
[3]. Thus, typing Ad isolated from eye samples can predict the clinical course of the
47
subsequent infection.
48
Recently, a number of recombinant Ad types have been identified and reported [4–
49
7], including Ad54, first reported as an Ad8 mutant in 2008 [8]. From 2015 to 2018, Ad54
50
caused nationwide outbreak and was the most frequently detected Ad type in eyes of patients
51
with EKC in Japan (https://nesid4g.mhlw.go.jp/Byogentai/Pdf/data41j.pdf), furthermore,
52
this type was found only in Japan until 2017 [9]. Globally, Ad8 is the main pathogen of EKC,
53
whereas in Japan its detection has declined [10], where Ad54 has become the primary EKC
54
type. No other viruses detected in patients with severe EKC have exhibited a detection rate as
55
5
high as that of Ad54 for 4 years consistently. Motivated by this epidemiological observation,
56
we investigated the viral characteristics of Ad54.
57
Species D reportedly exhibits slower reductions in the viral genome after infection [3]
58
and the high viral loads of Ad54 in clinical samples were reported as maintained over a long
59
period of time following disease onset [11]. As a feature of virus isolation from clinical
60
samples, Akiyoshi, et al. [12], Nakamura, et al. [13], and Kaneko, et al. [14] report that Ad54
61
detection is difficult and time-consuming. However, these three reports used only clinical
62
samples which contained viral loads variously for virus isolation, while quantitative
63
experiments could not be performed. Therefore, we conducted the quantitative analysis to
64
make the same amount of viruses to inoculate in A549 cells and attempted to elucidate the
65
reason for the difficulty of virus isolation with Ad54 compared with those of Ad37 and Ad64,
66
the major forms of EKC in Japan, and used Ad5 as control.
67
68
Materials and methods
69
70
Viral strain and cell lines
71
72
Prototype strains of Ad5 and Ad37 were obtained from the American Type Culture Collection
73
(ATCC) (Manassas). Ad54 and Ad64, as reported previously, were obtained from the
74
6
Adenovirus Reference Center (the National Institute of Infectious Diseases; NIID) [15, 16].
75
The strains were grown in A549 cells (CCL-185, ATCC) with Minimum Essential Medium
76
Eagle with Earle’s salts (Eagle’s MEM, Sigma-Aldrich Japan) supplemented with 5% fetal
77
bovine serum (Biowest), 1% L-Alanine/L-Glutamine (200 mmol/L) (Wako Pure Chemical
78
Industries (Wako)), 0.2% gentamicin sulfate solution (50 mg/ml) (Wako), and 0.1%
79
amphotericin B (Wako) in 25 cm2 tissue culture flask (TPP. After a 100% cytopathic effects
80
(CPE) was detected and subjected to two freeze-thaw cycles, the cells with medium were
81
collected in a 15 mL conical centrifuge tube. The tube was centrifuged at 1,500 ×g for two
82
minutes. The supernatant was collected in a new conical centrifuge tube, and 5% fetal bovine
83
serum was added to make a total volume of 10 ml. Each 500 l of the supernatant was stored
84
as viral stock at −80°C. All experiments described here were performed at NIID, an approved
85
facility equipped for experiments with viral infections. This study was not subject to ethical
86
review because it did not use clinical specimens or patient information.
87
88
Observation of CPE
89
90
A total of 50 μL of virus, containing 1.0 × 10⁵ copies/μL, was inoculated into 24 wells of
91
confluent A549 cell monolayers. The inoculated cells were maintained in 450 μL of 5%
92
Eagle’s MEM and incubated under an atmosphere of 5% CO2 (ASTEC CO. Ltd.). We added
93
7
500 μL of 5% Eagle’s MEM to the control wells. The cultures were daily observed over
94
seven days for the appearance of CPE. Each time the cells were observed, we took
95
photographs using a phase-contrast microscope (Wraymer) to examine for CPE. Each
96
experimental condition was analyzed using three wells.
97
98
Measurement of the number of adenoviral genome copies
99
After the virus was harvested, we collected cell pellets and supernatant from each well at 6 h,
100
1, 2, 3, 4, 5, 6, and 7 days post-infection (dpi) (Fig. 1). First, 250 μL of the culture
101
supernatant was sucked by a pipette into a 1.5-mL micro-centrifuge tube “A.” Tube A was
102
centrifuged at 1,500×g for 5 minutes, and then 200 μL supernatant was collected into a new
103
1.5 mL micro-centrifuge tube “B.” The cells that remained in the well were carefully scraped
104
with a cell scraper (TPP) and collected into tube A. We poured 500 μL D-PBS (Wako) into
105
the same well to wash the scraper and well, and then the wash solution was collected in tube
106
A. Tube A was centrifuged at 1500×g for 5 minutes, and the supernatant was discarded. Tube
107
A was preserved as a pellet tube and tube B as a supernatant tube at −80°C until DNA
108
extraction.
109
Before DNA extraction, tube A pellets were mixed well by vortexing with 200 μL D-
110
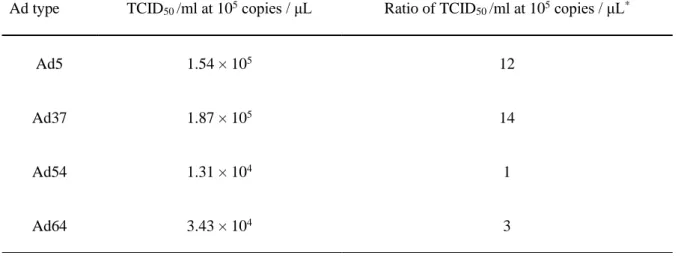
PBS. Tube B contents were used without any further processing. Viral DNA was extracted
111
from 200 μL of each sample using the High Pure Viral Nucleic Acid Kit (Roche). We stored
112
8
the extracted 100 μL of viral DNA at −80°C until PCR. The number of adenoviral genome
113
copies per microliter of pellets was determined using quantitative real-time PCR (qPCR)
114
following a previously described method [14] and the pharyngoconjunctival fever/EKC
115
Diagnostic Manual, 3rd Edition (National Institute of Infectious Diseases,
116
https://www.niid.go.jp/niid/images/lab-manual/adeno_v3.pdf). Briefly, 2 μL of template DNA
117
was added to 18 μL in total containing 10 μL of 2× SYBR Premix Ex Taq II (Takara bio), 0.4
118
μL of 50 × Rox Reference dye II (Takara bio), 0.16 μL of 50 μM concentration of the primers
119
Hex 3 and Hex 4 (Supplemental Table), and 7.28 μL of DW. Real-time PCR was performed
120
using the StepOne real-time PCR system (ABI) (StepOne). The cycling conditions included
121
an initial denaturation step at 95°C for 1 min, followed by 40 cycles of denaturation at 95°C
122
for 5 s, annealing, and extending at 60°C for 30 s. All experiments were repeated three times.
123
124
Virus titration
125
126
Ad virus titers were determined using micro titer plates by three-fold serial dilution of viral
127
stock and inoculation with 100 μL of dilution into each of the 96 wells (TPP) containing a
128
monolayer of A549 cells. Plates were incubated at 34°C with 5% CO2 and observed daily for
129
CPE for seven days. The Spearman–Karber’s method was used to calculate the median tissue
130
culture infective dose (TCID50)/ml [17]. All tests were repeated three times.
131
9 132
Calculation of Ads growth rate
133
134
To compare the speed of viral propagation, growth rate was defined as the intracellular
135
genomic gain of Ad, considered to represent genomic replication in the A549 cells before
136
viral shedding into culture supernatant. The time point just before the virus was released into
137
the supernatant was determined, and then, a straight line was drawn between two additional
138
points: (1) the viral load at that point and (2) the viral load in pellets at 6 h. Specifically, we
139
extracted viral loads in pellets at 6 h and 2 dpi for Ad5, 37, and 64 (Fig. 3A). For Ad54, viral
140
loads in pellets were extracted at 6 h and on 3 dpi. Growth rate was calculated from the slope
141
of the straight line as per the previous study [18]: Growth rate = Δ log viral load / Δ time.
142
Statistical analyses (n = 3) were performed using one-way analysis of variance (ANOVA)
143
followed by Tukey–Kramer post hoc test using Microsoft Excel 2011 (Microsoft) and
144
Statcel4 add-in software (OMS). A p-value <0.05 was considered statistically significant.
145
146
The expression levels of early transcription factor E1 gene per infected cell
147
148
To synthesize cDNA, PrimeScript RT reagent Kit and gDNA Eraser Kit (Takara bio) were
149
used for reverse transcriptions of mRNA and removal of genomic DNA (gDNA). Briefly, 7
150
10
μL of total viral DNA from pellets, 2 μL of 5 × gDNA eraser buffer, and 1 μL of gDNA
151
Eraser were mixed to form a total reaction volume of 10 μL. This solution was incubated at
152
42°C for 2 min to eliminate the gDNA. Ten microliters of reverse-transcription reaction
153
mixture, 4 μL of 5 × PrimeScript Buffer 2, 1 μL of PrimeScript RT Enzyme Mix 1, 1 μL of
154
Oligo dT Primer (50uM) (Takara bio), and 4 μL of RNase Free dH2O were combined and
155
incubated at 37°C for 15 min, followed by 85°C for 5 s, to generate cDNA using a PCR
156
Thermal Cycler Dice (Takara bio). Eighty microliters of TE (pH 8.0) (Wako) were added to
157
cDNA to make a total volume of 100 μL, stored at −20°C until use. The qPCR was performed
158
using a StepOne and SYBR Premix Ex Taq II (Takara bio). Thermocycling was performed in
159
a final volume of 20 μL containing 2 μL of the cDNA sample, 10 μL of 2 × SYBR Premix Ex
160
Taq II, 0.4 μL of 50 × Rox Reference dye II, and 0.8 μL of 10 μM concentration of the each
161
E1 primer (forward and reverse), and 6 μL of distilled water. The E1 primers for qPCR were
162
designed by Primer Express Software v2.0 (ABI). All primers were checked for amplification
163
efficiency, and only primers with equal amplification efficiencies were used in the
164
experiments. PCR amplification was performed using a StepOne, and the cycling conditions
165
were 95°C for 1 min and 40 cycles of 95°C for 5 s and 60°C for 30 s. To account for the
166
number of infected cells per well, the RNase P gene (one copy of which is present in human
167
genomic DNA) was quantified using the ABI TaqMan RNase P Detection Reagents Kit
168
(Thermo Fisher Scientific) and Probe qPCR Mix (Takara bio) on a StepOne. Reactions were
169
11
prepared using 10 μL of Probe qPCR Mix, 1 μL of 20 × RNase P Primer-Probe, 0.4 μL of
170
Rox reference dye, 2 μL of viral DNA of pellets, and 6.6 μL of distilled water. Cycling
171
conditions were 95°C for 20 s and 40 cycles of 95°C for 1 s and 60°C for 20 s. A series of 2
172
serial dilutions of human genomic DNA containing the Kit was used in duplicate to produce
173
the standard curve. The expression levels of E1 gene per infected cell were calculated
174
according to the formula 2- (Ct)/ the number of cells, which were calculated from RNase P.
175
Each experimental condition was analyzed in three wells and repeated three times. Statistical
176
analyses were performed using ANOVA followed by Tukey–Kramer post hoc test using
177
Microsoft Excel 2011 with Statcel4 add-in software. A p-value of <0.05 was considered
178
statistically significant.
179
180
Phylogenetic analysis of the region including promoter of E1 gene and E1 open reading
181
frame (ORF)
182
183
To investigate growth rate delays and E1 expression in Ad54, we compared the E1 upstream
184
sequence, including putative E1 promoter and regulator, and ORF of E1 in Ad related to EKC
185
and Ad5. The genome sequences of Ad5 (AY339865.1), Ad37 (AB448775.1), Ad54
186
(AB333801.2), Ad64 (JQ326307.1), Ad type 8 (Ad8: AB448767.1), and Ad type 56 (Ad56:
187
HM770721.2) were obtained from a public database (GenBank: https:
188
12
//www.ncbi.nlm.nih.gov/nuccore.). The multiple alignments and phylogenetic tree analysis
189
were performed using MEGA 6.0 software (https://www.megasoftware.net/). DNA sequences
190
were aligned using the ClustalW program (http://www.ebi.ac.uk/clustalw/) with an open gap
191
penalty of 15, a gap extension penalty of 6.66, a transition weight of 0.5 with IUB DNA
192
weight matrix, and a delay divergent cutoff of 30%. The neighbor-joining method was used
193
for phylogenetic tree analysis, the reliability of which was assessed by bootstrap resampling
194
(1,000 pseudo-replicates). Kimura’s 2-parameter method was used to calculate genetic
195
distance [19].
196
197
Results
198
199
Viral replication comparisons
200
201
CPE
202
Fig. 2 depicts CPE induced by Ads. Each of the A549 cells infected with Ad5, 37, and 64
203
became enlarged, rounded, and were highly refractile on the third dpi. By 4 dpi, they
204
aggregated into irregular clusters on the well plate bottoms (Fig. 2). A day later, all the cells
205
dispersed from the well plate bottoms and were observed floating in the culture medium. The
206
Ad54 infected cells began to swell on 4 dpi, and clear CPE was confirmed on 5 dpi. Ad5, 37,
207
13
and 64 cells all floated within 24 h, and Ad54 floated within 48 h. Compared to the other
208
types, Ad54 required more dpi (time) for confirmation of CPE. No CPE was observed in the
209
negative control.
210
Comparisons of viral loads of Ad genomic DNAs and TCID50
211
We separately compared the viral loads of Ad genomic DNAs in pellets of A549 cells and
212
supernatant. On 1 dpi, Ad5, 37, and 64 copies increased in the pellets by ~100-fold. The viral
213
copies of these three Ads reached ~10,000-fold (maximum) from initial viral loads within 3
214
dpi (Fig. 3A). On 2 dpi, Ad5, 37, and 64 exhibited viral shedding into the culture supernatant
215
(Fig. 3B). On 2 dpi, the Ad54 viral load in cultured cells reached was ~100-fold of
216
inoculation levels and reached ~10,000-fold of inoculation levels on 6 dpi; however, the
217
levels failed to plateau (maximum) within 7 days. Clear virus shedding into the supernatant
218
was observed on 3 dpi. Compared to the cells infected with other Ads, the viral loading of
219
Ad54 was slower both in the pellets and in supernatant. Table 1 shows the relationships
220
between the viral loads of Ad genomic DNA and TCID50. TCID50 had the lowest viral loads
221
in Ad54.
222
Comparison of Ad growth
223
Intracellular genomic gains occurred on 2 dpi for Ad5, 37, and 64 and on 3 dpi for Ad54 (Fig.
224
3B). The growth rates displayed in Table 2 were calculated using the formula shown in the
225
Methods section. Significant changes in growth rate were observed between Ad54 and the
226
14
other D types (p < 0.01). No significant differences were found between Ad37 and Ad64. The
227
growth rate of Ad54 was significantly lower than those of other types.
228
229
Confirmation of E1 gene expression (Fig. 4)
230
231
Relative expression levels of the Ad54 E1 gene were significantly lower than cells infected
232
with other Ads on 1 dpi and gradually increased on 2 dpi and 3 dpi.
233
234
Phylogenetic analysis of the E1 gene putative promoter and ORF
235
236
DNA sequences of types Ad37 and 64 were phylogenetically closest for both the putative
237
promoter and ORF of the E1 gene. Ad54 was the closest to Ad8. Ad5 was the
238
phylogenetically farthest from Ad54 (Figs. 5A, B).
239
240
Discussion
241
There are no comparative reports with accurate quantification on the propagation of Ad54 ,
242
therefore, we compared the phenotypic proliferative properties of Ad37, 54, and 64, which
243
are the major causes of EKC in Japan. Although Ad8 is a major EKC pathogen globally, it
244
was not included except for the phylogenetic analysis. This was because: (1) the prototype
245
15
strain of Ad8 provided by ATCC was contaminated with Ad type 10 [20] and (2) Ad8 strains
246
may have differences in their propagation speeds among strains [21–23]. The hypothesis
247
about Ad8 strains should be clarified in another paper. To date, no differences in viral
248
propagation among strains, such as Ad8, have been observed in Ad54. A549 was used as the
249
most sensitive cells to isolate Ads, including Ad54 [12, 24, 25]. We inoculated the same
250
amount of each Ad virus at the beginning and separately compared Ad viral loads in pellets
251
with supernatant, the latter was assumed to contain the complete Ad virions [26].
252
Our results produced five major characteristics of Ad54. First, the initiation of CPE
253
and the time required until all the cells show CPE in Ad54 were delayed compared with other
254
Ads (Fig. 2). Second, viral load in pellets and viral shedding in supernatant were slower for
255
Ad54 than for the other types (Figs. 3 a, b, c). Third, the growth rate of Ad54, indicated by
256
intracellular genomic gain, was significantly slower than the other types (Table 2). Fourth, the
257
relationship between Ad54 genomic DNA viral loads and TCID50 was the lowest among the
258
tested types (Table 1). Last, Ad54 was the lowest level on 1 dpi, according to the expression
259
level of the E1 gene per infected cell, which acts as an indirect measure of viral entry (Fig. 4).
260
Slower viral propagation of Ad54 could be (at least partly) due to slow E1
261
expression or slowing of the steps that precede E1 expression. In other words, Ad54 could
262
experience defects during any of the early steps of viral replication: virus adsorption, entry, or
263
E1 gene initiation [27]. Because we detected approximately 105 copies/well of Ad54 DNA
264
16
from the pellet at 6 h after infection, the virus may have been able to adsorb to the host cells.
265
Notably, there was some lag between viral entry and E1 gene transcription initiation in Ad54.
266
We were unable to prove the existence of any defects in viral entry of Ad54. However,
267
assuming no viral entry issues, the delayed E1 gene transcription initiation might have
268
resulted from an E1 gene putative promoter or the ORF of the E1 gene itself.
269
E1 gene expression is directly linked to the growth rate. Therefore, we investigated
270
phylogenetic differences among the Ad viruses for E1 gene promotion. Four complete
271
sequences of Ad54 (AB333801, LC215446, LC215427, and LC215423) were obtained from
272
the NCBI database. The upstream region of E1 and E1 ORF were identical among the strains.
273
The putative promoter and ORF of the Ad54 E1 gene were phylogenetically closest to Ad8
274
(Fig. 5). Ad54 is considered phylogenetically derived from Ad8 [28, 29]. We could not
275
investigate Ad8 in this study; however, the growth rate of Ad8 may be slow [21, 23]. This
276
prediction is consistent with the results of previous reports, in which Ad8 could not be
277
isolated from clinical samples [13, 14].
278
Our results indicate that the slow propagation of Ad54 could have been caused by
279
slow genomic replication resulting from delayed viral entry or E1 transcription initiation that
280
induced an overall delay in genome replication. Slow propagation might be the reason owing
281
to which the viral load did not peak within 7dpi for Ad54.
282
17
Because viral replication in Ad54 was delayed, the latent period may be longer than
283
the typical 8–10 days [30]. Additionally, slow propagation of Ad54 might have prolonged the
284
duration of infection. Furthermore, species D reportedly exhibits slower reductions in the
285
viral genome after infection [2]. Therefore, Ad54 appeared to take long from latency to
286
termination of infection than the other types. Extended duration of the disease can lead to an
287
increase in the chance of infecting others, likely spreading the infection. There is currently no
288
effective treatment for EKC, and when nosocomial infections or a major epidemic occur, the
289
resultant social and economic losses can be substantial [31, 32].
290
Limitation of this study: we used only A549 cells, believed to be the most sensitive
291
cell line for Ads. To verify whether these experimental results can be applied to conjunctival
292
epithelial cells in vitro and in vivo, additional quantitative experiments are required in the
293
future. The experiment for the viral propagation should be performed in the near future for
294
other EKC types of Ad, including prototype Ad8 and recent isolates, such as Ad8, Ad53,
295
Ad56, etc. Because expression level analysis and cell observation imaging were not
296
conducted by sorting only infected cells, the correlation between the expression level of E1
297
and CPE after the virus entered the cell could not be proved in this study. Infection
298
experiments after cell synchronization will be necessary in the future.
299
The slower propagation of Ad54 compared to the other Ads was confirmed kinetically
300
in this study. The results of this study might provide clues to the development of specialized
301
18
countermeasures for each Ad type. Ads are highly contagious and considering that high viral
302
loads are maintained at infection onset [11], more attention is required to prevent the spread
303
of Ad54.
304
Acknowledgements The authors would like to thank Enago (www.enago.jp) for the
305
English language review. This study was partly supported by a Ministry of Health, Labor and
306
Welfare Grant-in-Aid for Scientific Research (10110713). This is a post-peer-review, pre-
307
copyedit version of an article published in Japanese Journal of Ophthalmology. The final
308
authenticated version is available online at: https://doi.org/10.1007/s10384-020-00727-2.
309
Conflicts of interest T. Tsukahara-Kawamura, None; N. Hanaoka, None; T. Fujimoto, None;
310
M. Konagaya, None; E. Uchio, None.
311
312
References
313
1. White DO, Fenner FJ. Adenoviridae. In: Medical Virology. 4th ed. San Diego: Academic
314
Press; 1994. pp. 306–16.
315
2. Robinson CM, Singh G, Lee JY, Dehghan S, Rajaiya J, Liu EB, et al. Molecular evolution
316
of human adenoviruses. Sci Rep. 2013;3:1812.
317
3. Lee CS, Lee AY, Akileswaran L, Stroman D, Najafi-Tago K, Kleiboeker S, et al.
318
Determinants of outcomes of adenoviral keratoconjunctivitis. Ophthalmology.
319
2018;125:1344-53.
320
19
4. Walsh MP, Chintakuntlawar A, Robinson CM, Madisch I, Harrach B, Hudson NR, et al.
321
Evidence of molecular evolution driven by recombination events influencing tropism in a
322
novel human adenovirus that causes epidemic keratoconjunctivitis. PLoS One.
323
2009;4:e5635.
324
5. Hashimoto S, Gonzalez G, Harada S, Oosako H, Hanaoka N, Hinokuma R, et al.
325
Recombinant type Human mastadenovirus D85 associated with epidemic
326
keratoconjunctivitis since 2015 in Japan. J Med Virol. 2018;90:881-9.
327
6. Espínola EE, Barrios JC, Russomando G, Mirazo S, Arbiza J. Computational analysis of a
328
species D human adenovirus provides evidence of a novel virus. J Gen Virol.
329
2017;98:2810-20.
330
7. Kaján GL, Kajon AE, Pinto AC, Bartha D, Arnberg N. The complete genome sequence of
331
human adenovirus 84, a highly recombinant new Human mastadenovirus D type with a
332
unique fiber gene. Virus Res. 2017;242:79-84.
333
8. Ishiko H, Shimada Y, Konno T, Hayashi A, Ohguchi T, Tagawa Y, et al. Novel human
334
adenovirus causing nosocomial epidemic keratoconjunctivitis. J Clin Microbiol.
335
2008;46:2002-8.
336
9. Balasopoulou A, Κokkinos P, Pagoulatos D, Plotas P, Makri OE, Georgakopoulos CD, et
337
al. Α molecular epidemiological analysis of adenoviruses from excess conjunctivitis
338
cases. BMC Ophthalmol. 2017;17:51.
339
20
10. Fujimoto T, Matsushima Y, Shimizu H, Ishimaru Y, Kano A, Nakajima E, et al. A
340
molecular epidemiologic study of human adenovirus type 8 isolates causing epidemic
341
keratoconjunctivitis in Kawasaki City, Japan in 2011. Japanese Journal of Infectious
342
Diseases. 2012;65:260-3.
343
11. Uemura T, Migita H, Ueno T, Tsukahara-Kawamura T, Saeki Y, Fujimoto T, et al. Clinical
344
and virological analysis of epidemic keratoconjunctivitis caused by adenovirus type 54 in
345
a regional ophthalmic clinic in Kyushu, Japan. Clin Ophthalmol. 2018;12:511-7.
346
12. Infectious Agents Surveillance Report. Infectious Disease Surveillance Center, Japan.
347
IASR. 2008;29:346-7. (in Japanese)
348
13. Nakamura N, Hirano E, Kowada K, Ishiguro F, Yamagishi Z, Adhikary AK, et al.
349
Surveillance of adenovirus D in patients with epidemic keratoconjunctivitis from Fukui
350
prefecture, Japan, 1995-2010. J Med Virol. 2012;84:81-6.
351
14. Kaneko H, Suzutani T, Aoki K, Kitaichi N, Ishida S, Ishiko H, et al. Epidemiological and
352
virological features of epidemic keratoconjunctivitis due to new human adenovirus type
353
54 in Japan. Br J Ophthalmol. 2011;95:32-6.
354
15. Fujimoto T, Hanaoka N, Konagaya M, Kobayashi M, Nakagawa H, Hatano H, et al.
355
Evaluation of a silver-amplified immunochromatography kit for adenoviral conjunctivitis.
356
J Med Virology. 2019;91:1030-5.
357
21
16. Zhou X, Robinson CM, Rajaiya J, Dehghan S, Seto D, Jones MS, et al. Analysis of
358
human adenovirus type 19 associated with epidemic keratoconjunctivitis and its
359
reclassification as adenovirus type 64. Invest Ophthalmol Vis Sci. 2012;53:2804-11.
360
17. Lorenz RJ, Bogel K. Methods of calculation: The Spearman-Karber method. WHO
361
Monograph Series. 1973;23:321-9.
362
18. Atabani SF, Smith C, Atkinson C, Aldridge RW, Rodriguez-Peralvarez M, Rolando N, et
363
al. Cytomegalovirus replication kinetics in solid organ transplant recipients managed by
364
preemptive therapy. Am J Transplant. 2012;12:2457-64.
365
19. Kimura M. A simple method for estimating evolutionary rates of base substitutions
366
through comparative studies of nucleotide sequences. J Mol Evol. 1980;16:111-20.
367
20. Yamane S, Lee AW, Hanaoka N, Gonzalez G, Kaneko H, Ishida S, et al. Identification of
368
contamination in the American Type Culture Collection stock of human adenovirus type 8
369
by whole-genome sequencing. J Virol. 2013;87:1285-6.
370
21. Wigand R. Pitfalls in the identification of adenoviruses. J Virol Methods. 1987;16:161-9.
371
22. Guo DF, Shinagawa M, Aoki K, Sawada H, Itakura S, Sato G. Genome typing of
372
adenovirus strains isolated from conjunctivitis in Japan, Australia, and the Philippines.
373
Microbiol Immunol. 1988;32:1107-18.
374
23. Adhikary AK, Ushijima H, Fujimoto T. Human adenovirus type 8 genome typing. J Med
375
Microbiol. 2012; 61:1491-503.
376
22
24. Enomoto M, Fujimoto T, Konagaya M, Hanaoka N, Chikahira M, Taniguchi K, et al.
377
Cultivation for 21 days should be considered to isolate respiratory adenoviruses from
378
samples containing small numbers of adenoviral genomes. Jpn J Infect Dis. 2010;63:338-
379
41.
380
25. Akiyoshi K, Suga T, Fukui K, Taniguchi K, Okabe N, Fujimoto T. Outbreak of epidemic
381
keratoconjunctivitis caused by adenovirus type 54 in a nursery school in Kobe City, Japan
382
in 2008. Jpn J Infect Dis. 2011;64:353-4.
383
26. Badr KR, Parente-Rocha JA, Baeza LC, Ficcadori FS, Souza M, Soares CM, et al.
384
Quantitative proteomic analysis of A549 cells infected with human adenovirus Type 2. J
385
Med Virol. 2019;91:1239-49.
386
27. Yin J, Redovich J. Kinetic modeling of virus growth in cells. Microbiol Mol Biol Rev.
387
2018;82:e00066-17.
388
28. Kaneko H, Aoki K, Ohno S, Ishiko H, Fujimoto T, Kikuchi M, et al. Complete genome
389
analysis of a novel intertypic recombinant human adenovirus causing epidemic
390
keratoconjunctivitis in Japan. J Clin Microbiol. 2011;49:484-90.
391
29. Gonzalez G, Yawata N, Aoki K, Kitaichi N. Challenges in management of epidemic
392
keratoconjunctivitis with emerging recombinant human adenoviruses. J Clin Virol.
393
2019;112:1-9.
394
30. Hierholzer, J.C. Adenoviruses. In: Lennette E.H. et al., editors. Diagnostic procedures for
395
23
viral, rickettsial and chlamydial infections. 7th ed. Washington, DC: American Public
396
Health Association; 1995. pp. 169-88.
397
31. Udeh BL, Schneider JE, Ohsfeldt RL. Cost effectiveness of a point-of-care test for
398
adenoviral conjunctivitis. Am J Med Sci. 2008;336:254-64.
399
32. Piednoir E, Bureau-Chalot F, Merle C, Gotzamanis A, Wuibout J, Bajolet O. Direct costs
400
associated with a nosocomial outbreak of adenoviral conjunctivitis infection in a long-
401
term care institution. Am J Infect Control. 2002;30:407-10.
402
403
Figure legends
404
405
Fig. 1 Methods of collecting cell pellets and supernatant. First, 250 μL of the culture
406
supernatant was sucked by a pipette into a 1.5 mL micro-centrifuge tube A. A was centrifuged
407
at 1,500×g for 5 minutes, and then 200 μL supernatant was collected into a new 1.5 mL
408
micro-centrifuge tube B. The cells that remained in the well were carefully scraped with a
409
cell scraper and collected in tube A. We poured 500 μL D-PBS into the same well to wash the
410
scraper and well, and then the wash solution was collected in tube A. Tube A was centrifuged
411
at 1500×g for 5 minutes, and the supernatant was discarded. Tube A was preserved as a pellet
412
tube and tube B as a supernatant tube within a −80°C refrigerator until DNA extraction
413
414
24
Fig. 2 Cytopathic effects (CPE) of Human mastadenoviruses (Ads) on each day post-
415
infection (dpi). CPEs induced by Ad5, 37, 64, and 54 were photographed using a phase-
416
contrast microscope on 3, 4, 5, and 6 dpi (original magnification, ×200). The cells became
417
enlarged, rounded, and highly refractile in the early stages of CPE. After that, they aggregated
418
into irregular clusters, gathering on the bottoms of well plates (arrows) on 3 dpi for Ad5, 37,
419
and 64. On the other hand, in Ad54, the cell began to swell on 4 dpi, and the clear CPE was
420
recognized on 5 dpi. All the cells floated within 24 h for HAdV5, 37, and 64. Ad 54 required
421
48 h to develop the same kind of microscopic features. The initiation of CPE and the time
422
required until all the cells were impacted by CPE in Ad54 were delayed compared with the
423
other Ads. CPE was not observed in the negative control. N, negative control; Ad, Human
424
mastadenovirus; dpi, Days post-infection. Scale bar: 50 µm
425
426
Fig. 3 The amount of Ads DNA copies and growth rate. The amount of Ads DNA copies in
427
pellets (a), supernatant (b), and total (c) per well post-infection. The viral copies increased
428
~10,000-fold (maximum) within 3 dpi (a). Viral shedding of Ad5, 37, and 64 into the culture
429
supernatant was observed on 2 dpi (b). On the other hand, the viral load of Ad54 in pellets
430
reached ~100-fold of the inoculation levels on 2 dpi, reaching ~10,000-fold by 6 dpi. Ad54
431
exhibited slower viral load increases compared to the other Ad (c). Standard deviations of
432
25
triplicate assays at each time point are indicated by error bars. Abbreviations; Ad, Human
433
mastadenovirus; Dpi, Days post-infection.
434
435
Fig. 4 The E1 gene expression level. mRNA of E1 gene serves as an indirect measure of viral
436
entry for each Human mastadenovirus type 5 (Ad5), 37 (Ad37), 54 (Ad54), 64 (Ad64), and
437
negative control (N), as detected by quantitative real-time PCR on 1, 2, and 3 dpi. The
438
relative E1 gene expression level for Ad54 was significantly lower compared with that of the
439
other Ads on 1 dpi and gradually increased on 2 and 3 dpi. The standard deviations for each
440
time point of the triplicate assays are indicated by error bars. *Significant differences (p <
441
0.05) between Ad54 and all the other Ads by one-way ANOVA followed by the Tukey–
442
Kramer post hoc test. Abbreviations: Ad, Human mastadenovirus; N, negative control; N.D.,
443
not detected; Dpi, Days post-infection
444
445
Fig. 5 Delayed E1 gene transcription initiation Phylogenetic analysis of the E1 upstream
446
region and E1 open reading frame (ORF)
447
Phylogenetic tree of (a) the upstream region, including the E1 putative promoter and
448
regulator and (b) E1 gene among Ads related to EKC. Types Ad37 and 64 were the closest
449
matches and were compared as predictors of Ad54. Ad54 was the closest to Ad8. Ad5 was,
450
26
phylogenetically, the farthest from Ad54. The scale bar shows the number of base
451
substitutions per site.
452
* The length of upstream region is as follows: Ad5:559bp, Ad8:563bp, Ad37:569bp,
453
Ad54:568bp, Ad56:571bp, and Ad64:569bp.
454
# The Ad5 E1 ORF includes several introns and region from 560 to 1545 in AY339865.1.
455
(986bp). The Ad8 E1: ORF includes several introns and region from 564 to 1420 in
456
AY339865.1. (857bp). The Ad37 E1: ORF includes several introns and region from 570 to
457
1426 in AB448775.1. (857bp). The Ad54 E1: ORF includes several introns and region from
458
569 to 1425 in AB333801.2. (857bp). The Ad56 E1: ORF includes several introns and region
459
from 572 to 1422 in HM770721.2. (851bp). The Ad64 E1: ORF includes several introns and
460
region from 570 to 1426 in JQ326207.1. (857bp). Abbreviations; Ad, Human mastadenovirus
461
462
463
464
465
466
467
468
469
27
Table 1 The relationship between viral loads of Ad genomic DNAs and TCID50
470
Ad type TCID50 /ml at 105 copies / μL Ratio of TCID50 /ml at 105 copies / μL*
Ad5 1.54 × 10⁵ 12
Ad37 1.87 × 10⁵ 14
Ad54 1.31 × 10⁴ 1
Ad64 3.43 × 10⁴ 3
Abbreviations: Ad, Human mastadenovirus; TCID50, the median tissue culture infective dose.
*The ratio of TCID50/ml was calculated by setting the TCID50/ml value at 105 copies/μL of Ad54 to 1.
471 472
28 Table 2 Growth rate of each Ads
473
Ad5 Ad37 Ad54 Ad64
0.11* 0.09* 0.05 0.09*
Abbreviations: Ad, Human mastadenovirus.
*Significant differences (p < 0.05) between Ad54 and all the other Ads by one-way ANOVA followed
by the Tukey–Kramer post hoc test.
474
475
476
477 478
479
29 480
481
482 483
484
485
30 486
487
488 489
490
491
31 492
493
494
495
Supplemental Table. The primers used in this study.
Primer name Nucleotide sequence (5'–3') Target region Reference Hex3 GACATGACTTTCGAGGTCGATCCCATGGA Ad5, 37, 64 hexon 3
Fujimoto T, et al.15 Hex4 CCGGCTGAGAAGGGTGTGCGCAGGTA Ad5, 37, 64 hexon 4
Hex3-Ad54 GACATGACCTTTGAGGTGGACCCCATGGA Ad54 hexon 3 Hex4-Ad54 CCGGCGGAGAAGGGCGTGCGCAGGTA Ad54 hexon 4 Ad5_E1F CCAACGAGGAGGCGGTTT
Ad5 E1 This study Ad5_E1R TCCTGCACCGCCAACAT
Ad54_E1_F AATGACACGCCCCTGCAA
Ad54 E1 This study Ad54_E1_R TCTCGCCACTCGGTCTAACC
Ad37, 64_E1_F CCGGGCAAGGCTGTAGATC
Ad37, 64 E1 This study Ad37, 64_E1_R GCGTTTGTGTCTCCGGTCTT
Ad, human mastadenovirus