Availability of Cephalometric Radiographs Constructed from Three- dimensional Computed Tomography: Transration research to three
dimensional from two dimensional
Ryosuke KITA1), Shigeaki MORIYAMA2), Taishi OHTANI1), Hiromasa TAKAHASHI1),Masao TAKAOKA 1) Toshihiro KIKUTA1),
1) Department of Oral and Maxillofacial Surgery, Faculty of Medicine, Fukuoka University
2) Department of Mechanical Engineering, Faculty of Engineering, Fukuoka University
Abstract Purpose
In recent years, diagnosis and evaluation using three-dimensional computed tomography (3D-CT) images provide highly detailed information in orthognathic surgery.
However, evaluations using plain cephalometric radiography also widely utilized. Evaluations would be very simple and straightforward if the aforementioned information could be obtained from a single testing approach. Therefore, we constructed two-dimensional (2-D) cephalometric images based on 3D-CT images, and compared them with conventional cephalometric radiographs.
Subjects and Methods
Standard lateral cephalometric radiographs and 3D-CT images were obtained from a simplified craniomaxillofacial model and a jaw deformity patient. LabView 7.1 (National Instruments, Austin, TX, USA) was used for the construction of 2-D cephalometric images from 3D-CT images. Cephalometric analyses were conducted using WinCeph 9.0 (Rise Corporation, Sendai, Japan), using 5 items for the angle analysis of the model and 22 items for the angle analysis on the patient. The analyses were performed by 7 evaluators, and correlation coefficients involving all measured values were calculated on the basis of the 2-D cephalometric images constructed from 3D-CT and conventional cephalometric radiography. Additionally, Wilcoxon-signed rank test was used for the comparison between each corresponding measured value.
Conclusion
In the simplified craniomaxillofacial model, significant differences were found in all 5 tems. In our patient with jaw deformity, significant differences were found in 4 items, including convexity, SNA, the mandibular Plane (Pl) to SN(Serra-Nasion), and the gonial angle. This study revealed that the 2-D cephalometric images constructed from 3D-CT images showed stronger correlations than those found in conventional cephalometric radiography.
Key words:Cephalometric radiography, 2-D cephalometric images constructed from 3D-CT images, Craniomaxillofacial simplification model, 3-D bone shapes, Hypothetical (virtual) X-rays
Correspondence to : Ryosuke KITA, DDS., Department of Oral and Maxillofacial Surgery, Faculty of Medicine, Fukuoka University, 7-45-1 Nanakkuma, Jonan-ku, Fukuoka, 814-0180 Japan
Tel:+81-92-801-1011x3537 Fax:+81-92-801-1044 E-mail:[email protected]
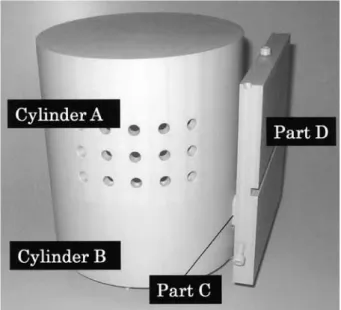
Fig. 1 Simplified craniomaxillofacial model
Fig. 2 Simplified craniomaxillofacial model Introduction
I n 1931, Broadbent1) a nd Hof rat h2) descr ibed an analy tical procedure[t wo - dimensional(2 -D)
cephalometry analysis]using standard radiographs of the head(cephalometric radiographs). This period represented the dawn of an important method for use during the growth and developmental stages of the craniomaxillofacial region, in the orthodontic treatment of jaw deformities, and in the evaluation of maxillofacial surgery3). Subsequently, in the field of orthodontics, this method was used as a standardized method for evaluations conducted before and after orthodontic treatment. In orthodontic treatments, 2-D cephalometry analysis is an essential method for diagnosis, establishment of the treatment plan, conducting treatment follow-ups, and for evaluation of the prognosis. However, analyses using traditional cephalometric radiography were limited by the fact that three-dimensional (3-D) structures were represented in 2-D images4). In recent years, diagnosis and evaluation using 3D-computed tomography (CT)
images, which provide highly-detailed and accurate information, have been utilized in orthognathic surgery for cases in which the condition of the skeleton before and after surgery is known. Analyses using 3D-CT images have also been reported to have the same accuracy and reliability as those of conventional cephalometry5-8).
Therefore, in this study, we constructed 2-D cephalometric images from 3D-CT images, and designed a comparative study between 3D-CT and conventional cephalometric radiography. Our method makes it possible to create various types of simple craniomaxillofacial radiographs
(such as cephalometric radiographs, frontal facial images, zygomatic images, and images of the mandibular axis) from 3D-CT images. This study focused on lateral cephalometric radiographs; we validated our approach for constructing 2-D cephalometric images based on 3D-CT images by using a simplified craniomaxillofacial model and a patient.
Subjects and Methods
Simplified model and jaw deformity patient
The study was conducted on a simplified model of the craniomaxillofacial bone and a patient with a typical jaw deformity. Since the craniomaxillofacial model (Fig. 1 and 2) was created with the processing
precision required for the verification of accuracy, the configuration needed to be simplified; therefore, it was constructed with a cylindrical and rectangular morphology similar to a simplified version of the shape of the craniomaxillofacial bone. The simplified craniomaxillofacial model was composed of 4 blocks, and was set to the assumed width, diameter, and major axis of a human craniomaxillofacial bone. The inside of the model was hollowed out in order to reproduce the cortical bone. The material was comprised of polyvinyl chloride with radiopaque properties. Cylinder A corresponded to the maxillary and craniomaxillofacial bones, cylinder B corresponded to the proximal mandibular bone fragment, part C corresponded to the moving portion of the bone, and part D corresponded to the distal bone fragment. The movements of the model made it possible to conduct translational and rotational
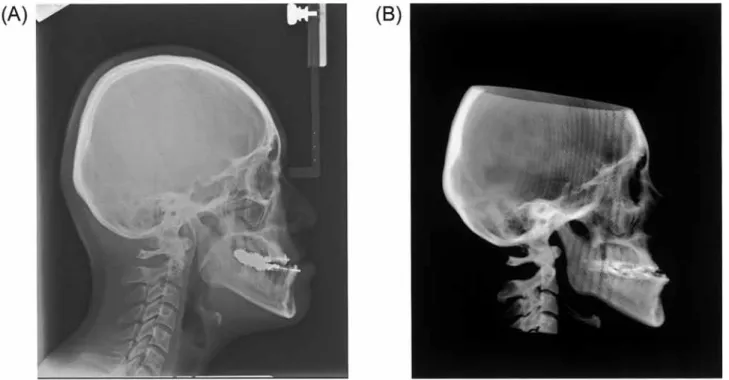
Fig. 3 Cephalometric radiograph of Smplified craniomaxillofacial model.
(A) Conventional cephalometric radiograph
(B) 2-D cephalometric image constructed from 3DCT movements, assuming vertical movements as well as
right-and-left movements of the bone fragment during surgery. Cylinder A was fixed and immovable. Cylinder B was set to be capable of rotational movements with intervals of 15° relative to cylinder A. Part D was set to be capable of translational movements by using part C as the connecting site. In this study, images were taken while cylinder B was in a 30° rotation and part D was moved by 0 mm. An ear rod insertion unit was placed on the model in order to take pictures during cephalometric radiography. As a representative case of jaw deformity, the patient who was chosen for this study had a typical skeletal mandibular prognathism and skeletal maxillary retrusion, and had been examined by cephalometric radiography and 3D-CT scan before undergoing surgery while being hospitalized at the Department of Oral and Maxillofaciall Surgery at Fukuoka University Hospital.
The Ethics Committee at Fukuoka University Hospital reviewed and approved the present study.
Radiography
X-ray apparatus (AZ3000CM; Asahi Roentgen, Co., Ltd., Kyoto, Japan) was used for taking pictures during cephalometric radiography (conditions under which radiography was conducted: tube voltage, 75 kV; tube current, 10 mA). For the simplified craniomaxillofacial model, ear rods were inserted, horizontality with the ground was confirmed by using a horizontality measurement device, and the pictures were taken. For
the typical jaw deformity patient, radiographs were taken while ensuing that the Frankfort horizontal (FH)
plane was horizontal to the ground as under normal circumstances. Each radiograph was then converted into film.
For the X-ray CT, an Aquillion 64 DAS (Toshiba Medica l Systems I nc., Tok yo, Japa n) was used
(conditions under which radiography was conducted:
tube voltage, 120 kV; tube current, 130 mA; gantry tilt angle, 0°; slice thickness, 0.5 mm). The simplified craniomaxillofacial model was placed on a bed, and pictures were taken after confirmation of its center by using a guide light. In order to suppress any shaking due to the movements of the bed, low repulsion sponges were used. For the jaw deformity patient, the images were taken in the centric occlusal position while the patient was placed in the standard supine position (Fig.
3 and 4).
Imaging methods
The image data obtained from CT were saved as Digital Imaging and Communications in Medicine
(DIC OM) for m at f i les . L abV iew 7.1 (Nat iona l Instruments, Austin, T X, USA) was used for the construction of 2-D cephalometric images from 3D-CT images. Based on the 3D-CT images that were obtained, 3-D bone shapes composed of multiple gray-scale voxels were constructed; the 3-D bone shapes were arranged
Fig. 4 Cephalometric radiograph of jaw deformity patient.
(A) Conventional cephalometric radiograph
(B) 2-D cephalometric image constructed from 3DCT
Fig. 5 Cephalometric radiograph methods reproduced on PC (image).
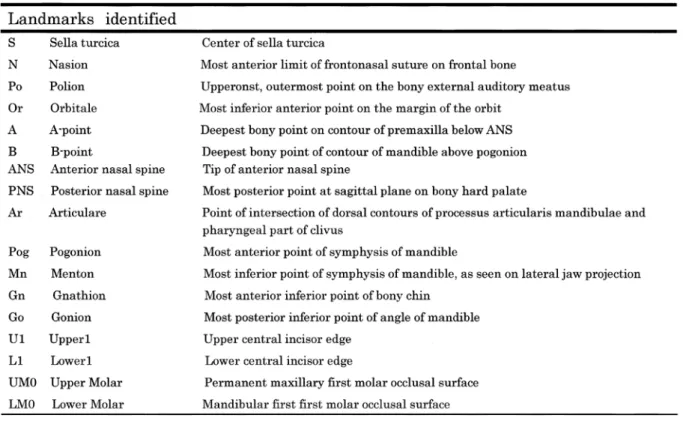
Table 1 Landmarks in Jaw deformity patient on the basis of posture and arbitrary position in space,
and the 2-D images were constructed by projecting hypothetical X-rays9). Pixel values were calculated by integrating the CT values of the voxels during the passage of the virtual X-rays irradiating from the light source inside the 3-D voxels. Next, after image matching was performed manually, X-ray images under all conditions were created by moving the images in the x, y, and z directions at the range of ± 2 mm every 0.25 mm, and by rotating the images at a range of ± 2° around the x, y, and z axes every 0.25°. For image matching, the absolute values of the differences between pixel values in the hypothetical X-ray images and cephalometric radiographic images were calculated. Images in which the calculated values were the smallest were considered to be the images with the greatest overlap, and were subjected to analysis (Fig. 5). Cephalometric analysis and image management were performed using WinCeph 9.0 (Rise Corporation, Sendai, Japan). Cephalometric radiographic films were scanned with a precision of 300 dpi (scanner: Sierra Vidar Systems, Nevada City, CA, USA). The landmarks were identified on a computer by 7 dentists with 3 or more years of clinical experience after graduation from university.
Methodology comparison using the simplified craniomaxillofacial model
The rationale for using a simplified craniomaxillofacial model was that a model with highly accurate dimensions and angles was required for the comparison of images obtained from plain radiographs and CT. Therefore, we primarily used the right angle of models with a known angle. The measurement items consisted of 5 items from the angle analysis. The landmarks were identified to 8 points consisting of A, B, C, D, E, F, G, and H (Fig. 6). The landmarks were identified by importing images into WinCeph 9.0. First, the examiners identified the landmarks on the basis of the cephalometric radiographs; one week later, a similar identifying of landmarks was performed by using 2-D cephalometric images constructed from 3D-CT images.
Methodology comparison performed on the typical jaw deformity patient
Twenty-two items commonly used in hard tissue angle analyses were used as measurement items (Table 1). Seventeen landmarks were identified, including S, N, Po, Or, Point A, Point B, ANS, PNS, Ar, Pog, Mn, Gn, Go, U1, L1, UM0, and LM0 (Table 2). Since data pertaining to hard tissue were used in this study, soft
Fig. 6 A - H: Landmarks identified Angle a - e: Measurement degree
Table 2 Cephalometric variables in this study tissues were excluded. In the same manner as with the
simplified craniomaxillofacial model, the landmarks were identified by importing images into WinCeph 9.0.
First, the identifying of landmarks on cephalometric
radiographs was performed; 1 week later, the examiners identified the landmarks by using 2-D cephalometric images constructed from 3D-CT images.
Statistical analysis
Correlation analyses were performed by using the 2-D cephalometric images constructed from 3D-CT images and cephalometric radiographs of the simplified craniomaxillofacial model and the jaw deformity patient.
Correlation coefficients involving all numeric values in the measurement results of to each item were calculated.
Standard deviations (SD) were determined in order to examine the variability of the landmarks. The SD was calculated as the square root of the variance. In addition, the comparison of each corresponding analytical value was performed by using the Wilcoxon signed-rank test.
The Statistical Package for the Social Sciences (SPSS;
SPSS Inc, Chicago, USA, Version 20) was used as the analysis software.
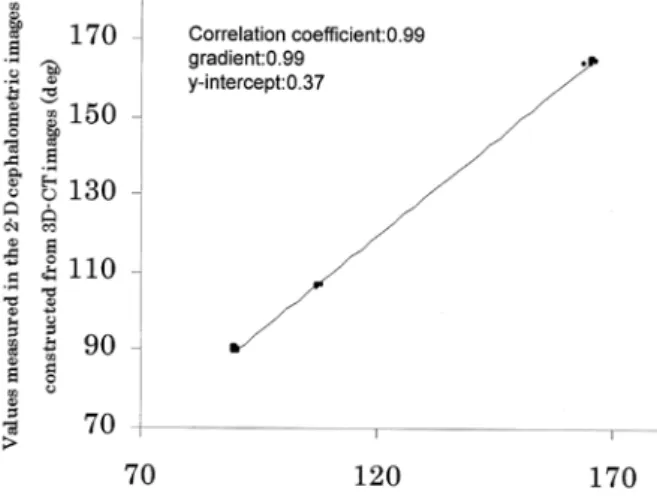
Fig. 7 Correlation diagram of Simplified craniomaxillofacial model
Fig. 8 Correlation diagram of Jaw deformity patient Table 3 Average and standard deviation and corresponding
p-value from conventional cephalometric radiograph a nd 2 - D c epha lomet r ic i m a ge f rom 3D - C T i n craniomaxillofacial simplification model.
Results
Simplified craniomaxillofacial model
In the simplified craniomaxillofacial model, the correlation coefficient was 0.99 (gradient, 0.99; y-intercept, 0.37) in all measurement results. The Angle a, the cephalometric radiographic analysis item, showed a mean value of 165.5°. In 2-D cephalometric images constructed from 3D-CT images, the Angle a was 164.7°, which was virtually distributed on a regression line. Likewise, the Angle b was distributed on the regression line.
Regarding Angle c, Angle d, and Angle e, right angles were measured; therefore, the angles were in the vicinity of 90° of the 2-D cephalometric images constructed from 3D-CT images and cephalometric radiographs, respectively, on the regression line. As shown in Table 3, the mean values in the different images were found to be close to each other, and the SD of each measured value was low. The Wilcoxon signed-rank test showed significant differences in all 5 analysis items (Fig. 7, Table 3).
Typical jaw deformity patient
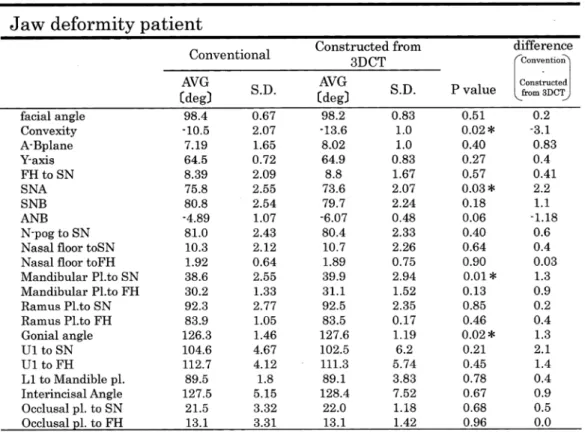
In the jaw deformity patient, the correlation coefficient was 0.99(gradient, 0.99; y-intercept, - 0.18)in all measurement results, revealing a particularly strong correlation. All points in the correlation diagram were distributed around the regression line. The comparison of each analytical value showed a significant difference in the 4 following items: Convexity, SNA, Mandibular
Pl. to SN, and the Gonial angle. In these 4 items, the differences in the mean values found in the 2-D cephalometric images constructed from 3D-CT and cephalometric radiography were ± 1° or higher; hence, the difference was larger than that found in the other values. For U1(Upper 1) to SN, U1 to FH(Frankfult- Horizontal), and the Interincisal angle, the SD was 4° or higher, and the analytical values showed a large variability. The variability of the Interincisal angle was also evident in the correlation diagram. In addition, the SD was 3° or higher in the 2-D cephalometric images constructed from 3D-CT images in the case of the L1
(Lower 1) to mandible plane, and from cephalometric radiographs in the case of the Occlusal plane to SN and the Occlusal plane to FH (Fig. 8, Table 4).
Table 4 Average and standard deviation and corresponding p-value from conventional cephalometric radiograph and 2-D cephalometric image from radiograph constrcted 3D-CT in jaw deformity patient.
Discussion
C o m p a r a t i ve s t ud i e s b e t we e n c o n ve nt i o n a l cephalometric radiographs and 2-D cephalometric images constructed from 3-D data have previously been reported10 -13). While methods using CT scanograms obtained from multi-slice CT10), techniques consisting of creating semi-transparent images constructed from 3D-CT data11), and methods using software from cone- beam CT12) have been described, there has been no report of computer-based creation and construction of 2-D cephalometric images from 3D- C T images by reproducing the conditions of cephalometric radiography. The present study compared conventional cephalometric radiographs with 2-D cephalometric images constructed from 3D-CT images by using an original program; this is also an original study that examined the availability of images constructed by using the aforementioned method.
Three items, namely (a) the position of the head during the imaging procedure, (b) tracing, and (c)
measurements and analysis, can be listed as the main cause of errors occurring in conventional cephalometric radiographic analysis. In this study, tracing (b) was not
performed; therefore, the position of the head during the imaging procedure (a) and measurements and analysis
(c) were examined. The reproduction of the position of the head through the use of ear rods is usually relatively difficult and has great impact on preoperative and postoperative evaluations. In this study, the conversion of 3D-CT images into 2-D images consisted of pasting a cephalometric radiograph onto a projection plane in a computer, arranging the constructed 3D-CT images in random positions and postures, and projecting virtual
(hypothetical) X-rays9). Pixel values were calculated by integrating the C T values of the voxels during the passage of the virtual X-rays irradiating from the light source inside the 3-D voxels. Next, after image matching was performed manually, X-ray images under all conditions were created by moving the images in the x, y, and z directions and by rotating them around the x, y, and z axes. During image matching, the absolute values of the differences between pixel values in the cephalometric radiographs and 2-D cephalometric images constructed from 3D-CT images were calculated.
Images in which the calculated values were the smallest were subjected to analysis. By using this method, 2-D images can be constructed, regardless of the position of
the head. If the cephalometric radiographic images are not pasted onto the surface of the projection plane, 2-D images can be constructed by setting the center line of the radiation to pass through the right and left external auditory meatuses.
There has been a previous report of cephalometric radiographs based on an originally created model14;
the purpose of the study was to per form lateral cephalometric radiography on the model and to elucidate the geometric features of the images. Therefore, in our study, there was a need to create a model that would meet the requirements of our purposes. The requirements pertaining to the model used in this study were (a) that cephalometric radiography can be performed under the same conditions as in clinical settings, and (b) that the model thickness takes into consideration a radiolucency which can be distinguished from the site of penetration to the opposite side. In the present study, a strong correlation was found between the results of measurements using cephalometric radiography on a simplified craniomaxillofacial model and those conducted on 2-D cephalometric images constructed from 3D-CT images (correlation coefficient, 0.99; gradient, 0.99; y-intercept, 0.37). Significant differences (P < 0.05) were found in all 5 measurement items, but the mean values were nearly the same, and the SD was low, suggesting that the measurements could be applicable in clinical settings as well.
The reliability and errors of the landmarks used in conventional cephalometric radiographic analysis have been reported in various experiments and statistical data15-26).
Regarding the maxillary bone, the ANS (anterior nasal spine) has a very thin bone tissue structure that allows X-rays to be transmitted through it; thus, its anteroposterior position is likely to be unclear and indistinct. Furthermore, the ANS have various forms, and ideal images are can be difficult to obtain27-29). The PNS( posterior nasal spine) has a narrow tip, and in the majority of cases, it has a sharp shape; thus, the determination of the sagittal position can be difficult.
Regarding point A, the lipping of the actual image may be shown in posterior position due to erroneous setting on the line of the alveolar border of the labial side of the anterior teeth, or due to the thin bones at the intermaxillary suture27, 28, 31). According to a previous report by Trokova et al.32), point A has a high degree of
accuracy in the vertical direction. In this study, as a point related to the maxillary bone, it showed statistically significant differences in convexity and SNA. Since both measurement items included point A, the identifying of horizontal landmarks by the examiners was regarded as difficult.
In this study, point A was used in the following analysis items: Convexity, A−B plane, SNA, and ANB.
The 2-D cephalometric images constructed from 3D- CT images of these 4 items showed lower SD values than those found in cephalometric radiographs. This is likely to be due to the fact that the information provided by the 2-D cephalometric images constructed from 3D- CT images involved exclusively hard tissues, and was unlikely to be influenced by surrounding factors such as soft tissues; as a result, point A was easy to determine.
Regarding the mandibular bone, when point B is observed on a dry skull from above and from a frontal view, and when there are prominences on both sides of the point located in the center, the prominences could be mistaken as landmarks, resulting in erroneous settings30). With regard to Pog, there can be a mismatch between the landmarks if the anterior prominence of the chin is flat, and if the midline is concave30).
W ith regard to the landmarks composing the reference planes, it is often difficult to set the Or
(composing the FH plane) for the measurement of the middle point from the right and left infraorbital margins.
In addition, Po is likely to become indistinct since the external auditory canal runs in a superoanterior direction from the external auditory meatus, and its direction is slightly different from that of the X-rays.
For N, which composes the SN-plane, estimations are difficult, as it tends to be set slightly posterior to the nasofrontal suture. In addition, the setting this measurement can be challenging when the height of the nasal bone on the left differs from that on the right 30, 31).
The statistically significant differences found in the mandibular Pl. to SN measurement was likely due to the difficulty in performing the setting of N. Measured values using N include SNA, SNB, and ANB. Significant differences in SNA were actually found. Although the measured values of ANB showed a difference of-1.18, no significant difference was found. In addition, N was used in the SN plane; measurement items that involved the SN plane included FH to SN, N-Pog to SN, nasal floor to SN, ramus Pl. to SN, and occlusal Pl. to SN, but no significant differences were found. McCure et
al.33) and Liu et al.34) previously reported that N was a relatively reliable point, both horizontally and vertically.
These facts suggest that the setting of the mandibular plane had a greater influence than that of N. The issue regarding SNA is also likely due to point A.
Similar to Mandibular Pl. to SN, the Gonial angle also uses the andibular plane. Since no significant difference in Ramus Pl. to SN was found, it was also likely influenced by the setting of the mandibular plane.
Regarding the mandibular plane, the bisector of the tangent lines between the right side and the left side is used when there is a mismatch between them; however, our findings suggested that the setting of the bisector might have been inaccurate. The items that involved the teeth were the U1 to SN, U1 to FH, Interincisal angle, Occlusal plane to SN, and the Occlusal plane to FH. Regarding the U1 to SN, which is associated with the tooth axis of the mandibular central incisor, the SD was 4.67 in the cephalometric radiographs, and 6.2 in the 2-D cephalometric images constructed from 3D-CT images. As for the U1 to FH, the SD was 4.12 in the cephalometric radiographs, and 5.74 in the 2-D cephalometric images constructed from 3D- CT images. Regarding the interincisal angle, the SD was 5.15 in the cephalometric radiographs, and 7.52 in the 2-D cephalometric images constructed from 3D- CT images. These results showed that distinction of a upper central incisor was difficult. A comparison of the SD in the 2 images showed that the SD was higher in the 2-D cephalometric images constructed from 3D- CT images. The same was found in the L1 to mandible plane. This was likely due to a partial volume effect 35); when multiple substances are included in 1 pixel, the CT values are averaged, and sites that originally have high CT values become unclear. In this study, the fact that the teeth became unclear was due to the presence of various substances of different CT values, such as teeth, bones, and orthodontic appliances. Based on these results, it can also be assumed that in the setting of the maxillary and mandibular first molars, the positions were unclear and the settings were difficult.
T he present study was a comparative study of measurement results f rom convent iona l latera l cephalometric radiographs and 2-D cephalometric images constructed from 3D-CT images, using a simplified craniomaxillofacial model and a patient with typical jaw deformity. In the simplified craniomaxillofacial model, significant differences were found, and the mean values
found in the cephalometric radiographs and the 2-D cephalometric images constructed from 3D-CT images were very close to each other; these values posed no major problem in terms of the practical use of cephalometric analysis. For the typical jaw deformity patient, our findings demonstrated that since the soft tissues had been removed and the data pertained to exclusively hard tissues, identifying the landmarks was relatively straightforward.
The findings of this study indicated that the 2-D cephalometric images constructed from 3D-CT images showed a much stronger correlation than that found in conventional lateral cephalometric radiographic images. These findings showed that in the future, 2-D cephalometric images constructed from 3D-CT images could be as useful of materials as lateral cephalometric radiographs. The use of this method makes it possible to create images in which the upper edges of the right and left external acoustic meatus match each other; this method is beneficial because there is no need to set the position of the head. The disadvantage of this method is that the pixels are rough, although this technique can be applied to any part of the human skeleton, and the clinical usefulness of these findings should prospectively increase.
Conclusion
We projected virtual (hypothetical) X-rays to 3-D bone shapes constructed on the basis of 3D-CT images, and constructed cephalometric images by using this method designed for the construction of 2-D images.
The study was conducted on a simplified model of the craniomaxillofacial bone and on a patient with jaw deformity (skeletal maxillary retrusion and skeletal mandibular prognathism). The availability of 2-D cephalometric images constructed from 3D-CT images was examined by conducting a comparative study of 2-D cephalometric images constructed from 3D-CT images and conventional cephalometric radiographs, by using cephalometric analysis. The results of the present study suggested that 2-D cephalometric images constructed from 3D-CT images showed a markedly stronger correlation than conventional cephalometric radiographs, indicating that this method was clinically useful.
References
1. Broadbent BH. A new x-ray technique and its
application to orthodontics. Angle Orthod 11: 45-66, 1931.
2. Hofrath H. Importance of the recording x-ray and distance for the diagnosis of jaw abnormalities.
Fortschr Orthod 1: 231-258, 1931.
3. Athanasiou AE (Ed.). Orthodontic cephalometry.
London: Mosby Wolfe: 1997.
4. Van Der Meij A. Reliability and reproducibility of the landmarks of posteroanterior cephalometry. Master Thesis. Aarhus: The Royal Dental College, 1997.
5. Papadopoulos MA, Jannowitz C, Boettcher P, et al.
Three-dimensional fetal cephalometry: an evaluation of the reliability of cephalometric measurements based on three-dimensional CT reconstructions and on dry skulls of sheep fetuses. J Craniomaxillofac Surg 33: 229, 2005.
6. Swennen GR, Schutyser F, Barth EL, et al. A new method of 3-D cephalometry. Part I: the anatomic Cartesian 3-D reference system. J Craniofac Surg 17:
314, 2006
7. Swennen GR, Schutyser F. Three-dimensional cephalometry: spiral multi-slice vs. cone-beam computed tomography. Am J Orthod Dentofacial Orthop 130, 2006.
8. Kragskov J, Bosch C, Gyldensted C, Sindet-Pedersen S. Comparison of the reliability of craniofacial anatomic landmarks based on cephalometric radiographs and three-dimensional CT scans. Cleft Palate Craniofac J 34: 111, 1997.
9. Shiraishi Y, Higaki H, Shimoto T. Motion analysis of the natural knee during a deep flexion. Japanese J Clin Biomechanics 30: 215-221, 2009.
10. Chidiac JJ, Shofer FS, Al-Kutoub A. Comparison of CT scanograms and cephalometric radiographs in craniofacial imaging. Orthod Craniofac Res 5: 104- 113, 2002.
11. A raki M, K awamat a A . 3D - C T 3D Computed Tomographic Cephalometric Analysis: Orthodontics for Clinicians. YearBook 99, Quintessence Publishing Co, 51-56, 1999.
12. v a n V l ij men OJC , B ergé S J, S wen nen GR J.
Comparison of cephalometric radiographs obtained from cone-beam computed tomography scans and conventional Radiographs. J Oral Maxillofac Surg 67: 92-97, 2009.
13. Damstra J, Fourie Z, Ren Y. Comparison between two-dimensional and midsagittal three-dimensional cephalometric measurements of dry human skulls.
Br J Oral Maxillofac Surg 49: 392-395, 2011.
14. Nishimura N. Evaluation of three-dimensional images to improve cephalometric radiography. The Journal of the Gifu Dental Society 30: 26-139, 2003.
15. Hayashi M. St udies on er rors in set t ing the landmarks on lateral cephalogram tracings. Nihon Univ Dent J 65: 431-438, 1991.
16. Richardson A. An investigation into the reproducibility of some points, planes and lines used in cephalometric analysis. Am J Orthod 52: 637-651, 1966.
17. Baumrind S, Frantz RC. The reliability of head film measurements. Am J Orthod 60: 111-127, 1971.
18. Broch J, Slagsvold O, Rosler M. Error in landmark identification in lateral radiographic headplates. Eur J Orthod 3: 9-13, 1981.
19. Stabrun AE, Danielsen K. Precision in cephalometric landmark identification. Eur J Orthod 4: 185-196, 1982.
20. P h i l l i p s C , G r e e r J , V i g P, M a t t e s o n S . Photocephalometr y: errors of projection and landmark location. Am J Orthod 86: 233-243, 1984.
21. Buschang PH, Tanguay R, Demirjian A. A full ANOVA model for the estimation of true and error variance. Angle Orthod 57: 168-175, 1987.
22. Savage AW, Show fet y K J, Yancey J. Repeated measures analysis of geometrically constructed and directly determined cephalometric points. Am J Orthod Dentofacial Orthop 91: 295-299, 1987
23. Major PW, Johnson DE, Hesse KL, Glover K E.
Landmark identification error in posterior anterior cephalometrics. Angle Orthod 64: 447-454, 1994.
24. Kusnoto B, Evans CA , BeGole EA , de R ijk W.
Assessment of 3-dimensional computer-generated cepha lomet r ic measurements. A m J Or t hod Dentofacial Orthop 116: 390-399, 1999.
25. Lim KF, Foong KW. Phosphor-stimulated computed cephalometry: reliability of landmark identification.
Br J Orthod 24: 301-308, 1997.
26. Bruntz LQ, Palomo JM, Baden S, Hans MG. A comparison of scanned lateral cephalograms with corresponding original radiographs. Am J Orthod Dentofacial Orthop 130: 340-348, 2006.
27. Iizuka T, Ishikawa F. Setting of Measurement Points in Roentgenographic (X-ray) Cephalometry. The Journal of the Japan Orthodontic Society 16: 66-75, 1957.
28. Iizuka T. Series: Crucial points in Radiography. Part 3: The Clinical Significance of X-ray Cephalometry.
The Nippon Dental Review 409: 99-108, 1976.
29. Iizuka T. Applications and Current Status of X-ray Cephalometry. Dental Outlook 25: 627-636, 1965.
30. Koyama S. Studies on Measurement Points in Cephalometric Radiography. Volume 1: Adults, Shikagakuhou 72: 1417-1435, 1972.
31. Ishikawa F. Different Measurement Points referred to with the Same Name in the Facial Skull. Journal of the Japanese Association for Dental Science 6: 28-33, 1980.
32. Trpkova B, Major P, Prasad N, Nebbe B. Cephalometric landmarks identification and reproducibility: a meta analysis. Am J Orthod Dentofacial Orthop 112: 535-
540, 1997.
33. Liu JK, Chen YT, Cheng KS. Accuracy of computerized automatic identification of cephalometric landmarks.
Am J Orthod Dentofacial Orthop 118: 535-540, 2000.
34. Scott R, McClure P, Sadowsky L. Reliability of digital versus conventional cephalometric radiology: a comparative evaluation of landmark identification error. Semin Orthod 11: 98-110, 2005.
35. Yuasa K. Computed tomography (CT). In: Furumoto K, Okano T, Kobayashi K ed.: Dental radiology, Fourth edition, Ishiyaku Publishers, Inc., 2006, pp122-129.
(平成25.7.10受付,平成25.10.10受理)