Microbial fuel cell biosensor for the
determination of biochemical oxygen demand of wastewater samples containing readily and
slowly biodegradable organics
Author Gabor Mark Tardy, Balint Lorant, Miklos Gyalai‑Korpos, Vince Bakos, David Simpson, Igor Goryanin
journal or
publication title
Biotechnology Letters
volume 43
number 2
page range 445‑454
year 2020‑11‑27
Publisher Springer Nature
Rights (C) 2020 The Author(s).
Author's flag publisher
URL http://id.nii.ac.jp/1394/00001805/
doi: info:doi/10.1007/s10529-020-03050-5
Creative Commons Attribution 4.0 International(https://creativecommons.org/licenses/by/4.0/)
O R I G I N A L R E S E A R C H P A P E R
Microbial fuel cell biosensor for the determination of biochemical oxygen demand of wastewater samples containing readily and slowly biodegradable organics
Ga´bor Ma´rk Tardy
.
Ba´lint Lo´ra´nt.
Miklo´s Gyalai-Korpos.
Vince Bakos.
David Simpson.
Igor GoryaninReceived: 17 April 2020 / Accepted: 15 November 2020 / Published online: 27 November 2020 ÓThe Author(s) 2020
Abstract
Objectives
Single-chamber air cathode microbial fuel cells (MFCs) were applied as biosensors for biochemical oxygen demand (BOD) measurement of real wastewaters with considerable suspended and/or slowly biodegradable organic content.
Results
The measurement method consists of batch sample injection, continuous measurement of cell voltage and calculation of total charge (Q) gained during the biodegradation of organic content. Diverse
samples were analyzed: acetate and peptone samples containing only soluble readily biodegradable sub- strates; corn starch and milk samples with suspended and colloidal organics; real domestic and brewery wastewaters. Linear regression fitted to the Q vs.
BOD
5measurement points of the real wastewaters provided high (
[0.985) R
2values. Time requirement of the measurement varied from 1 to 4 days, depend- ing on the composition of the sample.
Conclusions
Relative error of BOD measured in the MFCs comparing with BOD
5was less than 10%, thus the method might be a good basis for the development of on-site automatic BOD sensors for real wastewater samples.
Electronic supplementary material The online version of this article (https://doi.org/10.1007/s10529-020-03050-5) con- tains supplementary material, which is available to authorized users.
G. M. Tardy (&)B. Lo´ra´ntV. Bakos
Department of Applied Biotechnology and Food Science, Budapest University of Technology and Economics, Szt.
Gelle´rt te´r 4., Budapest 1111, Hungary e-mail: [email protected]
B. Lo´ra´nt
e-mail: [email protected] V. Bakos
e-mail: [email protected] M. Gyalai-Korpos
Pannon Pro Innovations Ltd., P.O.B 41, Budapest 1400, Hungary
e-mail: [email protected] M. Gyalai-Korpos
BES Europe Ltd, 39 Mura´nyi u., Budapest 1078, Hungary
D. SimpsonI. Goryanin
Okinawa Institute of Science and Technology, 1919-1 Tancha, Onna-Son, Kunigami-gun, Okinawa 904-0495, Japan
e-mail: [email protected] I. Goryanin
e-mail: [email protected] I. Goryanin
School of Informatics, University of Edinburgh, 10 Crichton str., Edinburgh EH8 9AB, UK
I. Goryanin
Tianjin Institute of Industrial Biotechnology, 32 West 7th Avenue, Tianjin Airport Economic Area, Tianjin 300308, China
Biotechnol Lett (2021) 43:445–454 https://doi.org/10.1007/s10529-020-03050-5(0123456789().,-volV)( 0123456789().,-volV)
Keywords
Biochemical oxygen demand Biosensor Microbial fuel cell Wastewater characterization
Introduction
In microbial fuel cells (MFCs), the chemical energy of biodegradable organics can be converted directly to electricity through the metabolism of exoelectrogenic bacteria. The generated electricity can be measured and/or utilized (Rabaey and Verstraete
2005). Apromising perspective for the application of this technology is to create MFC-based biosensors for the detection and measurement of biodegradable organics and/or toxic materials in water or wastewater (Yang et al.
2015; Lo´ra´nt et al.2019).One of the most important parameters for the characterization of polluted water/wastewater samples is biochemical oxygen demand (BOD). With the main aim of simplifying the standard respirometry-based BOD
5measurement and reducing its time requirement of 5 days, numerous researches have been carried out recently to develop MFC-based BOD measurement methods (Spurr et al.
2018; Do et al.2020).In MFC biosensors, prompt assessment of BOD can be attempted based on the Monod-type relationship between the generated current and the actual biodegradable organic content in the anolyte (Lo´ra´nt et al.
2019). The result of this measurement method,however, refers only to the soluble readily biodegrad- able content, as the slowly biodegradable suspended organic fraction of real wastewaters needs consider- able time (several hours to few days) to be hydrolyzed and biodegraded (Henze et al.
2015; Do et al.2020;How et al.
2020). To take this fraction into consider-ation, total charge (Q) gained by the elimination of substrates has to be calculated within a longer time- frame (typically few hours to few days) of the biodegradation. Q was found to be in linear relation- ship with the BOD
5concentration (Liu et al.
2018;Wang et al.
2018). Although Q derived BOD mayinvolve the measurement of suspended slowly biodegradable substrate content, most of the related references investigated basically soluble, readily biodegradable substrates (e.g. Wang et al.
2018; Gaoet al.
2020). To our knowledge, MFC-based measure-ment of real wastewater samples with highly variable
suspended organic content has not yet been evaluated in details, although it is a crucial point in the practical application of MFC BOD biosensors.
In the current research, single-chamber air cathode MFCs were applied as BOD sensors. The main aims of the research were: (1) to determine the relationship between the total charge and BOD
5for artificial wastewater samples with variable suspended slowly biodegradable organic content; (2) to verify the accuracy and reliability of the developed method by the investigation of real wastewater samples.
Materials and methods
MFC architecture and inoculation
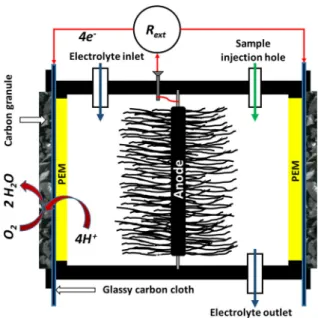
Three identical cubic-shaped single-chamber air cath- ode MFCs were applied as biosensors, with an inner volume of 230 cm
3(see Fig.
1). 10 cm diametergraphite brushes (made of Zoltek 3505015T-13 fiber) were used as anode. Porous ceramic plates with ion exchange polymer in the pores were used as proton exchange membranes (PEM). The air cathodes con- tained 25 ml of biomass-originated carbon granules, connected to the PEM through a conducting glassy carbon cloth layer with an interface of 48 cm
2. More
Fig. 1 Scheme of the applied single-chamber air cathode microbial fuel cells (Rext external resistance, PEM proton exchange membrane)
detailed description of the cells including basic performance characteristics can be found in our previous publication (Lo´ra´nt et al.
2019).The electrolyte inlet and outlet were positioned on the opposite side of the anode chamber to facilitate its rinsing with a standard (substrate free) electrolyte. The flow was provided by a MasterflexÒ peristaltic pump.
The composition of the standard electrolyte was as follows: 3.13 g NaHCO
3l
-1, 0.31 g NH
4Cl l
-1, 0.13 g KCl l
-1, 4.22 g NaH
2PO
4l
-1, 6.93 g Na
2-HPO
4*12 H
2O l
-1(based on Oh et al.
2004). Asealable sample injection hole was placed on the top of the anode chamber. The external circuit included the adjustable resistance and a data collection device (Graphtec midi logger GL840 oscilloscope).
The MFCs were inoculated with diluted primary settled sludge from domestic wastewater treatment plant (South-pest WWTP), with sodium acetate sub- strate in 40 mM concentration. Within a 2 weeks long inoculation period applying 1000
Xexternal resis- tance, the voltage increased and stabilized at 0.5–0.6 V in each cell. Having the voltage reached its maximum plateau, the inoculating suspension was washed out with standard electrolyte, and 1 month of startup period was carried out using acetate substrate (40 mM) to reach stable operation prior to measurements.
Basic sample quality measurements
BOD
5measurements and chemical oxygen demand (COD) measurements were carried out according to international standards (APHA
1999). In case ofsamples with considerable suspended organics con- tent, dissolved COD concentrations (COD
D) were also determined besides total COD. Preparation of samples for COD
Dmeasurement was carried out by floccula- tion using ZnSO
4and consequent filtration as described by Mamais et al. (1993).
Applied substrate materials
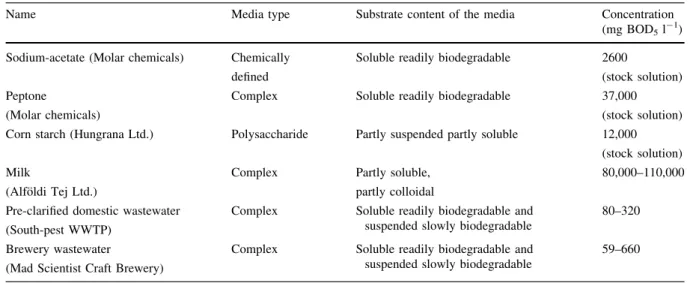
In order to investigate the reliability, evaluate and adapt the measurement with MFC biosensors to real wastewaters, series of samples containing substrates with different complexity and solubility were inves- tigated (see in Table
1).Sample preparation of investigated materials were as follows:
– Acetate and Peptone (soluble substrates): stock solution was prepared and diluted to the desired concentrations by water before injection.
– Corn starch (partly suspended polysaccharide):
stock suspension was prepared by suspending and stirring corn starch in water while heating it up to
*80
°C for 10 min to hydrate and partlydissolve the polysaccharide content. The stock suspension was diluted to the desired concentra- tion by water prior to injection. COD and COD
Dmeasurements showed, that in average
*20% of the sample’s total COD content was in dissolved form, while the rest was in suspended form.
– Milk (soluble and colloidal organic content):
commercial milk was diluted with water before injection.
– Domestic and brewery wastewaters (soluble, col- loidal and suspended organic content): Before the injection, some of the original wastewater samples were diluted by water in order to cover a wide BOD
5concentration range (59–660 mg BOD l
-1), enabling the calculation of an appropriate Q vs.
BOD
5correlation. Detailed analytics of real wastewaters are summarized in Supplementary Table 1.
Procedure of the BOD measurement using MFC biosensors
Before each measurement, anode chambers of the cells were rinsed with 0.7 l of standard electrolyte to ensure the biodegradable substrate free state in the cell. Once the rinsing finished, the electrolyte flow was stopped and sample injection procedure started: before the introduction of the sample, equal volume of anolyte was vented from the MFCs, then the anode chamber was filled up with the sample by automatic pipette, and the measurement started. During method development it was revealed that the favorable amount of biodegradable organics introduced to the anodic chamber should be below 40 mg in BOD
5to result in an acceptable measurement time (
\4 d) and above 4 mg to enable an accurate measurement. Thus, the amount of the introduced substrate was adjusted: the volume of the injection was 4 ml in case of artificial samples and 60 ml in case of real wastewaters with lower initial BOD
5concentrations (see Table
1).Biotechnol Lett (2021) 43:445–454 447
During experiments with acetate, external resis- tance (R
ext) was set to 400
Xas polarization curves suggested the maximum power output at that value.
All other cases R
extwas set to 100
Xto enhance the rate of biodegradation. During measurement, voltage on the external resistor was registered in every 5 min by the data collection device. At the beginning, voltage increased rapidly and generally reached a plateau. After some time (depending on the amount and quality of the sample), the voltage began to decrease as a result of substrate depletion. The end- point of the measurement was defined as a discrete voltage value determined during the development of the method (0.02 V in case of real wastewater samples and 0.05 V in case of all other samples). At these cutoff points the substrates were considered to be practically depleted.
Knowing the external resistance, current was calculated by Ohm’s law, and the current vs. time in the measurement time frame was numerically inte- grated as described by Eqs. (1,
2). The total chargeobtained from biodegradation was calculated and compared with the BOD
5value of the sample:
I¼ U Rext
ð1Þ
Q¼ Z te
ts
I dt ð2Þ
where I is the current in the external circuit (A), U is the voltage (V) measured on the external resistance (R
ext,
X), Q is the total charge (C) flown through theexternal circuit during the measurement, t
s(s) is the starting time of the experiment, t
e(s) is the end time of the measurement. During the whole research, three identical MFCs were operated in parallel, referred in the paper as MFC ‘‘A’’, ‘‘B’’ and ‘‘C’’. Coulombic efficiencies were calculated from Q and the known COD values of the samples, based on Logan (2008).
Results and discussion
Verification of the measurement procedure with acetate substrate
Figure
2a shows the voltage vs. time curves withdifferent amounts of acetate, proving that the mea- surement reproduced the results of similar studies (Modin and Wile´n
2012; Wang et al. 2018) in theapplied cells.
*0.01 V of substrate-free baseline of the voltage (related to endogenous respiration) was measured by maintaining 3 days long substrate-free state in the anode chambers. To shorten the measure- ment time, however, the end-point was considered to be 0.05 V. This consideration was based on the concentration dependence of the voltage in the cells (Lo´ra´nt et al.
2019), which suggested that at 0.05 Vpotential on the 400
XR
ext, the remaining readily
Table 1 Origin and description of the materials investigated in the MFCsName Media type Substrate content of the media Concentration
(mg BOD5l-1) Sodium-acetate (Molar chemicals) Chemically
defined
Soluble readily biodegradable 2600
(stock solution) Peptone
(Molar chemicals)
Complex Soluble readily biodegradable 37,000
(stock solution) Corn starch (Hungrana Ltd.) Polysaccharide Partly suspended partly soluble 12,000
(stock solution) Milk
(Alfo¨ldi Tej Ltd.)
Complex Partly soluble,
partly colloidal
80,000–110,000
Pre-clarified domestic wastewater (South-pest WWTP)
Complex Soluble readily biodegradable and suspended slowly biodegradable
80–320
Brewery wastewater
(Mad Scientist Craft Brewery)
Complex Soluble readily biodegradable and suspended slowly biodegradable
59–660
biodegradable substrate concentration in the anode chamber is as low as
*0.08 mg BOD
5l
-1. As a result, the measurement time was shortened by
*12–24 h, still practically representing the complete biodegradation. Figure
2b shows that the calculatedtotal charge values give good linear correlation with the BOD
5values of the samples: coefficient of determination (R
2) is higher than 0.99 in each MFC.
Small standard deviation and relative standard
deviation (SD = 0.64; RSD = 8.0%) were found with the calibration line slopes of different MFCs. Coulom- bic efficiencies (CE) in the cells A, B and C were found to be 57%, 46% and 62% in average, with RSD below 10% in each cell, similar to the results of Wang et al. (2018).
With the applied 400
XR
ext, the average substrate elimination rate was
*0.23 mg BOD
5l
-1h
-1with 5.2 mg introduced BOD
5. In order to accelerate the biodegradation of the substrates, R
extwas reduced to 100
X. Due to this adjustment, the substrate elimina-tion rate was increased considerably by 35%, from 0.23 to 0.31 mg BOD
5l
-1h
-1with the same amount of BOD
5spiked. At the same time, maximum voltage plateau remained above 0.25 V, still enabling reliable measurement. Thus, 100
XR
extwas used in further experiments.
Evaluation of measurements with complex artificial media samples
On Fig.
3Q vs. injected BOD
5correlations of three different complex artificial substrates (peptone solu- tion, starch suspension, diluted milk) are depicted for the three MFCs. With the investigated substrates, linear correlations provided very high (
[0.97) R
2values in each cell. The slopes of calibration lines of the three MFCs proved to be similar with every substrate. Slope averages together with SD and RSD data, as well as the coulombic efficiency averages with similar statistical evaluation are summarized in Table
2. The low SD (B0.4) and RSD (
\5%) values suggest that practically the same Q vs. introduced BOD
5calibration can be applied for MFCs with identical design and inoculation.
For the readily biodegradable soluble substrate of peptone, high (75.8%) coulombic efficiency was observed. The COD derived coulombic efficiency obtained for the corn starch samples containing large amount of suspended organics was considerably lower (48.3%), indicating that a larger part of the suspended content was not biodegraded in the measurement by exoelectrogenic metabolism. The slope of the Q vs.
injected BOD
5correlation, however, is similar to those obtained with peptone (8.62 and 8.25, respectively, see Table
2). This suggests that similar fraction ofstarch suspension was biodegraded in the standard BOD measurement as in the MFC, which makes the two measurement comparable. Samples prepared with
Fig. 2 aVoltage vs. time curves with different amounts ofintroduced acetate (given in mg BOD5) in MFC ‘‘A’’;blinear correlation of the total charge (Q) values vs. introduced acetate in mg BOD5for each MFC (error bars = standard deviation of Q, n = 3–5)
Biotechnol Lett (2021) 43:445–454 449
milk provided higher (64.2%) CE, with similarly low SD and RSD values. At the same time, the calculated average slope values of the linear regressions were very close to each other (8.62, 8.25, 9.02 C mg
-1BOD
5for peptone, corn starch and milk, respectively), with RSD
\5%. The time requirement of the mea- surements was 0.5–4 days depending on the injected amount of substrate. Based on these results it can be suggested that the BOD
5value of samples containing suspended biodegradable organics (* 80% of the corn starch sample’s organic content) and/or colloidal complex substrates (e.g. the fat content of milk) can be reliably measured with the described method in the MFC biosensors.
Evaluation of measurements with real wastewater samples
11 pre-clarified domestic wastewater samples and 10 brewery wastewater samples were investigated in the three MFCs (see Supplementary Table 1). As the biodegradable organic concentration of real wastew- ater samples were orders of magnitude lower than the applied stock solutions of the previously investigated artificial samples (see in Table
1), the injection volumewas set to 60 ml (instead of 4 ml), to reach the applicable range of injected BOD
5from 4 to 40 mg.
The composition of the domestic and the brewery wastewater (Supplementary Table 1) was consider- ably different: average COD
D/COD ratio of the domestic wastewater was 0.32, while that of the brewery wastewater was 0.63. Thus, larger part of the domestic wastewater’s organic content was in sus- pended form (presumably slowly biodegradable, based on Choi et al. (2005)), while the organic content of the brewery wastewater was predominantly in soluble (presumably readily biodegradable) form.
The typical shape of the voltage vs. time curve was different with the two wastewaters, as it is depicted on Fig.
4, comparing two samples with similar amount ofinjected BOD
5. The ‘‘two step’’ shape of the curves obtained with domestic wastewater has to be high- lighted: it can be suggested that the first peak belongs to the biodegradation of soluble readily biodegradable
bFig. 3 Linear correlation of the total charge values vs.
introduced mg BOD5 in case of a peptone; b corn starch;
cmilk, for each MFC (error bars = standard deviation, n = 3–5)
substrates, while the following low-potential ‘‘shoul- der’’ belongs to the hydrolysis and the consequent biodegradation of the suspended, slowly biodegrad- able compounds. This suggestion can be verified by comparing the curves of the original domestic wastewater samples with the same sample filtered before injection (not containing the suspended organ- ics). The ‘‘two step’’ shape of the voltage vs. time curve is in accordance with the Activated Sludge Models (Henze et al.
2015) describing the biodegra-dation of the organic fractions of wastewaters. Most of the previous researches focused on samples without considerable suspended organic content (Modin and Wile´n
2012; Commault et al.2016; Wang et al.2018;Gao et al.
2020), and to our knowledge, this ‘‘twostep’’ characteristics of the voltage curve has not yet been described in the literature. As brewery wastew- ater contained biodegradable organics mainly in dissolved form, voltage peak supposedly related to the elimination of readily biodegradable organics was considerably wider than in case of domestic wastew- ater, and ‘‘two step’’ characteristics of the curve was not observed (see Fig.
4).As the average potential of the ‘‘shoulder’’ obtained in the measurement of domestic wastewater samples was
*0.05 V in general, the previously determined 0.05 V cutoff boundary had to be reduced to ensure the measurement of the slowly biodegradable fraction.
Therefore, the cutoff point with real wastewaters was considered to be the time when the potential fell to 0.02 V (two times higher than the 0.01 V baseline). In a previous research (Gao et al.
2020) the cutoff pointof a similar measurement in dual chamber MFCs was determined by the maximum voltage drop. This method, however, proved to be appropriate only for the investigation of soluble substrates. The fixed 0.02 V cutoff potential resolves the problem of measurements with real wastewater samples.
The Q vs. BOD
5correlation obtained for domestic and brewery wastewater samples proved to be linear with high (C 0.97) R
2values (see Fig.
5a, b). As therelative differences were lower than 4% between the slopes of the correlation lines obtained for domestic and brewery wastewaters and the average value (Supplementary Table 2), it can be suggested to use one unified calibration for the two different wastew- aters (see Fig.
5c). The R2values of these unified linear correlations are higher than 0.985. It means that by applying the described method, two wastewater types with considerably different composition can be appropriately measured with the same calibration line.
The intersections of the unified linear regressions were 18.9 mg BOD
5l
-1in average, with 11% RSD. This derives from the fact, that with real wastewater samples below
*20 mg BOD l
-1concentration,
Table 2 Slope averages (C mg-1BOD5) of the linear correlations of total charge (Q) vs introduced BOD5, and coulombic efficiency (CE) averages obtained for the three cells with standard deviation and relative standard deviation valuesSubstrate Slope SD RSD (%) CE (%) SD RSD (%)
Peptone 8.62 0.36 4.1 75.8 9.59 12.6
Corn starch 8.25 0.31 3.7 48.3 4.96 10.3
Milk 9.02 0.40 4.4 64.2 6.00 9.3
Fig. 4 Typical shape of the voltage vs. time curve for domestic and brewery wastewaters obtained from the measurement of samples D3 and B6 (Supplementary Table 1). Dashed black line:
0.05 V cutoff potential previously applied for artificial samples;
Solid black line 0.02 V cutoff potential applied for real wastewater samples. Purple dashed line stands for the result obtained in MFC ‘‘A’’ for the sample D3 filtrated before the measurement
Biotechnol Lett (2021) 43:445–454 451
the developed method does not produce voltage values higher than 0.02 V to calculate with, therefore this concentration can be considered as the limit of detection.
Depending on the concentration of the injected samples, the time requirement of the measurements varied from 0.5 to 4 days (see Supplementary Table 1).
This is considerably longer than the 5–17.5 h obtained by Commault et al. (2016) in MFCs with 1 ml volume.
Response time can be reduced by decreasing the size of the cell, however, it has its drawbacks: (1) due to possible inhomogeneity, the standard deviation of measurements originated from the sampling of liquid containing suspended solids can be very high when the sample volume is small, i.e. few milliliters (Rieger et al.
2010); (2) below 1 d measurement time thebiodegradation of the suspended organics content is not ensured. MFC measured BOD (BOD
MFC) con- centrations were calculated from Q values by the obtained calibration. Comparing the BOD
MFCvalues with the BOD
5concentrations (measured by standard respirometric method) of the samples, the difference was less than 10% in average.
Conclusion
Single-chamber air cathode microbial fuel cells were applied as biosensors for the determination of BOD of real wastewaters. Artificial sample series containing complex, suspended and colloidal organics (e.g. corn starch, milk) provided linear correlations with R
2[0.97 for Q vs. injected BOD
5, proving that besides soluble readily biodegradable substrates, the applied measurement method is appropriate for the determination of suspended and colloidal substrate content as well.
With the adapted method, two types of wastewaters (domestic, brewery) with significantly different com- position can be measured using the same linear Q vs.
BOD
5calibration (R
2[0.985). The relative error of
bFig. 5 Linear correlation of the total charge values vs. BOD5 concentrations (mg l-1) of real wastewater samples obtained with the developed measurement, applying the 0.02 V cutoff voltageadomestic wastewater;bbrewery wastewater;ccom- bined correlation for brewery and domestic wastewaters (circles: domestic ww; triangles: brewery ww)
BOD values determined with the MFCs related to the BOD
5concentrations measured by standard respirom- etry method was less than 10%. As most single- chamber air cathode MFC designs require little maintenance and the sampling/rinsing steps can be easily automated based on the measured voltage signal, it can be suggested that this technology with the developed measurement method provides a promising candidate for on-site automatic BOD sensors.
Characteristics of the voltage vs. time curves obtained for domestic wastewater contains a higher voltage peak supposedly related to the biodegradation of readily biodegradable soluble substrates, and a lower voltage (* 0.05 V) ‘‘shoulder’’ presumably belonging to the hydrolysis and consequent biodegra- dation of suspended slowly biodegradable organics.
Thus, not only quantitive analysis of domestic wastewaters can be carried out with the developed method, but possibly the determination of soluble readily biodegradable and suspended slowly biodegradable substrate ratio as well. Further research is required in this matter.
Acknowledgements The valuable work of Noe´mi Petrovai, Rebeka Sipos and Ga´bor Kova´cs BSc students is highly acknowledged. The research was supported by the Higher Education Excellence Program (FIKP) of the Ministry of Human Capacities (EMMI) within the frame of Biotechnology research area at Budapest University of Technology and Economics (BME FIKP-BIO) and by the New National Excellence Program of the Ministry for Innovation and Technology (U´ NKP-19-3).
Supporting information Supplementary Table 1—Compo- sition of the domestic and brewery wastewater samples mea- sured in the MFC sensors (CODD= dissolved COD; BODin= amount of BOD5(in mg) injected to the anode chamber of the cells).
Supplementary Table 2—Data and analysis of the linear regression parameters of the Q vs. BOD5correlation for real wastewaters.
Funding Open access funding provided by Budapest University of Technology and Economics.
Open Access This article is licensed under a Creative Commons Attribution 4.0 International License, which permits use, sharing, adaptation, distribution and reproduction in any medium or format, as long as you give appropriate credit to the original author(s) and the source, provide a link to the Creative Commons licence, and indicate if changes were made.
The images or other third party material in this article are included in the article’s Creative Commons licence, unless indicated otherwise in a credit line to the material. If material is
not included in the article’s Creative Commons licence and your intended use is not permitted by statutory regulation or exceeds the permitted use, you will need to obtain permission directly from the copyright holder. To view a copy of this licence, visit http://creativecommons.org/licenses/by/4.0/.
References
APHA - American Public Health Association (1999) Standard methods for the examination of water and wastewater, 20th edn. APHA - American Public Health Association, Washington, D.C.
Choi EH, Klapwijk B, Mels A, Brouwer H (2005) Evaluation of wastewater characterization methods. Water Sci Technol 52:61–68
Commault AS, Lear G, Bouvier S, Feiler L, Karacs J, Weld RJ (2016) Geobacter-dominated biofilms used as ampero- metric BOD sensors. Biochem Eng J 109:88–95
Do MH, Ngo HH, Guo W, Chang SW, Nguyen DD, Liu Y, Varjani S, Kumar M (2020) Microbial fuel cell-based biosensor for online monitoring wastewater quality: a critical review. Sci Total Environ.https://doi.org/10.1016/
j.scitotenv.2019.135612
Gao Y, Yin F, Ma W, Wang S, Liu Y, Liu H (2020) Rapid detection of biodegradable organic matter in polluted water with microbial fuel cell sensor: method of partial coulombic yield. Bioelectrochemistry.https://doi.org/10.
1016/j.bioelechem.2020.107488
Henze M, Gujer W, Mino T, van Loosedrecht M (2015) Acti- vated Sludge Models ASM1, ASM2, ASM2d and ASM3.
IWA Publishing, London
How SW, Sin JH, Wong SYY, Lim BP, Aris AM, Ngoh GC, Shoji T, Curtis TP, Chua ASM (2020) Characterization of slowly-biodegradable organic compounds and hydrolysis kinetics in tropical wastewater for biological nitrogen removal. Water Sci Technol 81:71–80
Liu Y, Tuo AX, Jin XJ, Li XZ, Liu H (2018) Quantifying biodegradable organic matter in polluted water on the basis of coulombic yield. Talanta 176:485–491
Logan BE (2008) Microbial fuel cells. Wiley, Hoboken, NJ Lo´ra´nt B, Gyalai-Korpos M, Goryanin I, Tardy GM (2019)
Single chamber air–cathode microbial fuel cells as biosensors for determination of biodegradable organics.
Biotechnol Lett 41:555–563
Mamais D, Jenkins D, Prrr P (1993) A rapid physical-chemical method for the determination of readily biodegradable soluble COD in municipal wastewater. Water Res 27:195–197
Modin O, Wile´n BM (2012) A novel bioelectrochemical BOD sensor operating with voltage input. Water Res 46:6113–6120
Oh S, Min B, Logan BE (2004) Cathode performance as a factor in electricity generation in microbial fuel cells. Environ Sci Technol 38:4900–4904
Rabaey K, Verstraete W (2005) Microbial fuel cells: novel biotechnology for energy generation. Trends Biotechnol 23:291–298
Biotechnol Lett (2021) 43:445–454 453
Rieger L, Taka´cs I, Villez K, Siegrist H, Lessard P, Vanrol- leghem PA, Comeau Y (2010) Data reconciliation for wastewater treatment plant simulation studies-planning for high-quality data and typical sources of errors. Water Environ Res 82:426–433
Spurr MWA, Yu EH, Scott K, Head IM (2018) Extending the dynamic range of biochemical oxygen demand sensing with multi-stage microbial fuel cells. Environ Sci Water Res 4:2029–2040
Wang Y, Liu X, Wang M, Zhang P, Zong Y, Zhang Q (2018) A single-chamber microbial fuel cell for rapid determination
of biochemical oxygen demand using low-cost activated carbon as cathode catalyst. Environ Technol 39:3228–3237 Yang H, Zhou M, Liu M, Yang W, Gu T (2015) Microbial fuel cells for biosensor applications. Biotechnol Lett 37:2357–2364
Publisher’s Note Springer Nature remains neutral with regard to jurisdictional claims in published maps and institutional affiliations.