九州大学学術情報リポジトリ
Kyushu University Institutional Repository
Characterization of progenitors for mouse fetal Leydig cells
井上, 実紀
http://hdl.handle.net/2324/4060011
出版情報:九州大学, 2019, 博士(理学), 課程博士 バージョン:
権利関係:
Characterization of progenitors for mouse fetal Leydig cells
Miki Inoue
Laboratory of Biology of Sex Differences Division of Medical Molecular Cell Biology
Graduate School of Systems Life Sciences Kyushu University
2020
List of abbreviation
a-MEM a-modified Eagle’s medium Acta2 actin a2
Actb b-actin
Ad4BP/SF-1 Ad4 binding protein/steroidogenic factor 1 ALC adult Leydig cell
Aldoa aldolase A
Amh anti-Müllerian hormone Arx aristaless related homeobox
CEL-Seq2 Cell expression by linear amplification sequencing 2 ChIP-seq chromatin immunoprecipitation-sequence
Col15a1 collagen, type XV, a1
COUP-TFII chicken ovalbumin upstream promoter transcription factor II Cyp11a1 cholesterol side chain cleavage P450
Cyp11b1 11b-hydroxylase P450
Cyp17a1 17a-hydroxylase/17,20-lyase P450 Cyp21a1 21-hydroxylase P450
DAPI 4’6’-diamidino-2-phenylindole
DAVID Database for Annotation, Visualization and Integrated Discovery
Dcn decorin
Ddx4 DEAD box polypeptide 4 DEG differentially expressed gene Dhh desert hedgehog
Dlk1 delta-like 1 homolog
DMEM Dulbecco’s modified Eagle’s medium
DMSO dimethyl sulfoxide
E embryonic day
ECAR extracellular acidification rate Ednra endothelin receptor type A
EGFP enhanced green fluorescent protein
Eno1 enolase 1
ERCC External RNA Controls Consortium Erra estrogen-related receptor a
FACS fluorescence-activated cell sorting FBS fetal bovine serum
Fgf9 fibroblast growth factor 9 FLC fetal Leydig cell
FLE fetal Leydig enhancer
FPKM fragments per kilobase of transcript per million mapped fragments Gapdh glyceraldehyde 3-phosphate dehydrogenase
Gli1 GLI-Kruppel family member GLI1 Gli2 GLI-Kruppel family member GLI2 Gli3 GLI-Kruppel family member GLI3
GO Gene Ontology
Gpi1 phosphoglucose isomerase 1
Hes1 hes family bHLH transcription factor 1
Heyl hairy/enhancer-of-split related with YRPW motif-like
Hk1 hexokinase 1
Hk2 hexokinase 2
Hsd17b3 17b-hydroxysteroid dehydrogenase type 3 Hsd3b 3b-hydroxysteroid dehydrogenase
Hsd3b1 3b-hydroxysteroid dehydrogenase type 1
Hummr hypoxia up-regulated mitochondrial movement regulators Idh3g isocitrate dehydrogenase 3g
Insl3 insulin-like 3
Jag1 jagged 1
Jund jun D proto-oncogene
KD knockdown
KEGG Kyoto Encyclopedia of Genes and Genomes Kras kirsten rat sarcoma viral oncogene homolog Lsp1 lymphocyte specific 1
M-MLV Moloney Murine Leukemia Virus Mash1 mammalian achaete-scute homolog 1 Mfap2 microfibrillar-associated protein 2 Mfap4 microfibrillar-associated protein 4
Mgarp mitochondria localized glutamic acid rich protein Mgp matrix Gla protein
mRNA-seq mRNA-sequencing
NADPH nicotinamide adenine dinucleotide phosphate Ndufs8 NADH: ubiquinone oxidoreductase core subunit S8
Nes nestin
OCR oxygen consumption rate Osap ovary specific acidic protein OXPHOS oxidative phosphorylation PBS phosphate-buffered saline PCA principal component analysis Pdgf platelet-derived growth factor
Pdgfra Pdgf receptor a Pdgfra Pdgf receptor b
Pecam1 platelet/endothelial cell adhesion molecule 1 Pgam1 phosphoglycerate mutase 1
Pgk1 phosphoglycerate kinase 1 Pkm pyruvate kinase, muscle
Pod1 E-box binding transcription factor PPP pentose phosphate pathway PS penicillin and streptomycin Ptch1 patched 1
Ptch2 patched 2
qRT-PCR quantitative RT-PCR Rn18s 18S ribosomal RNA
S-EGFP strongly EGFP-labeled cells SAG smoothened agonist
scRNA-seq single-cell RNA-sequencing
Sdha succinate dehydrogenase complex, subunit A SEM standard error of the means
siRNA small interfering RNA
Smo smoothened
Sox9 SRY-box 9
Srebf2 sterol regulatory element binding factor 2 Sry sex-determining region of the Y chromosome Star steroidogenic acute regulatory protein
Suclg2 succinate-coenzyme A ligase, b subunit
t-SNE t-distributed stochastic neighboring embedding
TCA cycle tricarboxylic acid cycle Tmsb10 thymosin b10
Tmsb4x thymosin b4x
Tpi1 triosephosphate isomerase 1
UCSC University of California Santa Cruz UMI unique molecular identifier
Uqcr10 ubiquinol-cytochrome c reductase, complex III subunit X W-EGFP weakly EGFP-labeled cells
Wnt4 wingless-related MMTV integration site 4
Table of Contents
ABSTRACT 12
INTRODUCTION 14
MATERIALS AND METHODS
Preparation of EGFP-labeled cells by FACS 19
Immunocytochemistry 19
In vitro testis reconstruction with cells prepared by FACS 20
Immunofluorescence analyses 21
mRNA-sequencing (mRNA-seq) and data processing 22
qRT-PCR analyses 23
Library preparation for single-cell RNA-sequencing (scRNA-seq) according to Cell expression by linear amplification sequencing 2 (CEL-Seq2) 24
Data analysis of single-cell transcriptomes 25
Measurement of extracellular acidification rate (ECAR) and oxygen
consumption rate (OCR) 26
Small interfering RNA (siRNA) treatments 26
Luciferase reporter gene assay 27
Analyses of genomic sequences 28
RESULTS
W-EGFP cells possibly containing FLC progenitors 29 Biological pathways activated in S-EGFP cells 30 Biological pathways activated in W-EGFP cells 35 Expression of genes related to growth factor signaling 36 scRNA-seq of interstitial cells in fetal testes 37
Possible candidate for FLC progenitors 38 Expression of steroidogenic and metabolic genes in the five clusters 40 Expression of marker genes in the five clusters 41
Unique expression of Tmsb10 42
Possible implication of Tmsb10 into FLC differentiation 44 Possible implication of Tmsb10 into DHH signaling 45 Activation of Ad4BP/SF-1 gene transcription by Gli 45 Implication of Tmsb10 into Gli1 gene expression 47
Regulation of primary cilia by Tmsb10 48
DISCUSSION
Characterization of fetal Leydig progenitor cell population 49 FLC progenitors characterized by transiently expressed genes 50 Possible implication of Tmsb10 into DHH signaling to activate
FLC differentiation 52
Activation of metabolism during differentiation of FLCs 53
Activation of Ad4BP/SF-1 expression by Gli 56
REFERENCES 57
ACKNOWLEDGEMENTS 79
LIST OF FIGURES
Fig. 1, Structure and cellular components of a fetal testis 80 Fig. 2, S-EGFP and W-EGFP cells prepared from the fetal testes of
FLE-EGFP mice 81
Fig. 3, Differentiation of S-EGFP to W-EGFP cells in
reconstructed testes 82 Fig. 4, Comparison of gene expression between S-EGFP, W-EGFP,
and Sertoli cells 83
Fig. 5, Steroidogenic and metabolic gene expression activated in
S-EGFP cells 84
Fig. 6, Expression of genes involved in steroidogenesis in S-EGFP
and W-EGFP cells 85
Fig. 7, Expression of genes involved in glycolysis and TCA cycle
in S-EGFP and W-EGFP cells 86
Fig. 8, Expression of genes involved in OXPHOS in S-EGFP and
W-EGFP cells 88
Fig. 9, Expression of genes involved in the mitochondrial pathway for
fatty acid synthesis in S-EGFP and W-EGFP cells 89 Fig. 10, Energy metabolism in S-EGFP and W-EGFP cells 90 Fig. 11, Expression of genes involved in cholesterogenesis in S-EGFP
and W-EGFP cells 91
Fig. 12, Quantitative analyses for cholesterogenic gene expression in
S-EGFP and W-EGFP cells 92
Fig. 13, Expression of genes involved in PPP and NADPH production
in S-EGFP and W-EGFP cells 93
Fig. 14, Quantitative analyses of genes activated in W-EGFP, Sertoli,
and germ cells 94
Fig. 15, Expression of genes potentially implicated in the FLC
differentiation 95
Fig. 16, Expression of genes involved in growth factor signaling 97 Fig. 17, Quality check of scRNA-seq datasets 98
Fig. 18, Characterization of S-EGFP and W-EGFP cells using
scRNA-seq datasets 99
Fig. 19, Differential expression of steroidogenic and glycolytic genes
in the five cell clusters 100
Fig. 20, Differential expression of TCA cycle genes in the five cell clusters 101 Fig. 21, Differential expression of OXPHOS genes in the five cell clusters 102 Fig. 22, Differential expression of genes involved in PPP and NADPH
production in the five cell clusters 105
Fig. 23, Differential expression of genes involved in cholesterogenesis
in the five cell clusters 106
Fig. 24, Activation of Tmsb10 in cluster C 107
Fig. 25, TMSB10-positive cells in the interstitial space 108 Fig. 26, Suppression of FLC differentiation by Tmsb10 KD 109 Fig. 27, Activation of FLC differentiation by SAG 110 Fig. 28, FLE-driven transcription activated by GLI1/GLI2 111 Fig. 29, Expression of genes required for hedgehog signaling affected
by Tmsb10 KD in W-EGFP cells 113
Fig. 30, Expression of genes required for hedgehog signaling affected
by Tmsb10 KD in NIH3T3 cells 114
Fig. 31, Transient activation of Gli1 in cluster C 115 Fig. 32, Primary cilia formation affected by Tmsb10 KD in W-EGFP cells 116
LIST OF TABLES
Table 1, Primary and secondary antibodies, and their dilution ratios
used for immunofluorescence analyses 117
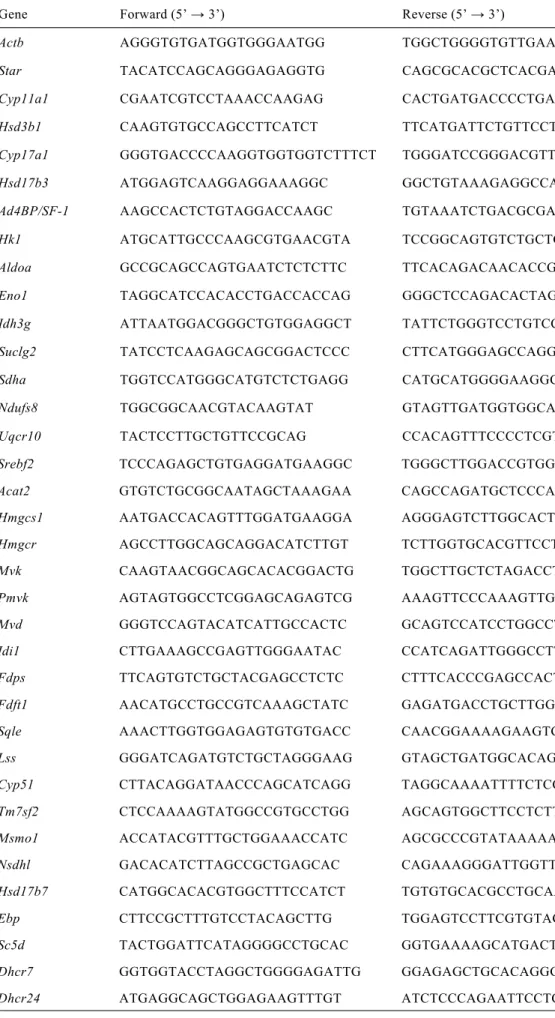
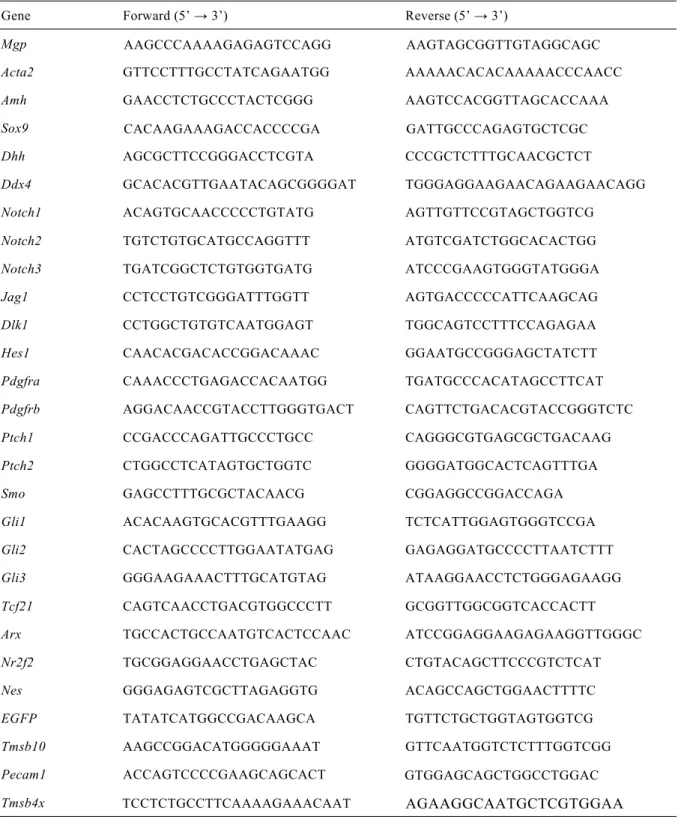
Table 2, Primers used for qRT-PCR analyses 118
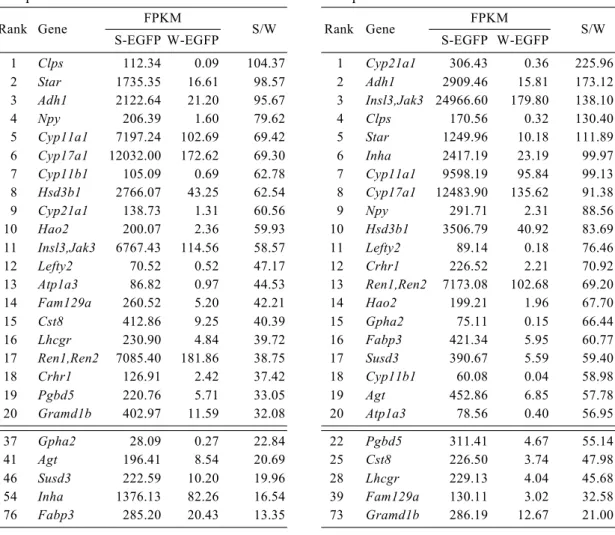
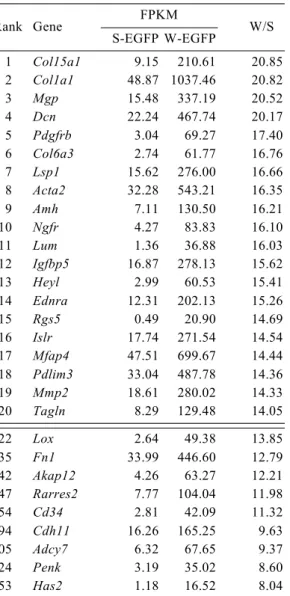
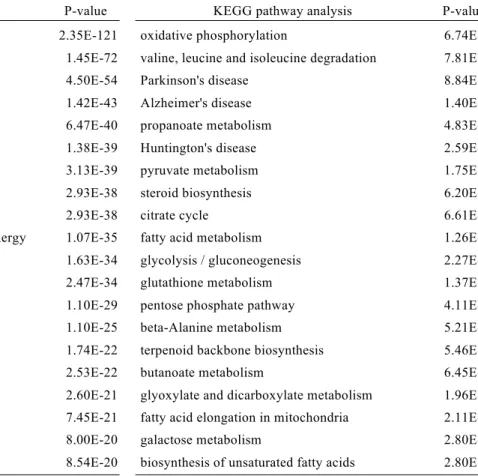
Table 3, Primers used for CEL-Seq2 analyses 120 Table 4, List of top 20 genes with increased expression in S-EGFP cells 121 Table 5, List of top 20 genes with increased expression in W-EGFP cells 122 Table 6, List of top 20 terms obtained by GO and KEGG pathway analyses
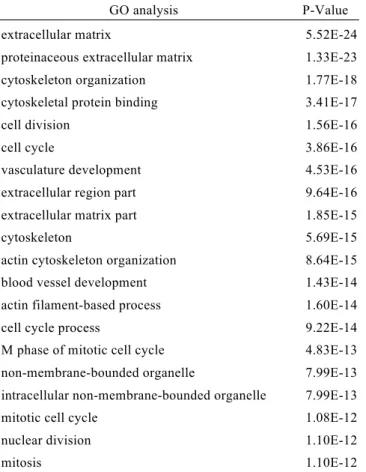
using genes with increased expression in S-EGFP cells 123 Table 7, List of top 20 terms obtained by GO and KEGG pathway analyses
using genes with increased expression in W-EGFP cells 124
ABSTRACT
Fetal Leydig cells (FLCs) appear in the interstitial space of fetal testes, and play pivotal roles for masculinization of fetuses through testosterone synthesis. Over the past two decades, the molecular mechanisms of FLC differentiation have been studied primarily with genetically modified animals. As the consequence, many transcription factors and growth factors have been identified to be implicated in FLC differentiation.
However, to comprehend the mechanisms for FLC differentiation, the functional correlation among the factors above remains to be investigated.
Progenitor cells for FLCs, if identified, could be a powerful tool to study the mechanism for FLC differentiation. Enhanced green fluorescent protein (EGFP) transgenic mice previously established in our laboratory provided us with two cell populations, one of which was strongly EGFP-labeled FLCs (S-EGFP cells) and the other was weakly EGFP-labeled interstitial cells (W-EGFP cells). By in vitro testis reconstruction studies using these EGFP-labeled cell populations, I showed for the first time that the interstitial W-EGFP cells differentiated to S-EGFP (FLCs), indicating that the progenitor cells for FLCs are included in the W-EGFP cell population. Comparison of the transcriptomes of the purified FLCs (S-EGFP cells) and the W-EGFP cells including the progenitors revealed expectedly an elevated expression of the steroidogenic genes in the former cells. Interestingly, the genes involved in other metabolic pathways such as energy production (glycolysis, tricarboxylic acid cycle, and
oxidative phosphorylation) and syntheses for lipid and cholesterol were found to be activated in FLCs. Indeed, oxygen consumption and ATP production were elevated in FLCs.
Since W-EGFP cells seemed to consist of multiple cell populations including FLC progenitors, I performed single-cell transcriptome analyses. The transcriptome data revealed the presence of a unique fraction of cells, which were as if differentiating into FLCs. A few genes such as Tmsb10 (thymosin b10) were identified as a expressed gene in the cell population. As for metabolic genes, several glycolytic gene expressions were elevated in these particular cells. A nuclear receptor, Ad4BP/SF-1 (Ad4 binding
protein/steroidogenic factor 1), has been known to be critical for FLC differentiation, and thus the expression is elevated in FLCs. Investigation of an FLC-specific enhancer of Ad4BP/SF-1 gene raised a possibility that GLI transcription factors activate the gene expression at the downstream of hedgehog signaling. Functional investigation with in vitro testis reconstruction demonstrated that Tmsb10 potentially regulates FLC
differentiation possibly through modulating hedgehog signaling. Although additional studies are required to comprehend how Tmsb10 modulates the hedgehog signaling, the present study advances our understanding of the molecular mechanisms underlying hedgehog dependent FLC differentiation.
INTRODUCTION
Mammalian gonadal sex is determined by the presence or absence of the SRY (sex-determining region of the Y chromosome) gene. Once SRY is expressed in sexually indifferent gonadal somatic cells, they fix their cell fate to develop into Sertoli cells (Albrecht and Eicher, 2001; Gubbay et al., 1990; Hawkins et al., 1992; Koopman et al., 1991; Lovell-Badge and Robertson, 1990; Sinclair et al., 1990). SRY triggers the expression of SOX9 (SRY-box 9), and then SOX9-positive Sertoli cells immediately surround the primordial germ cells to form tubular structures called testicular cords (future seminiferous tubules) (Kidokoro et al., 2005; Sekido et al., 2004; Sekido and Lovell-Badge, 2008; Wilhelm et al., 2007). As the consequence, the basic structure consisting of two distinct compartments, testicular cords and interstitial space, is formed in the fetal testis (Brennan and Capel, 2004) (Fig. 1). Sertoli and germ cells are
localized inside the testicular cords, while a variety of cells, such as Leydig cells, peritubular myoid cells, endothelial cells, macrophages, and uncharacterized interstitial cells, are localized at the interstitial space (Barsoum et al., 2013; DeFalco et al., 2014;
DeFalco et al., 2011; Jameson et al., 2012; Martin, 2016; McClelland et al., 2015; Potter and DeFalco, 2017; Stevant et al., 2018; Svingen and Koopman, 2013).
In 1850, a German scientist, Franz Leydig, first described the cells residing in the interstitial space (Leydig, 1850). Thereafter, evidences supporting the notion that these cells were responsible for the synthesis of androgen were accumulated gradually,
resulting in recognition of their physiological roles of the interstitial cells. Honoring his finding of the physiologically important cells, the androgen producing cells localized in the interstitial space of the testis have been called “Leydig cells”.
The androgen produced by Leydig cells is essential for masculinization and the maintenance of male-specific characters. In mammals, fetal and adult Leydig cells (FLCs and ALCs, respectively) develop in prenatal and postnatal testes, respectively (Roosen-Runge and Anderson, 1959). FLCs appear in the interstitial space of the fetal testes shortly after the sex is determined at around embryonic day 12.5 (E12.5) in mice, and thereafter increase in the number during the fetal days (Griswold and Behringer, 2009; O'Shaughnessy et al., 2006). They produce androstenedione, which is converted to testosterone by HSD17B3 (17b-hydroxysteroid dehydrogenase type 3) expressed in fetal Sertoli cells, indicating that two cell types, FLCs and Sertoli cells, are required for testosterone production in the fetal testis (O'Shaughnessy et al., 2000; Shima et al., 2013). Interestingly, Hsd17b3 is expressed in postnatal ALCs whereas the expression disappears from the postnatal Sertoli cells. Therefore, ALCs can produce testosterone by themselves in the postnatal testes, and the male hormone induces the secondary sexual maturation for males.
Since FLCs rarely proliferate (Miyabayashi et al., 2013; Orth, 1982), it has been thought that their increase in number is primarily due to differentiation from progenitor cells, although they were not identified yet (Kerr and Knell, 1988; Shima and
Morohashi, 2017). Stem/progenitors for ALCs were found in the interstitial space of neonatal testes of rats (Ge et al., 2006). Likewise, in mice, NES (nestin)-positive interstitial cells in the postnatal testes have the potential to differentiate into multiple cell types including ALCs (Jiang et al., 2014; Ye et al., 2017). With respect to genes implicated in ALC differentiation, a gene disruption study showed that COUP-TFII (chicken ovalbumin upstream promoter transcription factor II, Nr2f2) is required for the differentiation probably through the expression in the progenitor cells (Kilcoyne et al., 2014; Qin et al., 2008). Taken together, the ALC stem/progenitors seem to be localized in the interstitial space of neonatal to adult testes. However, it remains to identify and characterize FLC progenitors in the fetal testes.
Gene disruption studies have identified multiple growth factors involved in FLC differentiation. DHH (desert hedgehog) (Barsoum et al., 2009; Yao et al., 2002) and PDGF (platelet-derived growth factors) signals (Brennan et al., 2003) have been shown to promote FLC differentiation. Interestingly, DHH receptors, Ptch1 (patched 1), and PDGF receptor, Pdgfra (Pdgf receptor a), as well as the transcriptional mediators of the hedgehog signal transduction, the GLI-Krüppel family of transcription factors (Gli1 and Gli2), are all expressed in the interstitial cells of the fetal testes (Barsoum and Yao, 2011; Barsoum et al., 2009; Brennan et al., 2003; Yao et al., 2002). Likewise, Notch signaling pathway was shown to contribute to FLC differentiation (Defalco et al., 2013;
Tang et al., 2008). In addition to growth factors, many transcription factors have been
discovered from the studies of gene disrupted mice and human patients (Bielinska et al., 2007; Birk et al., 2000; Buaas et al., 2012; Cui et al., 2004; Hammes et al., 2001;
Katoh-Fukui et al., 1998; Kitamura et al., 2002; Luo et al., 1994; Meeks et al., 2003;
Miyabayashi et al., 2013; Miyado et al., 2012; Miyamoto et al., 1997; Ogata et al., 2012; Park et al., 2005; van den Driesche et al., 2012; Wen et al., 2016; Wen et al., 2014). Taken together, our understanding of the molecular mechanisms for gonad development has been advanced considerably. Unfortunately, however, how these signals are transduced in the FLC progenitor cells remains unclear.
Ad4BP/SF-1 (Ad4 binding protein/steroidogenic factor 1, NR5A1) is a nuclear receptor essential for establishing reproductive functions by regulating genes related to steroidogenesis (Honda et al., 1993; Lala et al., 1992; Morohashi and Omura, 1996;
Parker and Schimmer, 1997), glycolysis (Baba et al., 2014), and cholesterogenesis (Baba et al., 2018). We previously identified a fetal Leydig enhancer (FLE) of
Ad4BP/SF-1 gene (Shima et al., 2012), and generated transgenic mice in which FLCs are labeled with an enhanced green fluorescent protein (EGFP) (Shima et al., 2013).
Interestingly, fluorescence-activated cell sorting (FACS) analyses of the mouse fetal testes provided us with two distinct EGFP-positive cell populations, strongly
EGFP-labeled (S-EGFP) and weakly EGFP-labeled (W-EGFP) cells. Quantitative RT-PCR (qRT-PCR) demonstrated that S-EGFP cells primarily consist of FLCs, and W-EGFP cells consist of interstitial cells.
Throughout my thesis study, I have attempted to comprehend the molecular mechanisms for FLC differentiation via characterizing W-EGFP cell population. An in vitro testis reconstruction study successfully demonstrated that W-EGFP cells contain FLC progenitors. The transcriptomes obtained from S-EGFP and W-EGFP cells
suggests that differentiation of FLCs is accompanied by activation of multiple metabolic pathways. Since these studies revealed the presence of FLC progenitors in W-EGFP cells, I obtained single-cell transcriptomes of W-EGFP cells, and found Tmsb10 (thymosin b10) as a possible key gene regulating hedgehog signaling during FLC differentiation.
MATERIALS AND METHODS
Preparation of EGFP-labeled cells by FACS
Shima et al. identified a DNA fragment in Ad4BP/SF-1 gene, which enhances gene expression specifically in FLCs. To label FLCs with EGFP, FLE-EGFP mice were generated using the DNA fragment (Fig. 2A) (Shima et al., 2012). In addition to this mouse, I used Sox9-EGFP knock-in mice whose Sertoli cells were labeled with EGFP (Nel-Themaat et al., 2009). Male mice from both lines were crossed with ICR females (Japan SLC, Shizuoka, Japan and Kyudo, Saga, Japan). EGFP-positive transgenic testes were harvested at E16.5 and were dispersed as described by Shima et al. (Shima et al., 2013). The EGFP-positive cells were recovered using FACS (JASN; Bay bioscience, Kobe, Japan). In addition to these EGFP-positive cells, another cell population labeled weakly with EGFP was observed in the fetal testes. Thus, these two EGFP-positive cell populations were designated as S-EGFP and W-EGFP cells. All protocols for animal experiments were approved by the Animal Care and Use Committee of Kyushu University.
Immunocytochemistry
The sorted cells (2.0 x 10⁴ cells/well) were cultured on collagen type I coated plate (96-well) (IWAKI, Tokyo, Japan) in a-modified Eagle’s medium (a-MEM) (Nacalai Tesque, Kyoto, Japan) containing 10% fetal bovine serum (FBS) (Thermo Fisher
Scientific, Waltham, MA, USA), penicillin and streptomycin (PS) (Thermo Fisher Scientific) for 4 hrs at 37 °C with 5% CO2. They were fixed with 4% paraformaldehyde (Nacalai Tesque) in phosphate-buffered saline (PBS) at room temperature for 15 min, and then washed with 0.1% Triton X-100 (WAKO, Tokyo, Japan) in PBS. After the cells were treated with 0.5% Triton X-100 in PBS at room temperature for 10 min, they were treated in 1.0% skim milk (WAKO) in PBS at room temperature for 20 min. The cells were treated with the primary antibodies for HSD3B (3b-hydroxysteroid
dehydrogenase) and EGFP at 4 °C overnight. After washing with 0.1% Triton X-100 in PBS, the cells were treated with the secondary antibodies at room temperature for 1 hrs.
F-actin was stained with AlexaFluor-594 phalloidin (Thermo Fisher Scientific). Nuclei were counterstained with 4’6’-diamidino-2-phenylindole (DAPI) (Sigma-Aldrich, St.
Louis, MO, USA). The primary and secondary antibodies used in this study are listed in Table 1. Bright field and immunofluorescence images were obtained using a BZ-9000 fluorescence microscope (Keyence, Osaka, Japan).
In vitro testis reconstruction with cells prepared by FACS
Fetal testes were reconstructed as described by Yokonishi et al. (Yokonishi et al., 2013). Briefly, wild type testes at E16.5 were dispersed by incubating in 2 ml of 0.25%
trypsin (Sigma-Aldrich) in PBS for 10 min at 37 °C. The reaction was arrested by adding 8 ml of Dulbecco’s modified Eagle’s medium (DMEM) (Nacalai Tesque)
containing 10% FBS (Thermo Fisher Scientific) and PS (Thermo Fisher Scientific). The resulting mixture was filtered through membranes with pore sizes of 70 µm and
subsequently 40 µm (Greiner Bio-One, Kremsmünster, Austria). Approximately
8.0 × 10⁵ testicular cells prepared from wild type were mixed with S-EGFP cells (1.0 × 10⁴ cells) or W-EGFP cells (2.0 or 5.0 × 10⁴ cells) isolated from E16.5 fetal testes of the FLE-EGFP transgenic mice. They were cultured on V-shaped agarose gel for 2 days and transferred onto bowl-shaped agarose gel, followed by culturing for 33 days at the longest in a-MEM (Nacalai Tesque) containing 10% Knockout Serum Replacement (Thermo Fisher Scientific) and PS at 37 °C with 5% CO2. To investigate the effect of hedgehog signal on FLC differentiation, reconstructed tissues with W-EGFP cells were treated with smoothened agonist (SAG) (0.5 µM; Adipogen Life Sciences, San Diego, CA, USA) or dimethyl sulfoxide (DMSO) (Nacalai Tesque). The reconstructed tissues were observed under a fluorescent stereomicroscope (SZX16/SZX2-ILLT; Olympus, Tokyo, Japan) and a BZ-X700 fluorescence microscope (Keyence).
Immunofluorescence analyses
Cryosections prepared from fetal testes or reconstructed tissues were subjected to immunostaining as described. (Miyabayashi et al., 2015; Shima et al., 2015; Yokoyama et al., 2019). Briefly, the fetal testes and reconstructed tissues were fixed with 4%
paraformaldehyde at 4 °C overnight. The fixed samples were soaked in 20% sucrose
(Nacalai Tesque) in PBS at 4 °C overnight, and then embedded in OCT Compound (SAKURA, Tokyo, Japan). After washing with PBS, cryosections (10 µm) were boiled for 5 min in 10 mM sodium citrate (pH 6.0) to unmask antigen epitopes. For
immunostaining of TMSB10 and PECAM1 (platelet/endothelial cell adhesion molecule 1), the sections were not boiled. They were treated with 2% skim milk in PBS at room temperature for 30 min, and then incubated with the primary antibodies at 4 °C
overnight. After washing with PBS, the sections were treated with the secondary antibodies at room temperature for 1 hr. The primary and secondary antibodies used in this study are listed in Table 1. Can Get Signal Immunostain Solution A
(TOYOBO, Osaka, Japan) was used to enhance the signals for HSD17B3. Nuclei were counterstained with DAPI (Sigma-Aldrich). Immunofluorescence images were captured using a BZ-9000 fluorescence microscope (Keyence), an LSM700 with Zeiss
AxioObserver Z1 Apotome (Carl Zeiss, Jena, Germany), and an LSM 700 confocal laser scanning microscope (Carl Zeiss).
mRNA-sequencing (mRNA-seq) and data processing
Poly(A) RNAs prepared from S-EGFP and W-EGFP cells were subjected to library construction for mRNA-seq using TruSeq RNA Sample Prep Kit and TruSeq stranded mRNA Sample Prep Kit (Illumina, San Diego, CA, USA). After the quality of the library was validated using Agilent Bioanalyzer 2100 (Agilent Technologies, Santa
Clara, CA, USA), the samples were subjected to sequencing (Genome Analyzer IIx and HiSeq 1000, Illumina). The sequence reads were aligned to the reference mouse
genome sequence (UCSC mm10) using TopHat (version 2.1.0) with the default parameters (Trapnell et al., 2009). Cufflinks (version 2.2.1) was then used to assemble the transcripts and calculate fragments per kilobase of transcript per million mapped fragments (FPKM) with the default parameters (Trapnell et al., 2012). Genes of which FPKM values differed by more than 10 between S-EGFP and W-EGFP cells were extracted. After a pseudo-count of one was added to the FPKM values, genes of which FPKM values differed by more than a factor of two were extracted (Consortium., 2014).
The extracted genes were subjected to Gene Ontology (GO) analysis and Kyoto
Encyclopedia of Genes and Genomes (KEGG) pathway analysis using the Database for Annotation, Visualization and Integrated Discovery (DAVID)
(http://david.abcc.ncifcrf.gov/). mRNA-seq data have been deposited in
DDBJ/EMBL/GeneBank under the accession code DRA004005 and DRA004075.
qRT-PCR analyses
cDNAs were synthesized from total RNAs (n = 3) using Moloney Murine
Leukemia Virus (M-MLV) reverse transcriptase (Thermo Fisher Scientific) and random primers (Sigma-Aldrich). qRT-PCR was performed using a CFX96 real-time PCR system (Bio-Rad Laboratories, Hercules, CA, USA) and SYBR Select Master Mix
(Thermo Fisher Scientific). The expression level of Actb (b-actin) or Rn18s (18S ribosomal RNA) was used as internal control. Primers used for qRT-PCR are listed in Table 2. Data are presented as means +/- standard error of the means (SEM) were statistically analyzed using a two-tailed Student’s t-test or a one-way ANOVA followed by Tukey’s post hoc test.
Library preparation for single-cell RNA-sequencing (scRNA-seq) according to Cell expression by linear amplification sequencing 2 (CEL-Seq2)
Single S-EGFP or W-EGFP cells were plated by FACS (SH800, Sony, Tokyo, Japan) into individual wells of 384-plate (Piko PCR Plate, Thermo Fisher Scientific) pre-loaded with lysis buffer. The CEL-Seq2 protocol established by Hashimshony et al.
was used for library preparation (Hashimshony et al., 2016). Briefly, the RNA of each cell was reverse transcribed using CEL-Seq primers. The primers consisted of an anchored poly(T), a 6 bp unique molecular identifier (UMI), the 5’ Illumina adapter (TruSeq small RNA kit; Illumina), a cell-specific 6 bp barcode, and a T7 promoter (Table 3). After second-strand reaction and cleanup of the cDNA, the double-stranded cDNAs were in vitro transcribed by T7 RNA polymerase. The synthesized RNAs were reverse transcribed using random primers with the 3’ Illumina adapter. Finally, the libraries were amplified by PCR (11 cycles). The pair-ended libraries were sequenced by HiSeq 2500 (Illumina).
Data analysis of single-cell transcriptomes
A first quality check of the sequence data was done using FastQC (version 0.11.7) and thereafter the sequence data were analyzed according to the CEL-Seq2 pipeline (Hashimshony et al., 2016). The pipeline includes the following steps. First, the reads of CEL-Seq2 libraries were demultiplexed to each cell using the CEL-Seq barcode. To identify the transcript, the reads of each cell were mapped to the mouse reference genome (mm10) including EGFP sequence, mitochondrial genome sequences, and the External RNA Controls Consortium (ERCC) spike-in reference by the Bowtie 2 software (version 2.3.4.1) (Langmead and Salzberg, 2012). UMI sequence was
identified in order to remove PCR duplicates. Finally, the mapped reads were counted using HTSeq (version 0.9.1) (Anders et al., 2015).
Low-quality samples were identified and removed by a previously published method (Lun et al., 2016). In brief, they were removed according to certain thresholds of low library sizes, few expressed genes (< 1000 genes), and high spike-in proportions.
The library size is defined as the total sum of the read counts. The quality of libraries with small sizes is likely to be low probably due to inefficient preparation of RNA from cells, and thus the diverse transcript population has not been successfully captured. The numbers of the expressed genes in each cell are defined as the number of genes with non-zero counts. Another criterion of the quality is proportion of the reads mapped to
spike-in transcripts. The quantity of spike-in RNA added to each cell should be constant.
High spike-in RNA proportions may reflect low quality, possibly because the proportion should increase upon loss of endogenous RNA.
Cells at the G1 phase of the cell cycle were selected. Expression of the genes remained was normalized and denoised. The normalized data were subjected to hierarchical clustering on the significant principal components to divide scRNA-seq data into clusters. Differentially expressed genes (DEGs) of each cluster were identified in order to characterize the clusters. R packages including SingleCellExperiment
(version 1.0.0), scater (version 1.6.3), scran (version 1.6.9), Seurat (version 3.0.2), and monocle (version 2.6.4) were used for analyses described above.
Measurement of extracellular acidification rate (ECAR) and oxygen consumption rate (OCR)
The ECAR and OCR of S- and W-EGFP cells was measured using an XF96
extracellular Flux Analyzer (Agilent Technologies), according to the manufacturer’s instructions. After SAG treatment for 24 hrs, the W-EGFP cells were subjected to analysis.
Small interfering RNA (siRNA) treatments
W-EGFP and NIH3T3 cells were cultured on Advanced TC 24-well plates (Greiner Bio-One) in a-MEM and DMEM, respectively, supplemented with 10% FBS and PS.
The cells were transfected with siTmsb10 (Mm01_00030122:
5’-GCUUCGAUAAGGCAAGCUTT- 3’; Sigma-Aldrich), siTmsb4x
(Mm01_00163777: 5’-GCCGCCAAUAUGCACUGUA- 3’; Sigma-Aldrich), and siAd4BP/SF-1 (Mm Nr5a1_1635: 5’-CCUUUAUCUCCAUUGUCGATT- 3’;
Sigma-Aldrich) using lipofectamine RNAiMAX reagent (Thermo Fisher Scientific) according to the manufacturer’s instructions for 24 hrs. A control siRNA (Stealth RNAi Negative Control Medium GC Duplex; Thermo Fisher Scientific) was used as a
negative control. After the treatment for 24 hrs, the W-EGFP cells were cultured in a-MEM and DMEM with SAG (0.5 µM; Adipogen Life Sciences) or DMSO (Nacalai Tesque) to investigate the effect of hedgehog signal.
Luciferase reporter gene assay
The reporter genes FLE-Ad4BPpro-luc and Ad4BPpro-luc were constructed using the promotor less vector pGL3-basic (Promega, Madison, WI, USA). Ad4BPpro-luc carries a 0.9 kb upstream region of Ad4BP/SF-1 gene, while FLE-Ad4BPpro-luc carries a 1.8 kb FLE fragment at the 5’ upstream of the 0.9 kb promoter fragment (Shima et al., 2012). FLE-Ad4BPpro-luc, Ad4BPpro-luc, or pGL3 basic vector (10 ng) was
transfected to NIH3T3 cells with increasing amounts of Gli1 or Gli2 expression
plasmids (20, 100, or 250 ng) using lipofectamine 2000 reagent according to the manufacture’s instruction (Thermo Fisher Scientific). pCMV-SPORT-βgal (Thermo Fisher Scientific) was used as the internal control to evaluate transfection efficiency.
The cells were harvested 48 hrs after the transfection to determine luciferase and
β-galactosidase activities. The analyses were performed in biological triplicate. Data are
presented as the means (SEM), and statistical differences between experimental groups were examined by the two-tailed Student’s t-test.
Analyses of genomic sequences
Genomic sequence conservation of FLE locus among mammal species was
examined using the University of California Santa Cruz (UCSC) genome browser (Kent et al., 2002). The genomic sequences were aligned using the multiple sequence
alignment program, MAFFT (Katoh and Toh, 2008).
RESULTS
W-EGFP cells possibly containing FLC progenitors
FLE-EGFP transgenic mice were established using an EGFP reporter gene controlled by FLE and promoter region of Ad4BP/SF-1 gene. Expectedly, FLCs in the fetal testes were labeled strongly with EGFP (S-EGFP cells) and thus the cells were obtained by FACS. In addition to S-EGFP cells, weakly EGFP-positive (W-EGFP) cells were found as a discrete cell population by FACS (Fig. 2B). qRT-PCR studies showed that S-EGFP and W-EGFP cells correspond to FLCs and interstitial cells other than FLCs, respectively (Shima et al., 2013).
Since FLC progenitors appear in the interstitial space of fetal testes (DeFalco et al., 2011; Jameson et al., 2012; McClelland et al., 2015; Stevant et al., 2018), it was
hypothesized that W-EGFP cells contain the progenitors. To examine it, I performed an in vitro testis reconstruction study, in which whole cells recovered from the fetal testes of wild type (E16.5) were mixed and cultured with S-EGFP or W-EGFP cells. Although W-EGFP cells were recovered as a cell population weakly labeled by EGFP, the weak EGFP signal was not detectable by a fluorescent microscope (Fig. 2, C to F). Testicular cord-like structures were unclear yet after incubation for 4 days (Fig. 3, A, D, G, and J), and became obvious at day 9 (Fig. 3, B, E, H, and K). The EGFP signals of the S-EGFP cells were detectable soon after starting reconstruction (Fig. 3D), and the signals were maintained thereafter (Fig. 3, E and F). Although any EGFP signal was hardly
detectable in the testes reconstructed with the W-EGFP cells before day 9 (Fig. 3, J and K), the signals appeared at day 14 (Fig. 3L), and increased in number thereafter. These EGFP-positive cells were localized in the space outside the testicular cord-like
structures (Fig. 3, E, F, and L).
The EGFP-positive cells were characterized by their immunohistochemical properties using antibodies for HSD3B expressed in Leydig cells (Shima et al., 2012), and for Ad4BP/SF-1 expressed at higher levels in Leydig and at lower levels in Sertoli cells (Hatano et al., 1994). HSD3B and Ad4BP/SF-1 were expressed in the
EGFP-positive cells of the testes reconstructed with S-EGFP cells (Fig. 3, M and N).
HSD3B single-positive cells in Fig. 3M and Ad4BP/SF-1 single-positive cells seen in Fig. 3N and 3Q were possibly derived from the wild type testes used for the
reconstruction. Likewise, the EGFP-positive cells in the testes reconstructed with W-EGFP cells were positive for HSD3B and Ad4BP/SF-1 (Fig. 3, P and Q). These cells were expected to be FLCs but not ALCs. To confirm this, we examined the expression of HSD17B3, an ALC marker (O'Shaughnessy et al., 2000; Shima et al., 2013). As expected, HSD17B3 was not expressed in the EGFP-positive cells (Fig. 3, O and R).
Biological pathways activated in S-EGFP cells
To characterize the progenitor cells, I obtained transcriptome of S-EGFP and W-EGFP cells. Sequencing (Seq-I and Seq-II) was performed with poly(A) RNAs
prepared from two biologically independent samples each for S-EGFP and W-EGFP cell fraction. As a control, a single sample of Sertoli cells from fetal testes was used.
Sequence reads qualitically enough for bioinformatics analyses were obtained with all RNA samples above, for which mapping rates were approximately 98% (Fig. 4A).
Sequence data from the biological duplicates for S-EGFP and W-EGFP cells showed high correlation coefficient (0.987 for S-EGFP cells and 0.991 for W-EGFP cells, Fig.
4B). Consistent with it, up-regulated genes in S-EGFP and W-EGFP cells revealed by Seq-I were quite similar to those revealed by Seq-II (Tables, 4 and 5). However, the sequence data indicated that the W-EGFP cell fraction used for Seq-I contained Sertoli cell contamination; a representative Sertoli cell marker gene, Amh (anti-Müllerian hormone), was ranked 9th in Seq-I study (Table 5). Therefore, I will describe mainly the results of Seq-II later in this thesis.
Comparison of the levels of expression between S-EGFP and W-EGFP cells revealed 1,406 and 1,048 genes whose expression was more than doubled in the former and the latter cells, respectively. Using the 1,406 genes enriched in S-EGFP cells, we evaluated the biological pathways activated in these cells by GO and KEGG pathway analyses (Table 6). As expected, pathways related to steroid metabolism were identified as an activated pathway in S-EGFP cells in both analyses. Indeed, steroidogenic genes such as Star (steroidogenic acute regulatory protein), Cyp11a1 (cholesterol side chain cleavage P450), Cyp17a1 (17a-hydroxylase/17,20-lyase P450), and Hsd3b1
(3b-hydroxysteroid dehydrogenase type 1) required for producing androstenedione were among the top 20 genes up-regulated in S-EGFP cells (Table 4). Cyp21a1
(21-hydroxylase P450) and Cyp11b1 (11b-hydroxylase P450), essential for
adrenocorticoid production, are usually expressed in the adrenal cortex but not Leydig cells. Unexpectedly, however, these genes were also listed as the genes enriched in S-EGFP cells, although their FPKM values were considerably lower than those required for androstenedione production. This ectopic expression may be a result of their
development from common progenitor cells (Hatano et al., 1996). Indeed, FLCs were reported to have an ability to synthesize glucocorticoid in response to adrenocortical tropic hormone (O'Shaughnessy et al., 2003). The steroidogenic gene expression activated in S-EGFP cells was validated by qRT-PCR. Star, Cyp11a1, Hsd3b1, and Cyp17a1 gene transcripts were more abundant in S-EGFP cells than in W-EGFP and Sertoli cells (Fig. 5, A to D, and Fig. 6). Consistent with previous reports
(O'Shaughnessy et al., 2000; Shima et al., 2013), Hsd17b3, which mediates the
conversion of androstenedione to testosterone, was expressed only in Sertoli cells in the fetal testes (Fig. 5E and Fig. 6). Ad4BP/SF-1, originally identified as a transcription factor to regulate steroidogenic genes, was expressed abundantly in S-EGFP cells (Fig.
5F and Fig. 6).
In addition to steroid metabolism, I found the pathways/terms related to mitochondrial structures and functions were activated in S-EGFP cells. As for the
functions, tricarboxylic acid cycle (TCA cycle), oxidative phosphorylation (OXPHOS), and fatty acid metabolism were listed with high p-values (Table 6, Figs 7, 8, and 9).
Glycolysis/gluconeogenesis pathways were also listed as the pathways activated in S-EGFP cells. Indeed, sequence datasets demonstrated that the expression of glycolytic, TCA cycle, and OXPHOS genes was mostly increased in S-EGFP cells. The expression level of these genes was further validated by qRT-PCR. Expression of the glycolytic genes, Aldoa (aldolase A) and Eno1 (enolase 1), was higher in S-EGFP than W-EGFP cells, whereas that of Hk1 (hexokinase 1) was similar between the two cell types (Fig. 5, G to I, and Fig. 7). Similarly, TCA cycle genes, Idh3g (isocitrate dehydrogenase 3g), Suclg2 (succinate-coenzyme A ligase, b subunit), and Sdha (succinate dehydrogenase complex, subunit A), were activated in S-EGFP cells (Fig. 5, J to L, and Fig. 7). Ndufs8 (NADH: ubiquinone oxidoreductase core subunit S8) and Uqcr10
(ubiquinol-cytochrome c reductase, complex III subunit X) are components of
mitochondrial respiratory enzyme complexes I and III, respectively, and their products were enriched in S-EGFP cells (Fig. 5, M, N, and Fig. 8). Considering that glycolysis, TCA cycle, and OXPHOS are the central pathways for ATP production, these results suggest that energy production, as well as steroidogenesis, is activated in S-EGFP cells.
Therefore, I examined whether the elevated expression of the energy metabolizing genes leads to activation of energy metabolism in S-EGFP cells. As indicated in Fig.
10A, basal glycolytic activity of W-EGFP cells was lower than that of S-EGFP cells.
Likewise, mitochondrial basal respiration and ATP production were lower in W-EGFP than S-EGFP cells (Fig. 10, B and C). Taken together, these studies demonstrated that energy metabolism is upregulated in S-EGFP cells in terms of the gene expression and biological activity.
Moreover, Baba et al. recently indicated that the cholesterogenic genes are the targets of Ad4BP/SF-1 (Baba et al., 2018). Thus, I examined the sequence datasets of S-EGFP and W-EGFP cells and found that all cholesterogenic genes were up-regulated in S-EGFP cells (Fig. 11). The cholesterogenic gene expression elevated in S-EGFP cells was confirmed by qRT-PCR (Fig. 12). Interestingly, the expression of Srebf2 (sterol regulatory element binding factor 2), a key regulator of the cholesterogenic genes, was slightly increased, by less than 2-fold (Fig. 11 and Fig. 12A), whereas the expressions of cholesterogenic genes were increased by 2- to 22-fold in S-EGFP cells (Fig. 11, and Fig. 12, B to U). Considering that Ad4BP/SF-1 itself was increased by approximately 17-fold (Fig. 5F and Fig. 6), the increased expression of the
cholesterogenic genes in S-EGFP cells might be primarily due to Ad4BP/SF-1.
Ad4BP/SF-1 directly regulates expression of genes crucial for pentose phosphate pathway (PPP) and nicotinamide adenine dinucleotide phosphate (NADPH) synthesis (Baba et al., 2014; Li et al., 2017). Present mRNA-seq data indicated that the genes related to PPP and NADPH production were more abundant in S-EGFP than W-EGFP cells (Fig. 13). Together, it might be possible to assume that FLC differentiation is
accomplished by activation of energy production (glycolysis, TCA cycle, and OXPHOS), PPP, NADPH production, fatty acid synthesis, and cholesterogenesis in addition to steroidogenesis.
Biological pathways activated in W-EGFP cells
1,048 genes enriched in W-EGFP cells were subjected to pathway analyses. Many of the biological terms identified were related to the extracellular matrix, intracellular cytoskeleton, and cell surface structures (Table 7). Functional terms ‘focal adhesion’
was also identified. Consistent with the biological terms listed above, Col15a1 (collagen, type XV, a1), Dcn (decorin), Mfap4 (microfibrillar-associated protein 4), and Mgp (matrix Gla protein) were found in the top 20 genes (Table 5). The increase of Mgp gene transcripts was validated by qRT-PCR (Fig. 14A). Terms related to active proliferation were also listed, which is consistent with the observation that interstitial cells other than FLCs proliferate actively (Miyabayashi et al., 2013; Orth, 1982). In contrast to S-EGFP cells, no genes related to metabolic pathways were enriched in W-EGFP cells.
Lsp1 (lymphocyte specific 1), Ednra (endothelin receptor type A), and Acta2 (actin a2), which are markers for lymphocytes, vascular endothelial cells, and peritubular myoid cells, respectively, were also among the genes enriched in W-EGFP cells (Table 5). The increase of Acta2 gene transcripts was validated by qRT-PCR (Fig. 14B).
Moreover, the Sertoli cell markers (Amh, Sox9, and Dhh) and germ cell marker (Ddx4 (DEAD box polypeptide 4)) were significantly less in W-EGFP than in Sertoli and whole testicular cells (Fig. 14, C to F).
Expression of genes related to growth factor signaling
Heyl (hairy/enhancer-of-split related with YRPW motif-like) was one of the genes enriched in W-EGFP cells (Table 5). Because Heyl is a Notch downstream gene
(Fischer and Gessler, 2007), and Notch signaling negatively regulates differentiation of FLCs (Defalco et al., 2013; Tang et al., 2008), I examined the expression of factors related to Notch signaling (Fig. 15A and Fig. 16). Among the four Notch genes, the sequence datasets showed that Notch1, Notch2, and Notch3 were enriched in W-EGFP cells (Fig. 16). The qRT-PCR analysis confirmed that these three gene transcripts were more abundant in W-EGFP than S-EGFP cells (Fig. 15, B to D). The Notch ligands Jag1 (jagged 1) and Dlk1 (delta-like 1 homolog) were enriched in S-EGFP and
W-EGFP cells, respectively (Fig. 15, E and F). Similar to Heyl, Hes1 (hes family bHLH transcription factor 1), a transcription factor functioning downstream of the Notch signal (Fischer and Gessler, 2007; Tang et al., 2008), was enriched in W-EGFP cells (Fig. 15G).
Loss-of-function studies have established that the PDGF signal is crucial for FLC differentiation (Brennan et al., 2003). As expected, expression of the PDGF receptors
Pdgfra and Pdgfrb (Pdgf receptor b) was highest in W-EGFP cells (Fig. 15, H and I).
Similarly, DHH secreted from Sertoli cells enhances FLC differentiation (Barsoum et al., 2009; Yao et al., 2002). Indeed, Dhh was enriched in Sertoli cells (Fig. 14E), and the receptors Ptch1, Ptch2 (patched 2), and Smo (smoothened) were enriched in W-EGFP cells (Fig. 15, J to L). Gli1, Gli2, and Gli3 regulate target gene transcription upon hedgehog stimulation. Expression of the three Gli genes was higher in W-EGFP than in S-EGFP cells, although the difference in Gli3 expression was not significant (Fig. 15, M to O).
In addition to the genes above, I examined the expression of the transcription factors, Pod1 (E-box binding transcription factor, Tcf21) (Cui et al., 2004) and Arx (aristaless related homeobox) (Kitamura et al., 2002; Miyabayashi et al., 2013), which were shown to be implicated in FLC differentiation. Both were enriched in W-EGFP cells (Fig. 15, P and Q). Nr2f2 (COUP-TFII) (Kilcoyne et al., 2014; Qin et al., 2008;
van den Driesche et al., 2012) and Nes (Jiang et al., 2014) are expressed in ALC stem/progenitors. These gene transcripts were also enriched in W-EGFP cells (Fig. 15, R and S). Interestingly, the distribution of ARX overlapped with that of COUP-TFII in the interstitial cells of the fetal testes (Fig. 15, T to V).
scRNA-seq of interstitial cells in fetal testes
My study with in vitro testis reconstruction demonstrated that W-EGFP cells contain progenitors for FLCs. To characterize the progenitor cells, I adopted a
scRNA-seq analysis, CEL-Seq2 (Hashimshony et al., 2016). RNAs were prepared from W-EGFP cells of E16.5 mouse fetal testes. The cDNA libraries prepared from the cells were subjected to sequencing. S-EGFP cells were used as control. 0.1 to 0.2 million of mean reads were obtained (Fig. 17A). The median numbers of the expressed genes for S-EGFP and W-EGFP cells were 4,029 and 1,294, respectively. The quality of these transcriptome data was evaluated in terms of their library sizes and the number of the detected genes as described in Material and Methods (Fig. 17B). After the filtration of the data by the evaluation above, 80 datasets from the S-EGFP cells and 341 datasets from the W-EGFP cells were subjected to subsequent analyses.
Possible candidate for FLC progenitors
To assess how many cell groups are present in the interstitial space of the fetal testis, the datasets were subjected to hierarchical clustering on the significant principal components. Cell cycle genes were filtrated out because their expression changes merely depending on cell cycle but not differentiation state (Lun et al., 2016).
Eventually, as indicated in the cluster dendrogram (Fig. 18A), W-EGFP cells were divided into three clusters (cluster A, B, and C) while S-EGFP cells were into two clusters (cluster D and E). The cluster dendrogram made me realized the following
points. Among the relative distances of the clusters, cluster E is the most distant from other clusters, while cluster A and B are not largely distant. Under milder grouping condition, these cells could be divided into three clusters, cluster A+B, cluster C+D, and cluster E. When considering that cluster C and D are originated from distinct
populations, W-EGFP and S-EGFP cells, respectively, the presence of cluster C+D might suggest the presence of a certain cell population differentiating from W-EGFP to S-EGFP cells.
These cell clusters were visualized by principal component analysis (PCA) and t-distributed stochastic neighboring embedding (t-SNE) (Fig. 18, B and C). Consistent with the dendrogram presentation, both plots revealed that cluster E is segregated from other clusters, while cluster A and B distribute like a single-cell group. Cluster C is localized close to cluster A and B, while cluster D is localized between cluster C and E, supporting the notion above that the cells in cluster C and D are differentiating from those in cluster A+B to cluster E. The differentially expressed genes (DEGs) were further applied to monocle trajectory analysis, which predicts the developmental order of the five cell clusters. As indicated in Fig. 18D, it was predicted that the cells in cluster A and B differentiate to those in cluster C, and eventually to those in cluster E thought cluster D. This prediction is likely to be consistent with the results shown in Fig.
18B and 18C.
Expression of steroidogenic and metabolic genes in the five clusters
To characterize the cells in the five clusters, the expression of Ad4BP/SF-1 and steroidogenic genes were plotted. In addition, our laboratory recently identified Mgarp (mitochondria localized glutamic acid rich protein), also called Osap (ovary specific acidic protein) or Hummr (hypoxia up-regulated mitochondrial movement regulator) as a target gene of Ad4BP/SF-1 (Baba et al., 2018). Considering that MGARP facilitates cholesterol transfer to mitochondrial outer membrane (Jinn, S., 2015), Mgarp seems to be an essential component for steroidogenesis.
As shown in Fig. 19A, the expression of Ad4BP/SF-1 gene in cluster D and E is higher than that in cluster A, B, and C. As expected from the function of Ad4BP/SF-1, the steroidogenic genes, Star, Cyp11a1, Hsd3b1, Cyp17a1, and Mgarp were shown to be expressed similarly to that of Ad4BP/SF-1; the expressions of all these steroidogenic genes were lower in cluster A, B, and C, and highest in cluster E (Fig. 19, A to F). The expressions in cluster D are higher than A and B, but lower than E, suggesting that the cells in cluster D are not fully developed yet to FLCs.
As I mentioned, the expressions of the energy metabolizing genes are higher in S-EGFP than W-EGFP cells. Thus, the expressions of the genes implicated in the processes among the five cell clusters were examined. As expected, many glycolytic gene expressions were higher in cluster E, while lower in cluster A and B (Fig. 19, G to R). Interestingly, the expressions of Aldoa, Gapdh (glyceraldehyde 3-phosphate
dehydrogenase), Eno1, and Pkm (pyruvate kinase, muscle) were largely elevated in cluster C and D (Fig. 19, L, N, Q, and R). The expression of Gpi1 (phosphoglucose isomerase 1), Tpi1 (triosephosphate isomerase 1), Pgk1 (phosphoglycerate kinase 1), and Pgam1 (phosphoglycerate mutase 1) gene in cluster C may be in the process of fully activated (Fig. 19, I, M, O, and P). The expression of Hk1 and Hk2 (hexokinase 2) was exceptionally higher only in cluster D (Fig. 19, G and H). Concerning TCA cycle, OXPHOS, PPP, and NADPH production, many gene expressions are higher in cluster D and E, while lower in cluster A and B (Fig. 20, 21, and 22). The expressions of a few genes implicated in TCA cycle, OXPHOS, PPP, and NADPH production in cluster C were at intermediate levels between cluster A and B, and cluster D and E.
Similar to the energy metabolic genes, the expression of cholesterogenic genes is activated in S-EGFP cells (Fig. 11 and 12). Thus, the expression profiles of these genes were examined. All the gene expressions were elevated in cluster E (Fig. 23). The expression levels in cluster D was varied, including fully activated, less activated and not activated. In addition to steroidogenic genes, cholesterogenic gene expressions were not activated in cluster C.
Expression of marker genes in the five clusters
Genes of which expressions are altered, whichever increased or decreased,
specifically in cluster C are considered to be critical for comprehend the mechanism for
FLC differentiation. Thus, a heatmap of gene expression was generated by paying attention to the genes above (Fig. 24A). The genes in group-I showed the highest
expression in cluster E or cluster E and D. As expected, FLC marker genes such as Insl3 (insulin-like 3), Cyp11a1, and Hsd3b1 were included in this group-I. The genes in group-II showed higher expression in cluster C, D, and E. Interestingly, several large ribosomal subunit genes were included in this group. Finally, the genes in group-III show higher expression in cluster C than others. Considering the developmental
trajectory shown in Fig. 18D, it might be possible to assume that the genes in group-III might act as key players for FLC differentiation.
Unique expression of Tmsb10
Among the genes in group-III, the expression of Tmsb10 was examined in detail.
Tmsb10 belongs to a thymosin beta family of small proteins. Another member of the family, Tmsb4x (thymosin b4x), is quite similar to Tmsb10 in their amino acid sequences, both of which are composed of 44 amino acids (Goldstein, 2007). The function of TMSB4X has been known to sequester actin monomer to suppress actin polymerization (Safer et al., 1991; Safer et al., 1990). Likewise, TMSB10 was reported to have the same ability (Yu et al., 1993). In addition, another study uncovered the activity of TMSB10 to suppress RAS signaling through inhibiting RAS-RAF interaction (Lee et al., 2005). However, the function of TMSB10 still remains largely controversial.
Among the five cell clusters, Tmsb10 showed the highest expression in cluster C, and then decreased in clusters D and E. The expression in cluster C seemed to be
approximately 4-fold higher than that in cluster E (Fig. 24B). Tmsb4x showed an expression differently from Tmsb10 (Fig. 24C).
The expression of TMSB10 was examined with immunofluorescence in E16.5 fetal testes of FLE-EGFP mice where FLCs are labeled by EGFP. Sertoli and germ cells as localized in the testicular cords indicated by the broken lines in Fig. 25C, G and K were all negative for TMSB10. Likewise, S-EGFP FLCs did not express TMSB10 as
indicated by the open arrowheads in Fig. 25A to D. Strong signals for TMSB10 were detected in certain cells in the interstitial space as indicated by the arrows in Fig. 25A to D. Unfortunately, however, the signals were colocalized with the signals for PECAM1, an endothelial cell marker. With careful observation, I noticed that cells showing weak TMSB10 signals are present in the interstitial space as indicated by the closed
arrowheads in Fig. 25E to L. Many of these cells were weakly stained with EGFP, and these double positive cells were frequently observed around the testicular cords.
Because I wanted to exclude the possibility that endothelial cells showing a strong TMSB10 signal were contaminated into W-EGFP cell population, EGFP-negative cells were examined if they contain PECAM1 positive endothelial cells. qRT-PCR revealed that the Pecam1-positive endothelial cells were collected in the EGFP-negative but not
W-EGFP cell fraction (Fig. 25, M to O), indicating that TMSB10-positive cells other than endothelial cells are present in the interstitial space.
Possible implication of Tmsb10 into FLC differentiation
Because of the unique expression, I examined whether Tmsb10 is required for FLC differentiation using knockdown (KD) technique with siRNA. First, KD efficiencies were examined with W-EGFP cells. All siRNAs for Tmsb10, Tmsb4x, and Ad4BP/SF-1 led to clear reduction of their corresponding gene expression (Fig. 26, A to C). The expression of Tmsb10 was likely affected even by the treatment with the siRNAs for Tmsb4x probably due to their similarity of the nucleotide sequences. Although I tried KD with another siRNA for Tmsb4x, such cross inhibition was not dissolved.
After W-EGFP cells were treated with the siRNAs, they were applied to testis reconstruction assays. As indicated in Fig. 26G, EGFP-positive (S-EGFP) cells were detected in the reconstructed testes using the W-EGFP cells treated with control siRNA (siControl). The treatment with the siRNA for Tmsb10 (siTmsb10) resulted in reduction of S-EGFP cells in number (Fig. 26D), whereas the treatment with Tmsb4x siRNA (siTmsb4x) unlikely gave any effect (Fig. 26E). Quantitative examination indicated that the differentiation efficiency from W-EGFP to S-EGFP cells was decreased to 36.7% by the treated with siTmsb10, whereas not affected by siTmsb4x as compared to siControl
(Fig. 26H). Ad4BP/SF-1 siRNA (siAd4BP/SF-1) suppressed the appearance of S-EGFP cells more strongly than Tmsb10 siRNA (Fig. 25, F and H).
Possible implication of Tmsb10 into DHH signaling
It was demonstrated with genes disrupted mice that DHH secreted from Sertoli cells activates FLC differentiation (Barsoum and Yao, 2011; Brennan et al., 2003; Yao et al., 2002). Thus, I examined whether the action of DHH can be recapitulated in testis reconstruction assays. Expectedly, the treatment with a SMO agonist (SAG) increased the number of S-EGFP cells in the reconstructed testis by approximately 7-fold (Fig. 27, A to G). Concomitantly, the latency of the differentiation was shortened. Under this condition, it was examined whether Tmsb10 affects the SAG activated differentiation.
The number of S-EGFP cells increased by the SAG treatment was largely decreased by Tmsb10 KD, while siTmsb4x did not give any significant effect (Fig. 27H). The
treatment with siAd4BP/SF-1 led to larger decrease. These results strongly suggested that Tmsb10 regulates FLC differentiation activated by DHH signal.
Activation of Ad4BP/SF-1 gene transcription by Gli
FLC-specific disruption of Ad4BP/SF-1 gene resulted in disappearance of FLCs (Shima et al., 2018). This study clearly indicated that Ad4BP/SF-1 is indispensable for FLC differentiation, and at the same time suggested that Ad4BP/SF-1 gene transcription
is enhanced during FLC differentiation from progenitors in W-EGFP cells. Thus, I assumed that the DHH signal might lead ultimately to activation of Ad4BP/SF-1 gene transcription. As for the transcriptional regulation by hedgehog signal, it has been established that glioma associated Zn-finger transcription factors (GLI1 and GLI2) activate target gene expression (Hui and Angers, 2011; Jiang and Hui, 2008). Therefore, I examined whether GLI activates Ad4BP/SF-1 gene transcription in NIH3T3 cells, which have been widely utilized to monitor hedgehog signaling (Pietrobono et al., 2018;
Rohatgi et al., 2007; Tukachinsky et al., 2010). Luciferase reporter genes were constructed using the basal promoter (Ad4BPpro-luc), or FLE together with the basal promoter (FLE-Ad4BPpro-luc) of the mouse Ad4BP/SF-1 gene. These reporter genes were co-transfected with the expression plasmid for Gli1 or Gli2 into NIH3T3 cells.
Luciferase activity driven by FLE-Ad4BPpro-luc was increased by the plasmids.
However, such increase was detected neither with Ad4BPpro-luc nor control luc plasmid (pGL3-basic) (Fig. 28, A and B). Taken together, these results strongly
suggested that hedgehog signal activates Ad4BP/SF-1 gene transcription through GLI1 and GLI2 binding to target sequence in FLE. To localize the GLI binding sites, FLE was divided into three fragments (FLE1, FLE2, and FLE3 in Fig. 28C), and they were subjected to luciferase reporter gene assays. FLE2 and FLE3 reporter genes were not activated by ectopically expressed GLI2 (Fig. 28D). In contrast, the FLE1 reporter gene was activated by GLI2 in a dose-dependent manner, suggesting the presence of
functional GLI binding sites in FLE1 but not in FLE2 and FLE3. Indeed, potential binding sites for GLI were identified in FLE1, and they are conserved among animal species (Fig. 28E).
Implication of Tmsb10 into Gli1 gene expression
To gain insights into the mechanisms how Tmsb10 regulates hedgehog signaling, it was examined with W-EGFP cells whether Tmsb10 KD affects the expression of the components required for hedgehog signaling. First, KD efficiencies of siTmsb10 and siTmsb4x were evaluated. The mount of Tmsb10 mRNA was largely decreased by the siTmsb10 treatment both in the absence or presence of SAG. Unexpectedly again, the siTmsb4x treatment decreased slightly Tmsb10 mRNA (Fig. 29, A and B). The amount of Tmsb4x mRNA was decreased by the siTmsb4x treatment, and any such effect was not observed in the amount of Tmsb10. The expression of Tmsb10 and Tmsb4x were unaffected by SAG treatment (siControl).
Under this experimental condition, I examined the expression of hedgehog signaling components in W-EGFP cells. SAG treatment induced Ptch1, Ptch2, Gli1, and Gli2 expressions (siCnt in Fig. 29, C, D, F, and G). Interestingly, the expression of these genes in the presence of SAG was significantly decreased by Tmsb10 KD, although such decrease was not observed by Tmsb4x KD. The expression of Smo was affected neither by SAG treatment nor the KD (Fig. 29E). Similar results were obtained
with NIH3T3 cells (Fig. 30). Finally, I examined the expressions of the genes above in the five cell clusters identified by the single-cell transcriptome study. As shown in Fig.
31, the expression profile of Tmsb10 is similar to that of Gli1.
Regulation of primary cilia by Tmsb10
It is unclear how TMSB10 regulates hedgehog signaling. Primary cilia play an essential role in transduction of hedgehog signaling (Ezratty et al., 2011; Grisanti et al., 2016; Pala et al., 2017; Schneider et al., 2010; Schneider et al., 2005; Stasiulewicz et al., 2015). They are ubiquitous microtubule-based organelles in most vertebrate cells, including testicular interstitial cells (Wainwright et al., 2014). Thus, I examined whether primary cilia formation is controlled by Tmsb10 using immunostaining. There seems to be no difference between Tmsb4x knockdown and control (Fig. 32, B and C), whereas knockdown of Tmsb10 gene results in significant decreases in ciliated cells (Fig. 32A).
These results indicated that TMSB10 regulates hedgehog signaling through primary cilia.
DISCUSSION
Characterization of fetal Leydig progenitor cell population
We previously identified a fetal Leydig enhancer (FLE) of Ad4BP/SF-1 (Ad4 binding protein/steroidogenic factor 1) gene, and established a transgenic mouse line in which fetal Leydig cells (FLCs) are labeled strongly with an enhanced green fluorescent protein (EGFP) (Shima et al., 2012). Interestingly, we noticed the presence of weakly labeled cells (W-EGFP cells) in the transgenic fetal testes. Marker gene expression indicated that W-EGFP cells correspond to interstitial cells except for S-EGFP FLCs (Shima et al., 2013). FLCs increase in number rapidly during the fetal days (Griswold and Behringer, 2009; O'Shaughnessy et al., 2006), although FLCs rarely proliferate (Miyabayashi et al., 2013; Orth, 1982). Therefore, the increase has been thought to be due to differentiation from progenitor cells possibly present in the interstitial space of the fetal testis (Kerr et al., 1985; Shima and Morohashi, 2017). However, it was not clarified yet whether FLC progenitors are present in the interstitial cells. In this study, I demonstrated for the first time that not all but a certain cell population in the testicular interstitial space potentially differentiate into FLCs by an in vitro testis reconstruction study. Although in general the efficiency of differentiation in vitro is possibly lower than that in vivo, only 20% or less of the W-EGFP cells used the in vitro study was found to be differentiated into FLCs. It remains to be clarified whether all interstitial cells or particular cells have the ability to differentiate into FLCs.
FLC progenitors characterized by transiently expressed genes
Implication of multiple growth factors into FLC differentiation has been studied by gene disruption. Notch signaling, for example, suppresses (Defalco et al., 2013; Tang et al., 2008) while PDGF (platelet-derived growth factor) signals activated FLC
differentiation (Brennan et al., 2003). Moreover, DHH (desert hedgehog) secreted by Sertoli cells activates FLC differentiation by binding to the DHH receptors PTCH1 (patched1) and/or PTCH2 (patched2) (Barsoum and Yao, 2011; Barsoum et al., 2009;
Yao et al., 2002). Although these knockout mouse studies have indicated that many growth factors regulate FLC differentiation, it has been unclear yet how the cells activated by the signals undergo differentiation into FLCs. To uncover this process, it seemed to be important to identify and characterize FLC progenitors present in W-EGFP cells.
Therefore, I obtained single-cell transcriptomes of W-EGFP cells together with S-EGFP cells. Eventually, I found a cell population characterized by the unique gene expression: Jund (jun D proto-oncogene), Mfap2 (microfibrillar-associated protein 2), and Tmsb10 (thymosin b10) were found to be expressed in the particular cells more than other populations of cells. Interestingly, the analyses of the single-cell datasets predicted that the unique cells are differentiating into FLCs. If it is the case, it reasoned to assume that the genes above are expressing transiently in the progenitors.
Transient expression of genes has been reported to be critical for various cell fate determination. Mammalian sex-determining gene, Sry (sex-determining region of the Y chromosome), is transiently expressed during a sex-determining period to fix the cell fate into male supporting Sertoli cells (Albrecht and Eicher, 2001; Gubbay et al., 1990;
Hawkins et al., 1992; Koopman et al., 1991; Lovell-Badge and Robertson, 1990;
Sinclair et al., 1990). The transient expression is critical to enhance male-enriched expression of FGF9 (fibroblast growth factor 9) and suppress female-enriched
expression of WNT4 (wingless-related MMTV integration site 4) (Colvin et al., 2001;
Kim et al., 2006; Schmahl et al., 2004; Vainio et al., 1999). In fact, artificial delay of the Sry expression could not induce Sertoli cell differentiation (Hiramatsu et al., 2009).
Transient expression of Mash1 (mammalian achaete-scute homolog 1) is necessary for differentiation to ventral, sympathetic and olfactory neurons from progenitors
(Guillemot et al., 1993; Hirsch et al., 1998; Lo et al., 1991; Uchida et al., 2007).
Continued expression of Mash1 resulted in development of neuroblastoma (Axelson, 2004; Ichimiya et al., 2001) possibly due to accelerated proliferation (Isogai et al., 2011). Based on these studies, it has been well accepted that transiently expressed genes act frequently as switches to guide cells to proper differentiation, and thus the
expressions are strictly controlled to prevent any harmful effects. Likewise, the genes transiently expressed in certain interstitial of fetal testes cells may be involved in the